| Param | Original file | Final file |
|---|---|---|
| Filename | modeM0/AS1A14_014T01_9000006528_54968cztM0_level2.fits | modeM0/AS1A14_014T01_9000006528_54968cztM0_level2_quad_clean.evt |
| Size (bytes) | 1,706,676,480 | 203,613,120 |
| Size | 1.6 GB | 194.2 MB |
| Events in quadrant A | 8,670,266 | 1,513,207 |
| Events in quadrant B | 7,433,098 | 1,673,077 |
| Events in quadrant C | 10,266,296 | 1,451,563 |
| Events in quadrant D | 35,553,019 | 410,156 |
| Mode M0 | |||
|---|---|---|---|
| Quadrant | BADHDUFLAG | Total packets | Discarded packets |
| A | 0 | 37509 | 3 |
| B | 0 | 33988 | 3 |
| C | 0 | 42075 | 3 |
| D | 0 | 116862 | 8 |
| Mode SS | |||
|---|---|---|---|
| Quadrant | BADHDUFLAG | Total packets | Discarded packets |
| A | 0 | 332 | 0 |
| B | 0 | 332 | 0 |
| C | 0 | 332 | 0 |
| D | 0 | 332 | 0 |
| Mode M9 | |||
|---|---|---|---|
| Quadrant | BADHDUFLAG | Total packets | Discarded packets |
| A | 0 | 30 | 0 |
| B | 0 | 30 | 0 |
| C | 0 | 30 | 0 |
| D | 0 | 30 | 0 |
| Quadrant | Total seconds | Saturated seconds | Saturation percentage |
|---|---|---|---|
| A | 16186 | 635 | 3.923143% |
| B | 16186 | 319 | 1.970839% |
| C | 16186 | 736 | 4.547140% |
| D | 16186 | 11772 | 72.729519% |
Noise dominated data is calculated using 1-second bins in cleaned event files. If a bin has >2000 counts, and if more than 50% of those come from <1% of pixels, then it is considered to be noise-dominated and hence unusable.
| Quadrant | # 1 sec bins | Bins with >0 counts | Bins with >2000 counts | High rate bins dominated by noise | Noise dominated (total time) | Noise dominated (detector-on time) | Marked lightcurve |
|---|---|---|---|---|---|---|---|
| A | 19256 | 16190 | 235 | 235 | 1.22% | 1.45% | 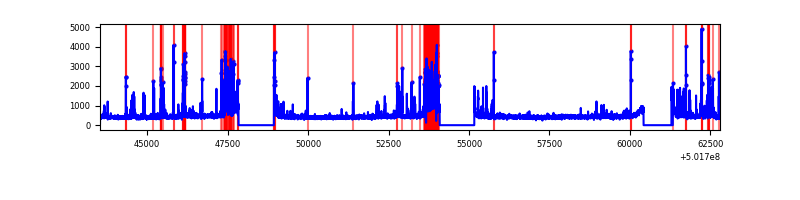 |
| B | 19256 | 16190 | 7 | 7 | 0.04% | 0.04% | 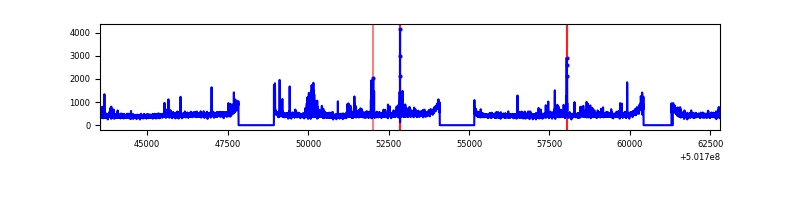 |
| C | 19256 | 16190 | 409 | 409 | 2.12% | 2.53% | 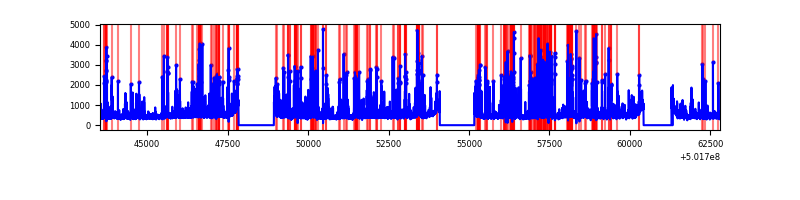 |
| D | 19256 | 16189 | 11396 | 11396 | 59.18% | 70.39% | 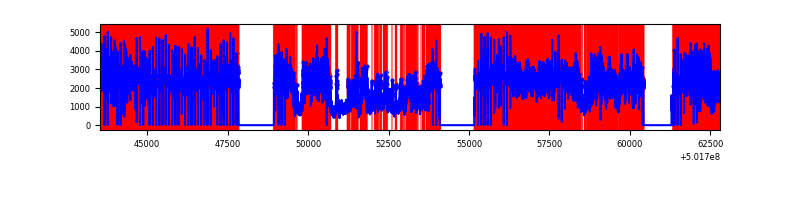 |
Top three noisy pixels from each quadrant. If the there are fewer than three noisy pixels in the level2.evt file, extra rows are filled as -1
| Pixel properties | Quadrant properties | ||||||
|---|---|---|---|---|---|---|---|
| Quadrant | DetID | PixID | Counts | Sigma | Mean | Median | Sigma |
| A | 15 | 32 | 1355441 | 3143.71 | 1768 | 1721 | 430.6 |
| A | 0 | 8 | 130336 | 298.68 | 1768 | 1721 | 430.6 |
| A | 13 | 248 | 122294 | 280.0 | 1768 | 1721 | 430.6 |
| B | 5 | 172 | 201132 | 527.96 | 1766 | 1699 | 377.7 |
| B | 5 | 185 | 74529 | 192.8 | 1766 | 1699 | 377.7 |
| B | 2 | 249 | 62335 | 160.52 | 1766 | 1699 | 377.7 |
| C | 4 | 5 | 2650978 | 5630.42 | 1725 | 1709 | 470.5 |
| C | 12 | 252 | 188861 | 397.75 | 1725 | 1709 | 470.5 |
| C | 6 | 223 | 185546 | 390.7 | 1725 | 1709 | 470.5 |
| D | 15 | 94 | 30717162 | 118446.07 | 912 | 873 | 259.3 |
| D | 2 | 249 | 288420 | 1108.82 | 912 | 873 | 259.3 |
| D | 6 | 239 | 167093 | 640.97 | 912 | 873 | 259.3 |
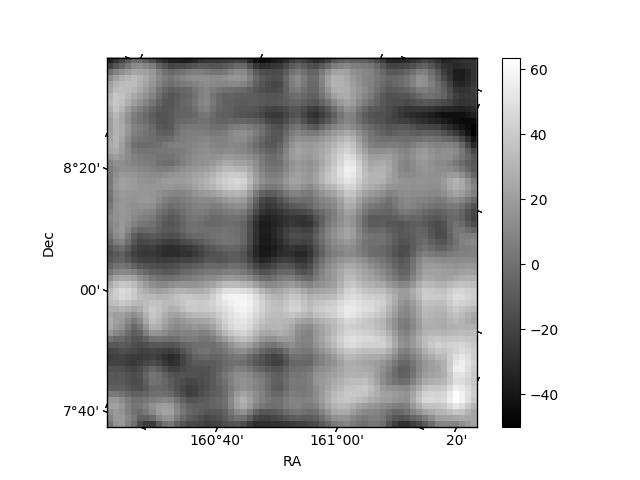
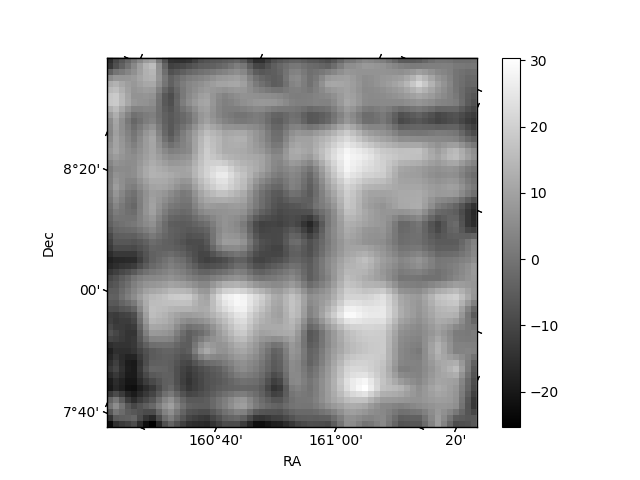
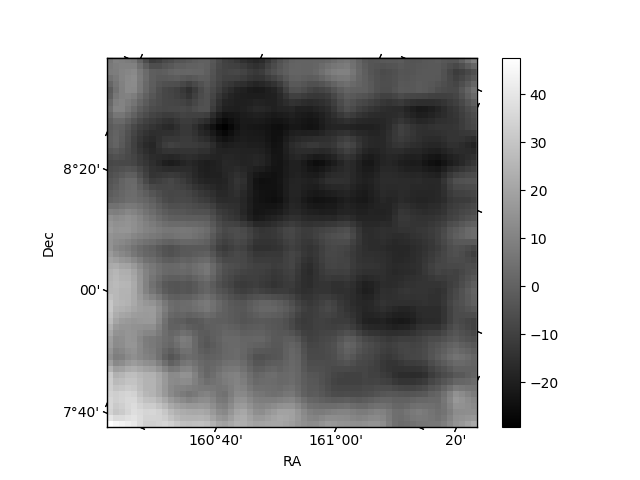
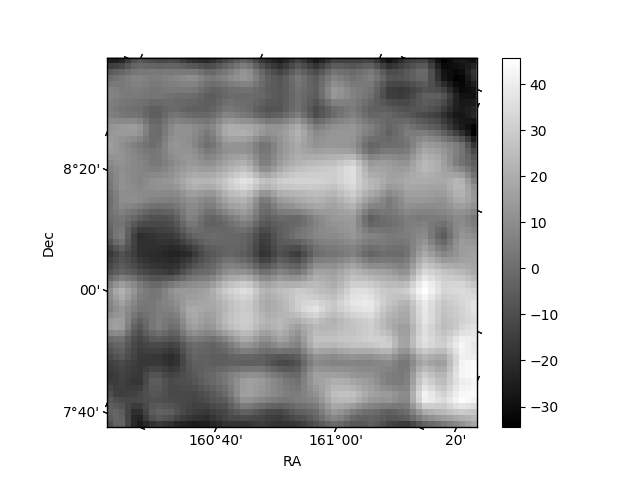
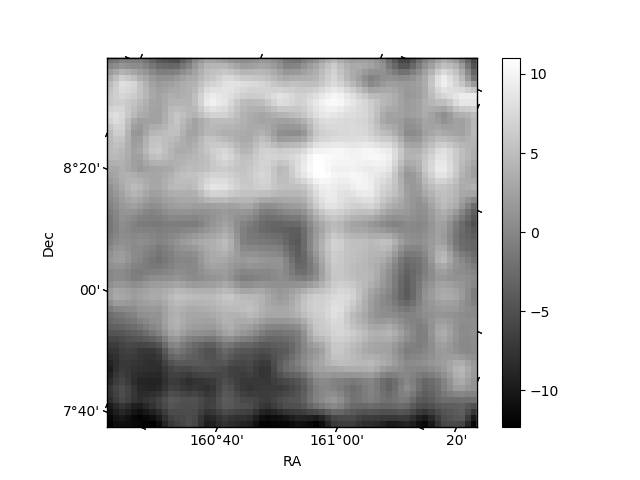
Histogram calculated using DETX and DETY for each event in the final _common_clean file
| Quadrant A | 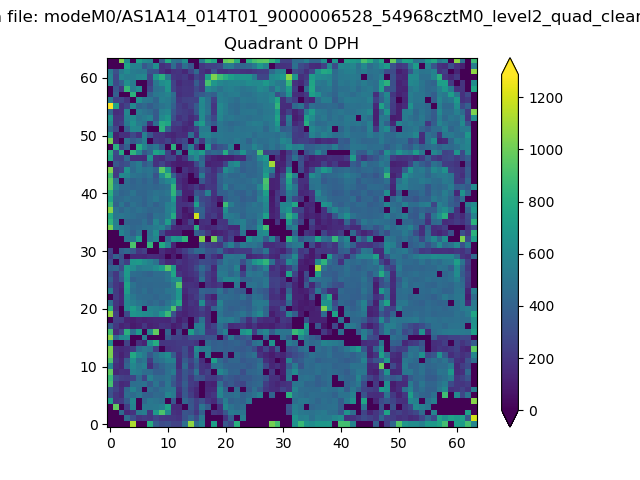 |
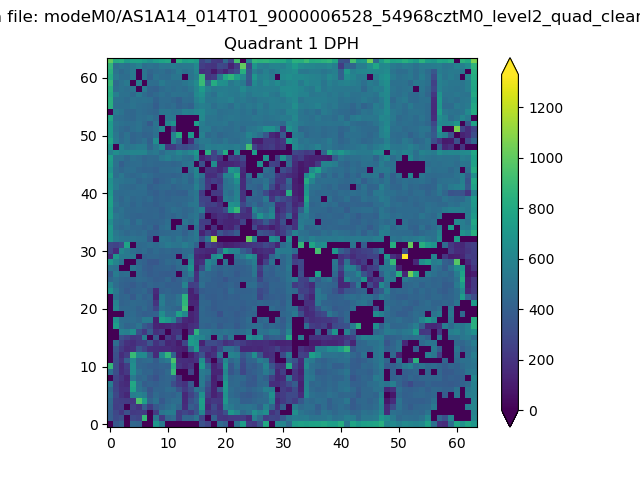 |
Quadrant B |
|---|---|---|---|
| Quadrant D | 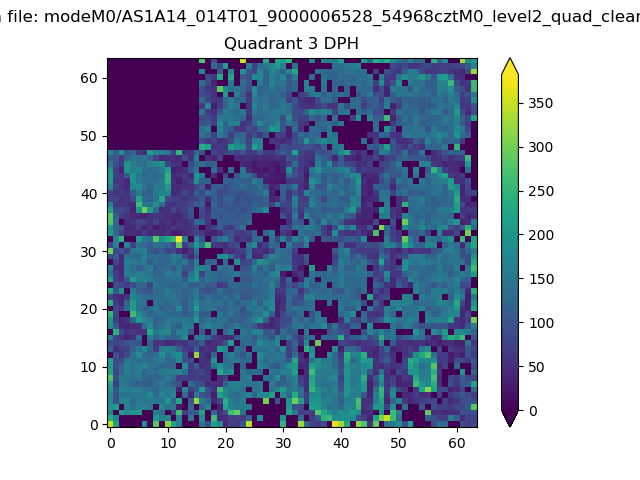 |
 |
Quadrant C |
| Plot type | Count rate plots | Images |
|---|---|---|
| Comparison with Poisson distribution Blue bars denote a histogram of data divided into 1 sec bins. Red curve is a Poisson curve with rate = median count rate of data. |
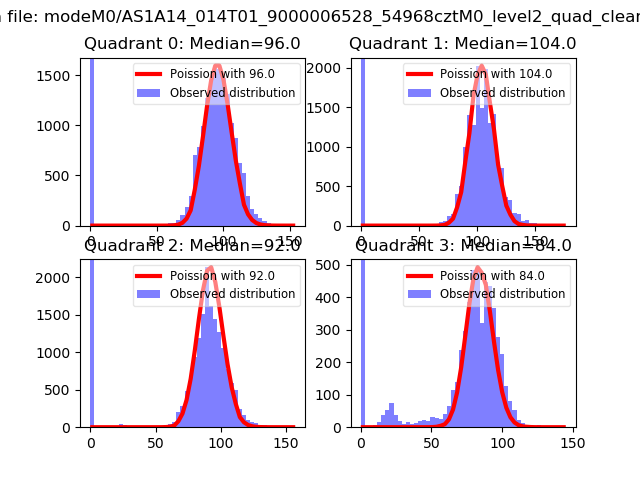 |
 |
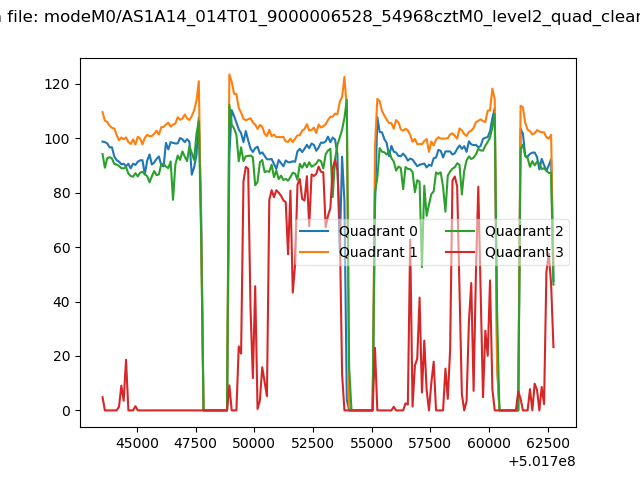
| Quadrant-wise count rates Data is divided into 100 sec bins |
 |
|
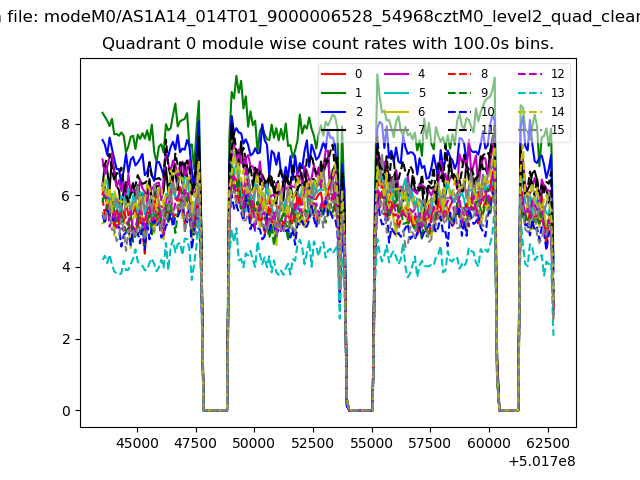
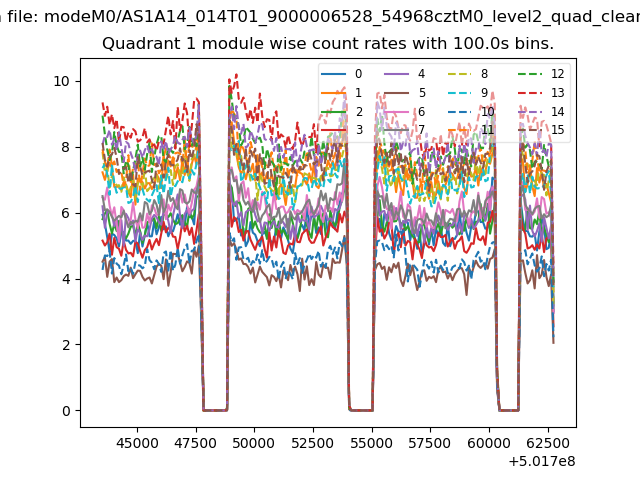
| Module-wise count rates for Quadrant A Data is divided into 100 sec bins |
 |
 |
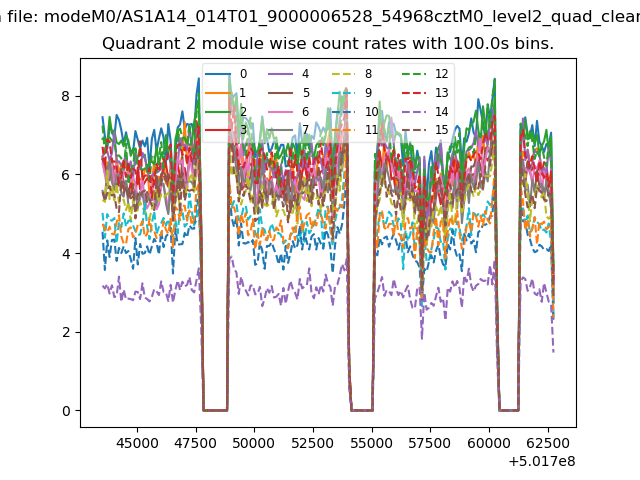
| Module-wise count rates for Quadrant B Data is divided into 100 sec bins |
 |
 |
| Module-wise count rates for Quadrant C Data is divided into 100 sec bins |
 |
 |
| Module-wise count rates for Quadrant D Data is divided into 100 sec bins |
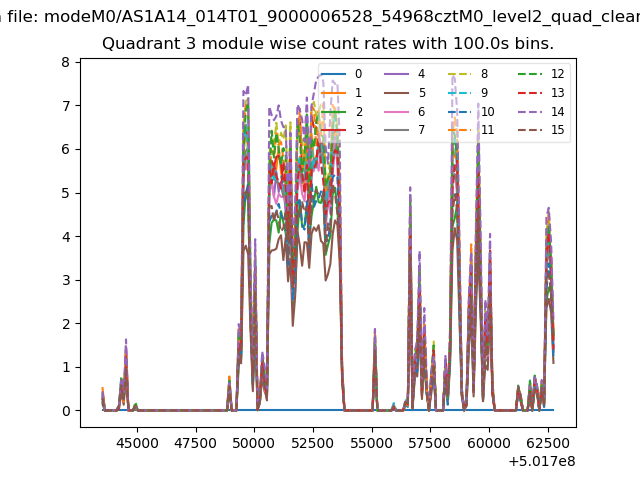 |
 |
| Parameter | Plot |
|---|---|
| CZT HV Monitor | 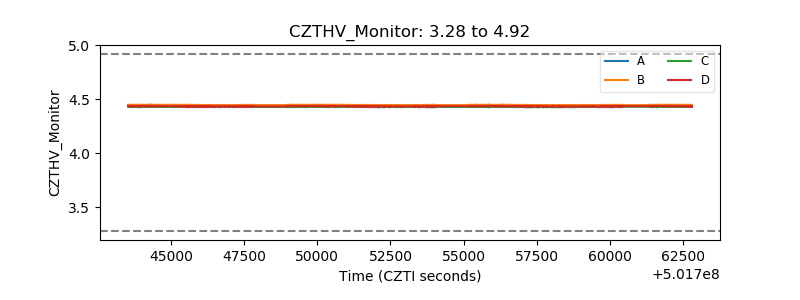 |
| D_VDD | 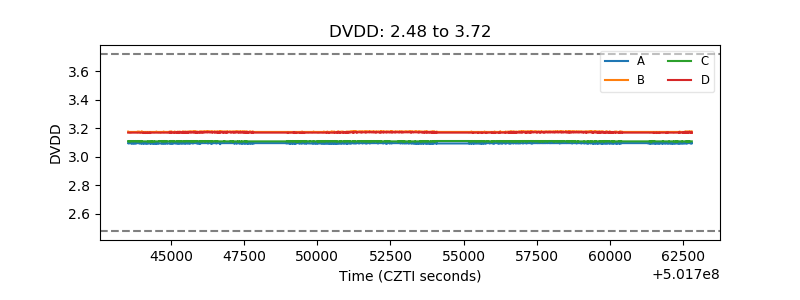 |
| Temperature 1 | 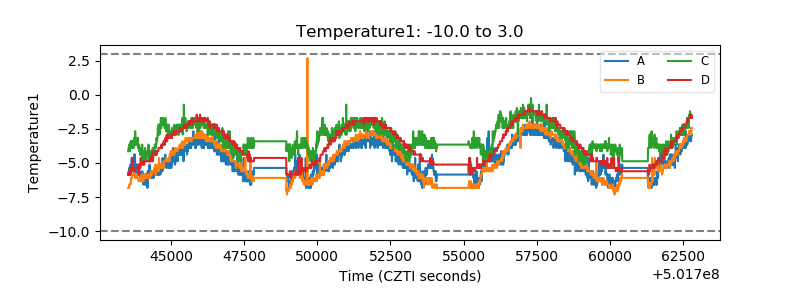 |
| Veto HV Monitor | 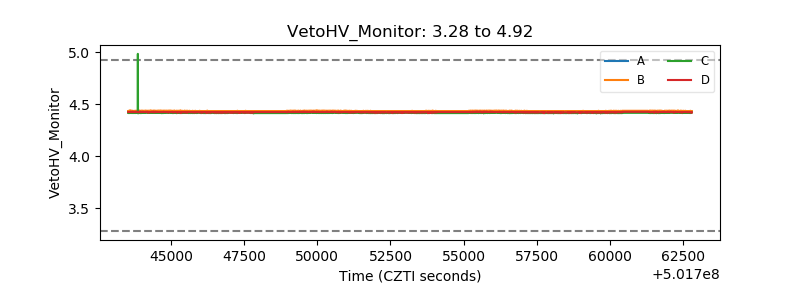 |
| Veto LLD | 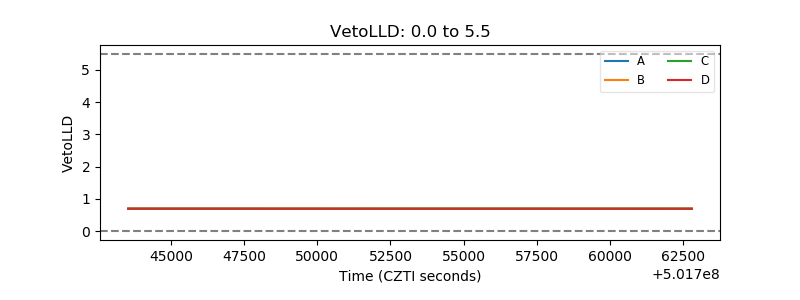 |
| Alpha Counter | 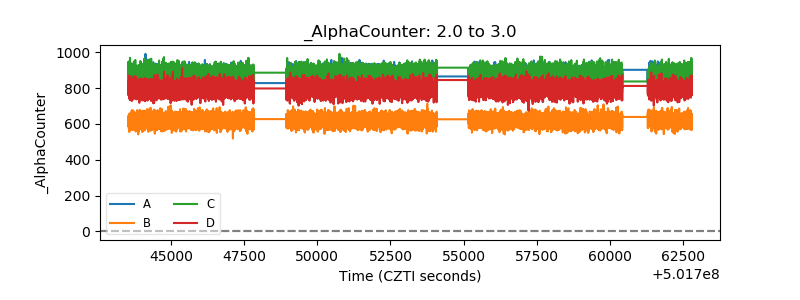 |
| _CPM_Rate | 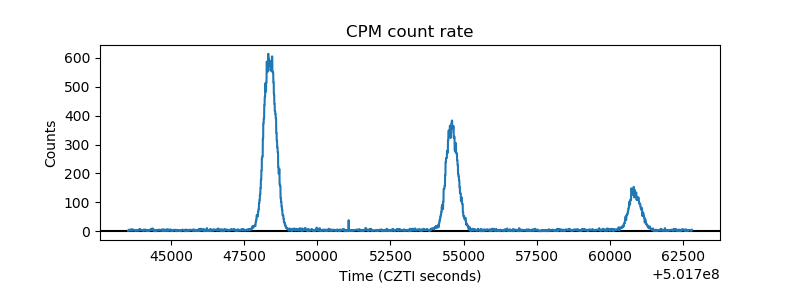 |
| CZT Counter |  |
| +2.5 Volts monitor |  |
| +5 Volts monitor |  |
| _ROLL_ROT | 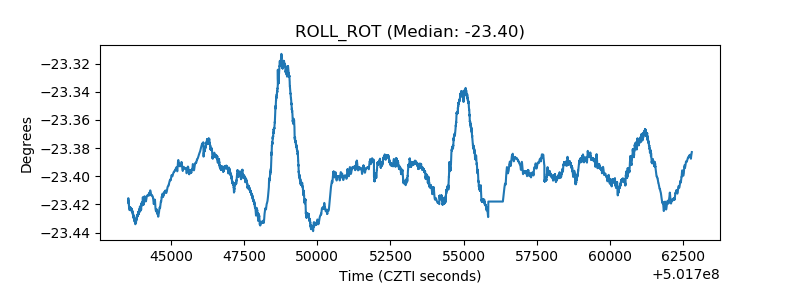 |
| _Roll_DEC | 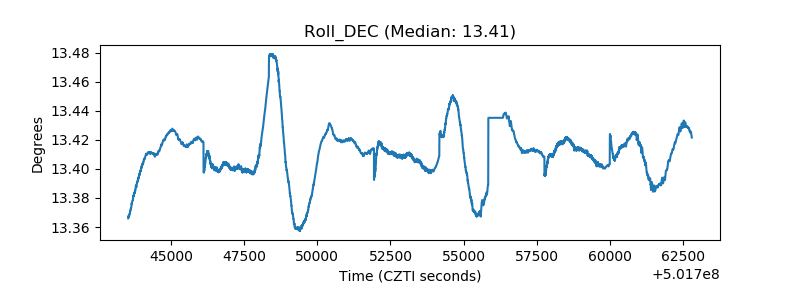 |
| _Roll_RA | 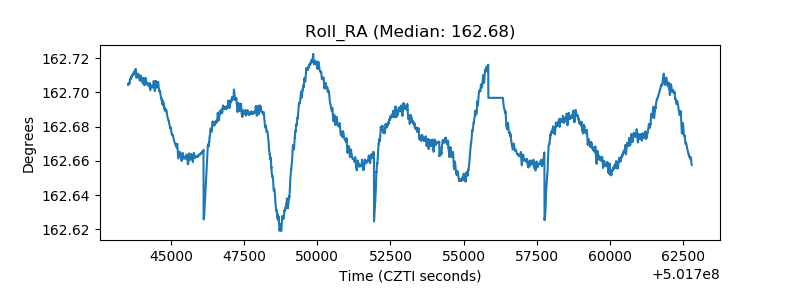 |
| Veto Counter | 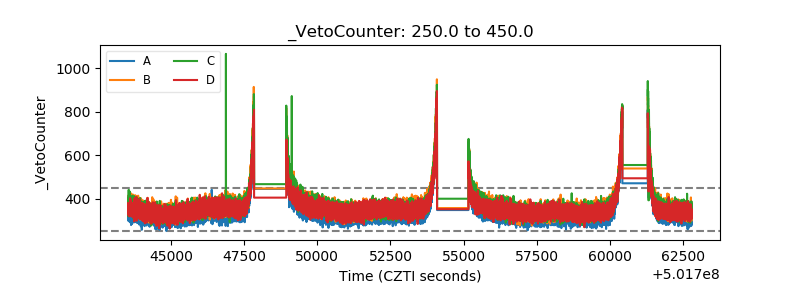 |