| Param | Original file | Final file |
|---|---|---|
| Filename | modeM0/AS1A14_014T01_9000006528_54969cztM0_level2.fits | modeM0/AS1A14_014T01_9000006528_54969cztM0_level2_quad_clean.evt |
| Size (bytes) | 731,952,000 | 77,054,400 |
| Size | 698.0 MB | 73.5 MB |
| Events in quadrant A | 6,209,157 | 472,639 |
| Events in quadrant B | 2,915,262 | 644,532 |
| Events in quadrant C | 3,451,057 | 567,337 |
| Events in quadrant D | 14,020,876 | 201,033 |
| Mode M0 | |||
|---|---|---|---|
| Quadrant | BADHDUFLAG | Total packets | Discarded packets |
| A | 0 | 22902 | 1 |
| B | 0 | 13486 | 1 |
| C | 0 | 14902 | 1 |
| D | 0 | 46074 | 1 |
| Mode SS | |||
|---|---|---|---|
| Quadrant | BADHDUFLAG | Total packets | Discarded packets |
| A | 0 | 130 | 0 |
| B | 0 | 130 | 0 |
| C | 0 | 130 | 0 |
| D | 0 | 130 | 0 |
| Mode M9 | |||
|---|---|---|---|
| Quadrant | BADHDUFLAG | Total packets | Discarded packets |
| A | 0 | 7 | 0 |
| B | 0 | 7 | 0 |
| C | 0 | 7 | 0 |
| D | 0 | 7 | 0 |
| Quadrant | Total seconds | Saturated seconds | Saturation percentage |
|---|---|---|---|
| A | 6416 | 1442 | 22.475062% |
| B | 6416 | 163 | 2.540524% |
| C | 6416 | 199 | 3.101621% |
| D | 6416 | 4275 | 66.630299% |
Noise dominated data is calculated using 1-second bins in cleaned event files. If a bin has >2000 counts, and if more than 50% of those come from <1% of pixels, then it is considered to be noise-dominated and hence unusable.
| Quadrant | # 1 sec bins | Bins with >0 counts | Bins with >2000 counts | High rate bins dominated by noise | Noise dominated (total time) | Noise dominated (detector-on time) | Marked lightcurve |
|---|---|---|---|---|---|---|---|
| A | 7051 | 6416 | 1098 | 1098 | 15.57% | 17.11% | 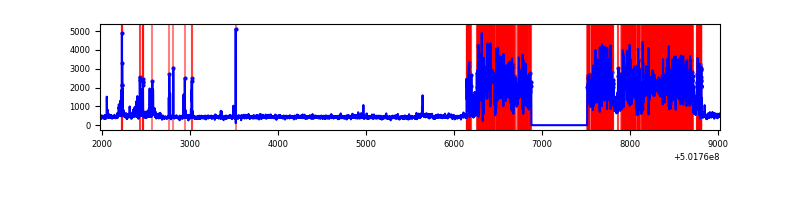 |
| B | 7051 | 6417 | 12 | 12 | 0.17% | 0.19% | 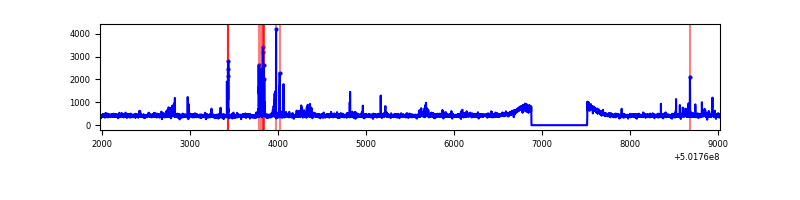 |
| C | 7051 | 6417 | 79 | 79 | 1.12% | 1.23% | 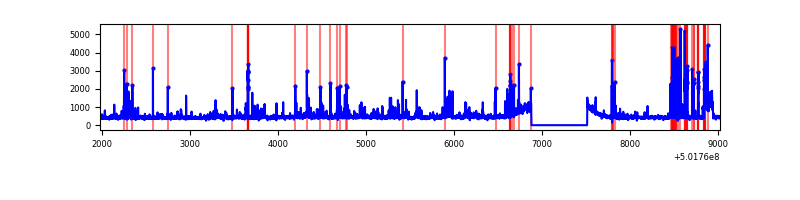 |
| D | 7051 | 6417 | 4264 | 4264 | 60.47% | 66.45% | 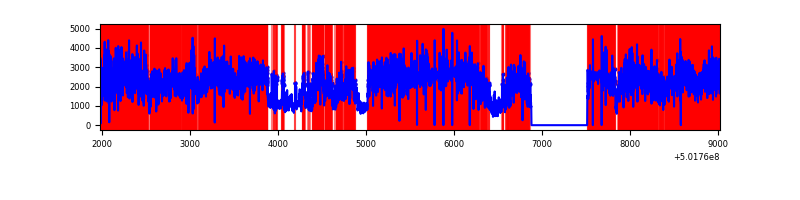 |
Top three noisy pixels from each quadrant. If the there are fewer than three noisy pixels in the level2.evt file, extra rows are filled as -1
| Pixel properties | Quadrant properties | ||||||
|---|---|---|---|---|---|---|---|
| Quadrant | DetID | PixID | Counts | Sigma | Mean | Median | Sigma |
| A | 15 | 32 | 3532682 | 23610.22 | 611 | 596 | 149.6 |
| A | 3 | 14 | 179595 | 1196.52 | 611 | 596 | 149.6 |
| A | 4 | 3 | 40814 | 268.84 | 611 | 596 | 149.6 |
| B | 5 | 185 | 95349 | 628.96 | 692 | 666 | 150.5 |
| B | 0 | 182 | 36092 | 235.33 | 692 | 666 | 150.5 |
| B | 12 | 111 | 18230 | 116.67 | 692 | 666 | 150.5 |
| C | 12 | 252 | 276225 | 1481.24 | 684 | 678 | 186.0 |
| C | 1 | 16 | 115559 | 617.56 | 684 | 678 | 186.0 |
| C | 6 | 223 | 110202 | 588.76 | 684 | 678 | 186.0 |
| D | 15 | 94 | 11346604 | 87210.81 | 452 | 432 | 130.1 |
| D | 2 | 249 | 269275 | 2066.43 | 452 | 432 | 130.1 |
| D | 3 | 12 | 126791 | 971.24 | 452 | 432 | 130.1 |
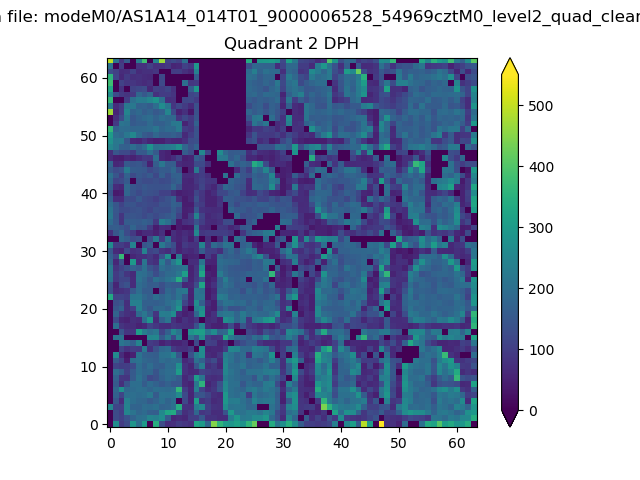
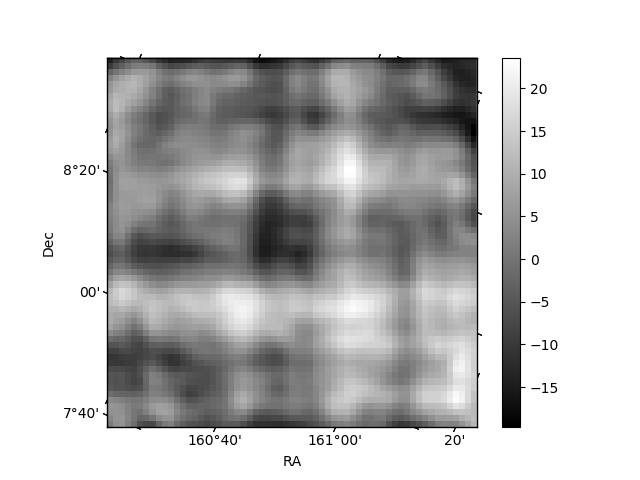
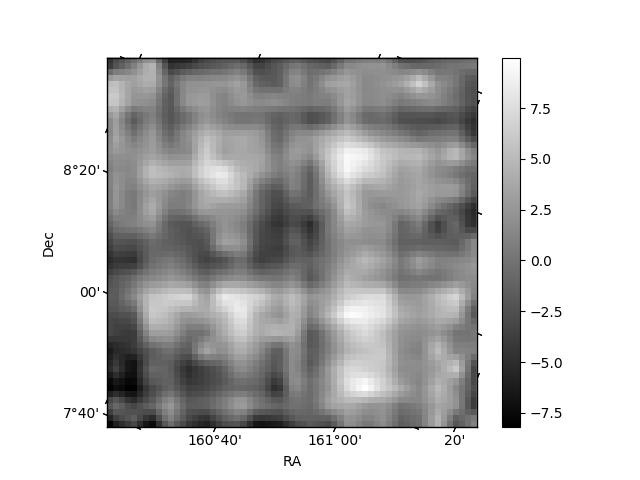
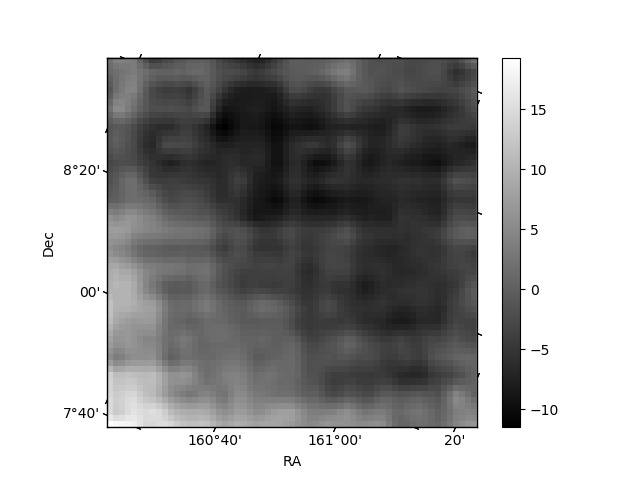
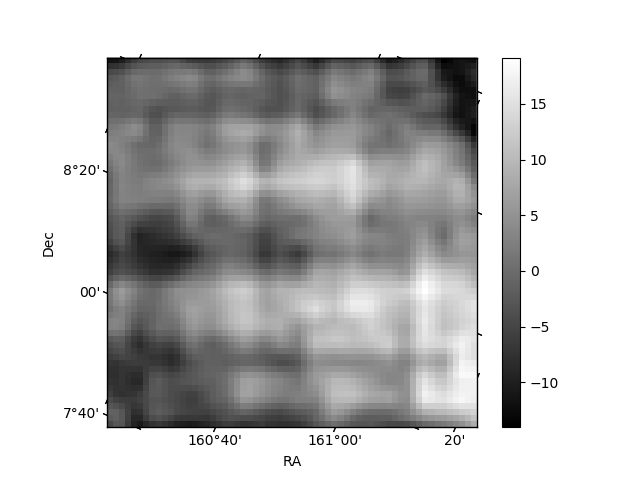
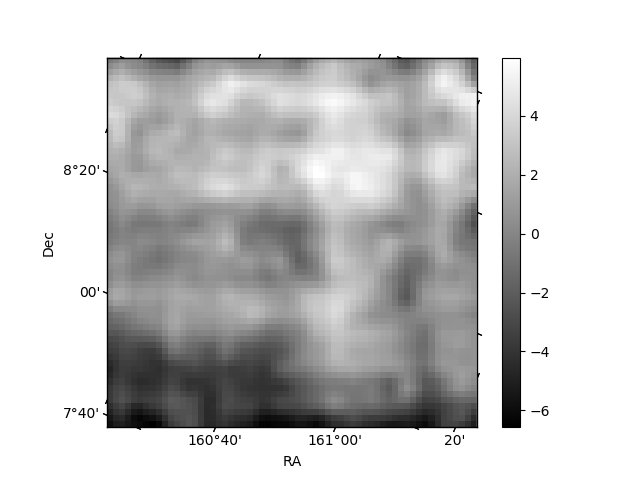
Histogram calculated using DETX and DETY for each event in the final _common_clean file
| Quadrant A | 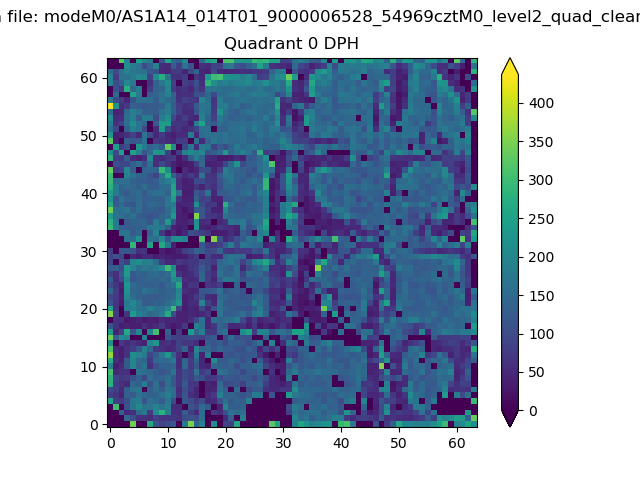 |
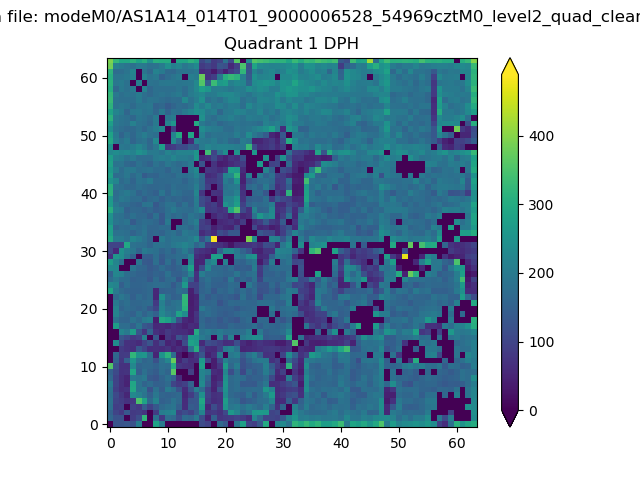 |
Quadrant B |
|---|---|---|---|
| Quadrant D | 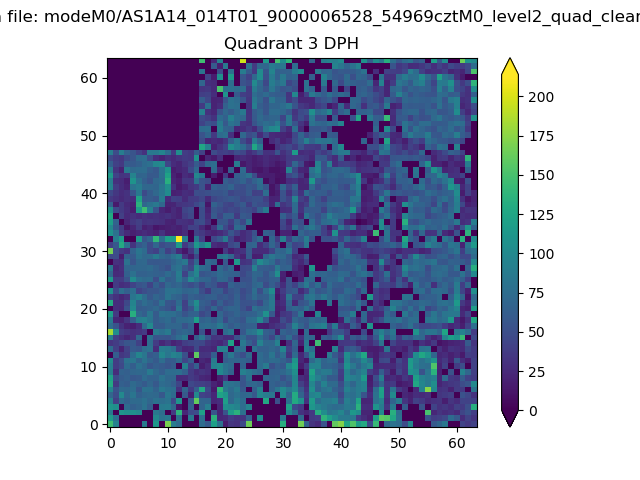 |
 |
Quadrant C |
| Plot type | Count rate plots | Images |
|---|---|---|
| Comparison with Poisson distribution Blue bars denote a histogram of data divided into 1 sec bins. Red curve is a Poisson curve with rate = median count rate of data. |
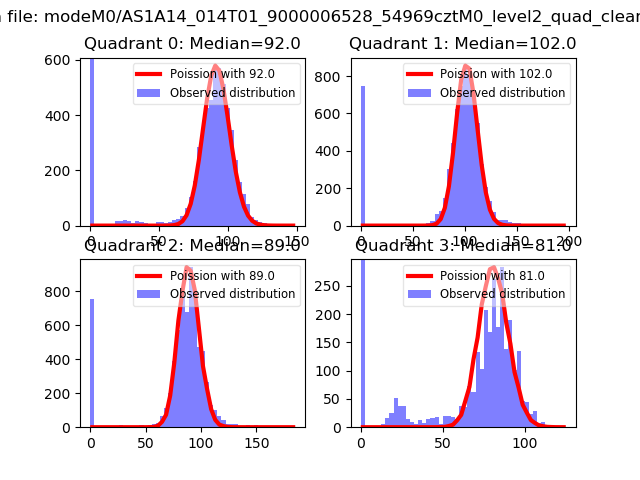 |
 |
| Quadrant-wise count rates Data is divided into 100 sec bins |
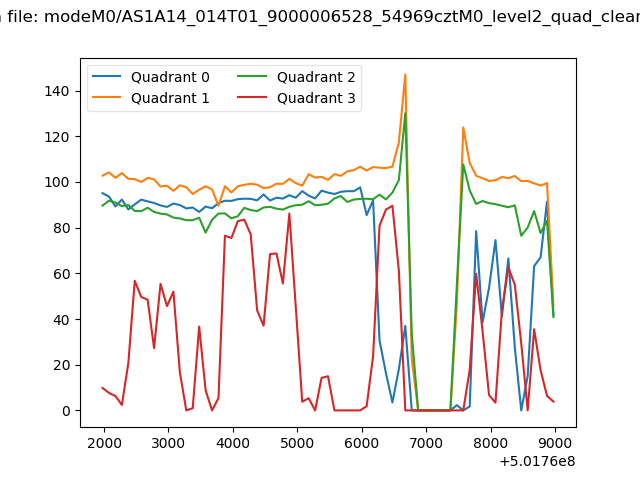 |
|
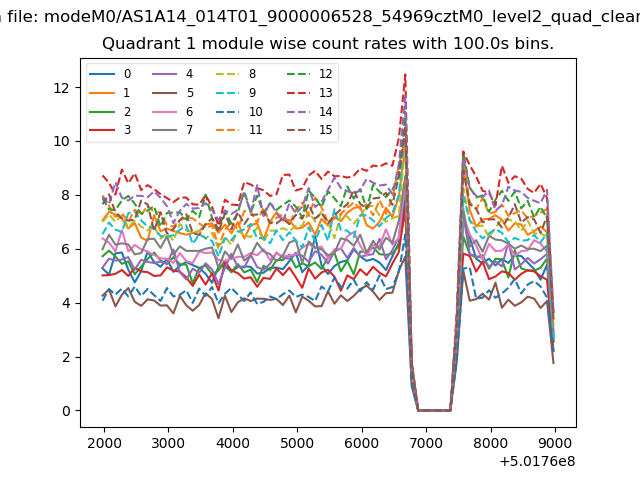
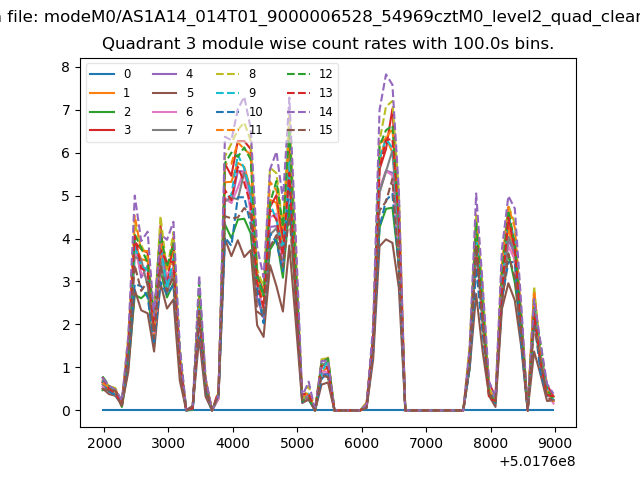
| Module-wise count rates for Quadrant A Data is divided into 100 sec bins |
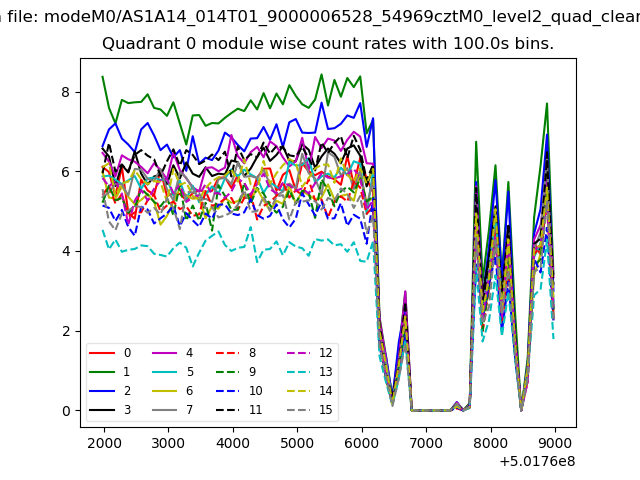 |
 |
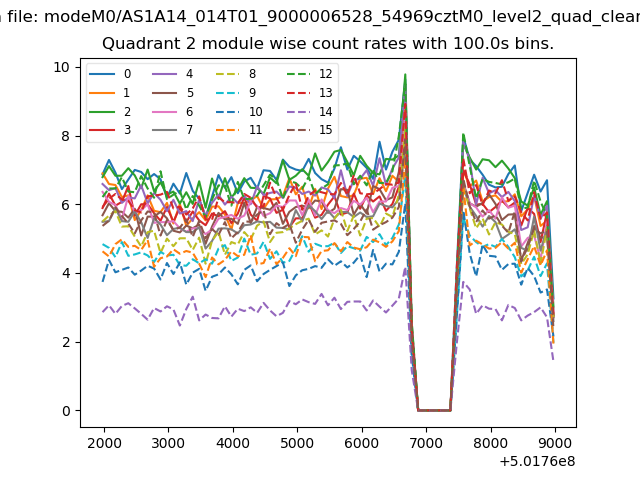
| Module-wise count rates for Quadrant B Data is divided into 100 sec bins |
 |
 |
| Module-wise count rates for Quadrant C Data is divided into 100 sec bins |
 |
 |
| Module-wise count rates for Quadrant D Data is divided into 100 sec bins |
 |
 |
| Parameter | Plot |
|---|---|
| CZT HV Monitor | 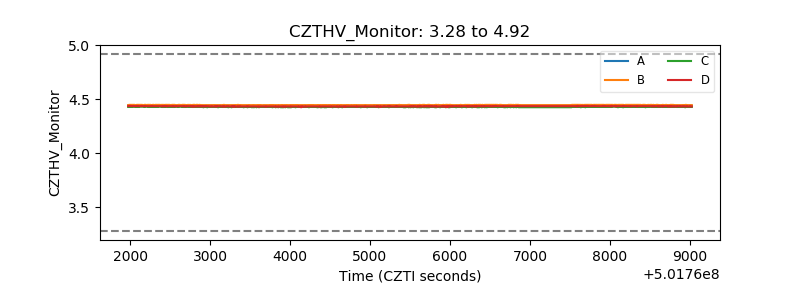 |
| D_VDD | 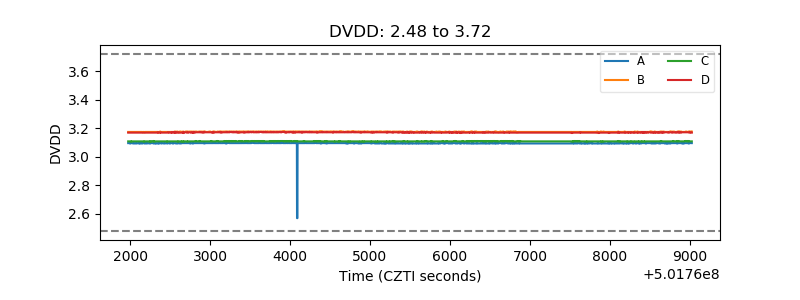 |
| Temperature 1 | 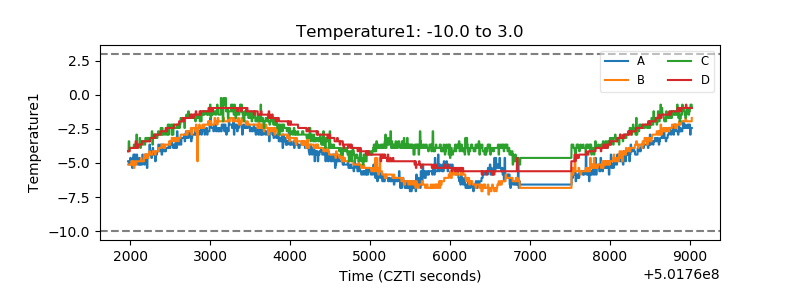 |
| Veto HV Monitor | 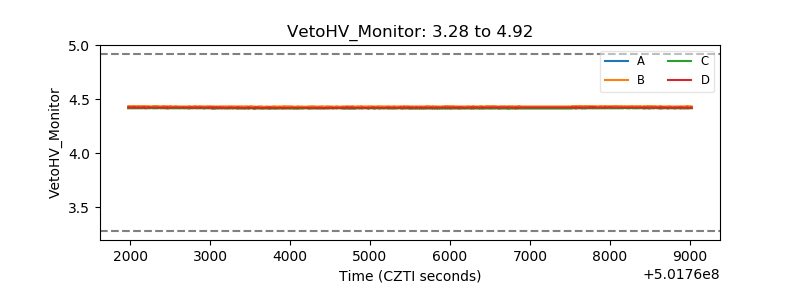 |
| Veto LLD | 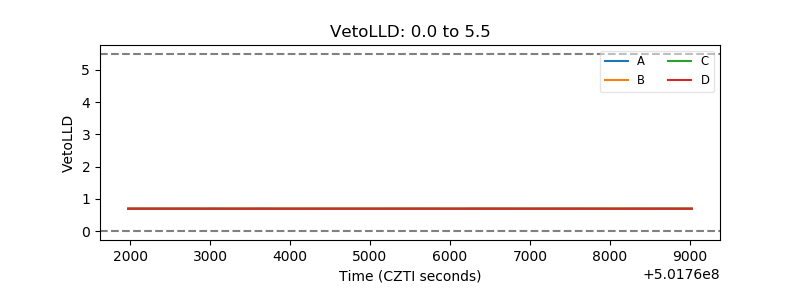 |
| Alpha Counter | 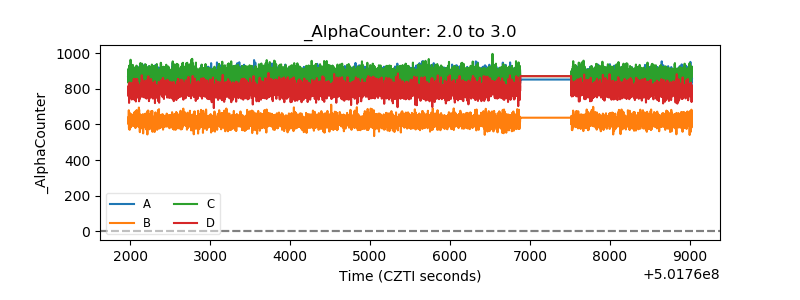 |
| _CPM_Rate | 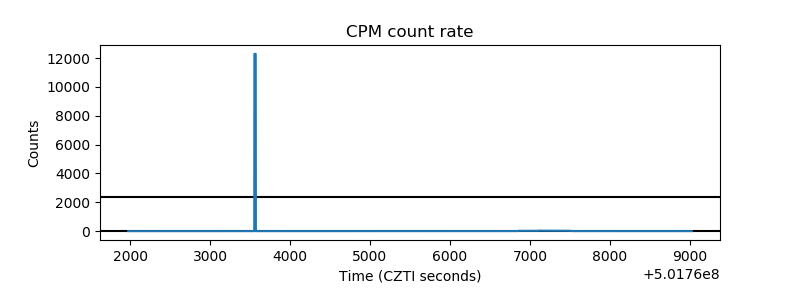 |
| CZT Counter | 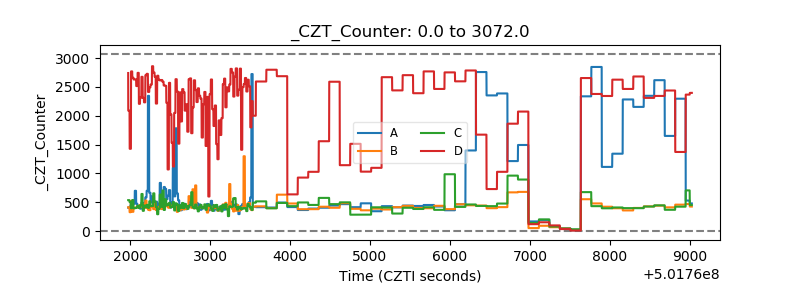 |
| +2.5 Volts monitor |  |
| +5 Volts monitor | 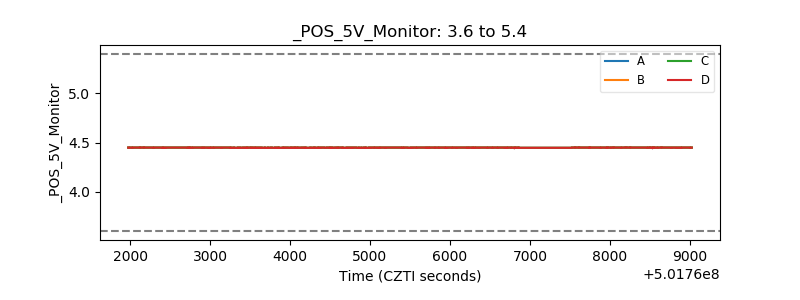 |
| _ROLL_ROT | 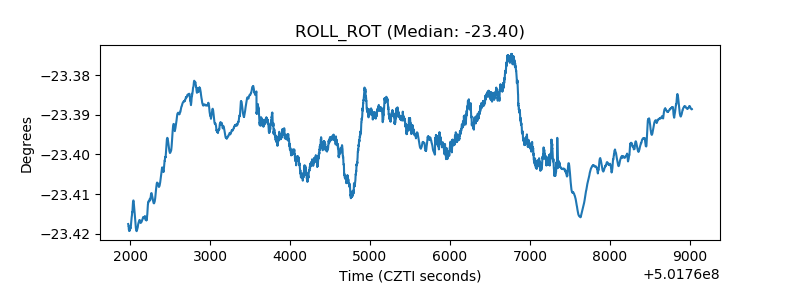 |
| _Roll_DEC |  |
| _Roll_RA | 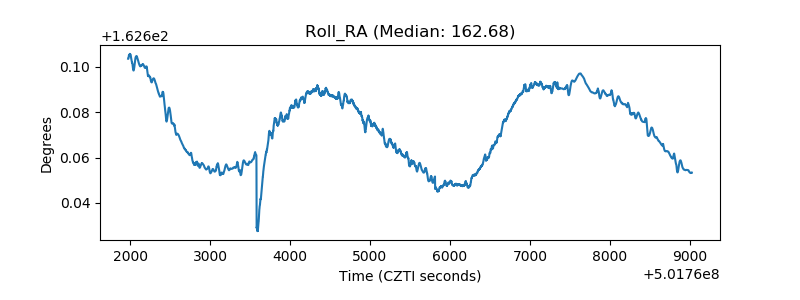 |
| Veto Counter | 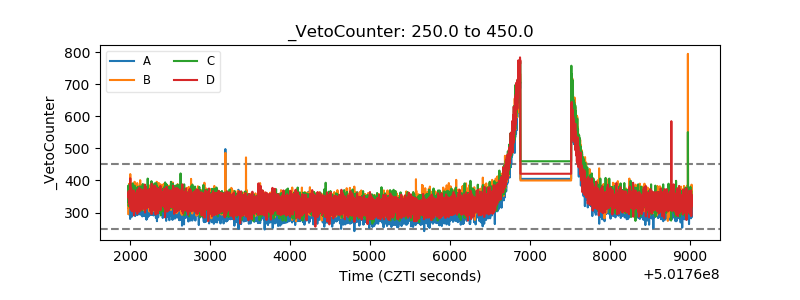 |