| Param | Original file | Final file |
|---|---|---|
| Filename | modeM0/AS1A14_014T01_9000006528_54970cztM0_level2.fits | modeM0/AS1A14_014T01_9000006528_54970cztM0_level2_quad_clean.evt |
| Size (bytes) | 834,721,920 | 93,499,200 |
| Size | 796.1 MB | 89.2 MB |
| Events in quadrant A | 5,691,774 | 648,587 |
| Events in quadrant B | 3,535,040 | 755,042 |
| Events in quadrant C | 5,273,601 | 627,654 |
| Events in quadrant D | 15,804,070 | 266,756 |
| Mode M0 | |||
|---|---|---|---|
| Quadrant | BADHDUFLAG | Total packets | Discarded packets |
| A | 0 | 22203 | 0 |
| B | 0 | 16169 | 0 |
| C | 0 | 21189 | 0 |
| D | 0 | 52245 | 0 |
| Mode SS | |||
|---|---|---|---|
| Quadrant | BADHDUFLAG | Total packets | Discarded packets |
| A | 0 | 154 | 0 |
| B | 0 | 154 | 0 |
| C | 0 | 154 | 0 |
| D | 0 | 154 | 0 |
| Quadrant | Total seconds | Saturated seconds | Saturation percentage |
|---|---|---|---|
| A | 7657 | 956 | 12.485308% |
| B | 7658 | 299 | 3.904414% |
| C | 7658 | 823 | 10.746931% |
| D | 7658 | 4802 | 62.705667% |
Noise dominated data is calculated using 1-second bins in cleaned event files. If a bin has >2000 counts, and if more than 50% of those come from <1% of pixels, then it is considered to be noise-dominated and hence unusable.
| Quadrant | # 1 sec bins | Bins with >0 counts | Bins with >2000 counts | High rate bins dominated by noise | Noise dominated (total time) | Noise dominated (detector-on time) | Marked lightcurve |
|---|---|---|---|---|---|---|---|
| A | 7657 | 7657 | 634 | 634 | 8.28% | 8.28% | 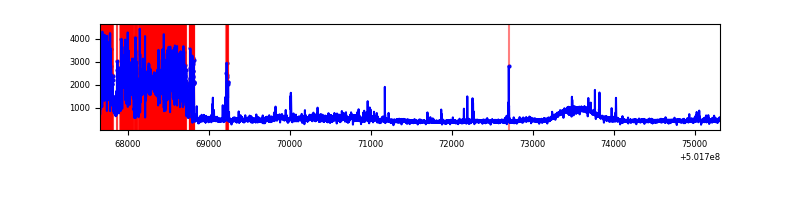 |
| B | 7658 | 7658 | 6 | 6 | 0.08% | 0.08% | 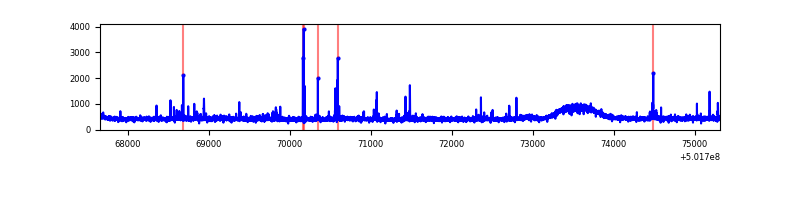 |
| C | 7658 | 7658 | 387 | 387 | 5.05% | 5.05% | 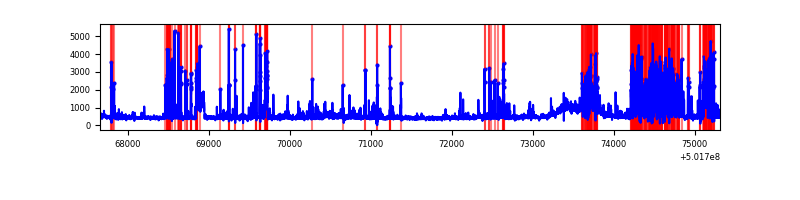 |
| D | 7658 | 7657 | 4414 | 4414 | 57.64% | 57.65% | 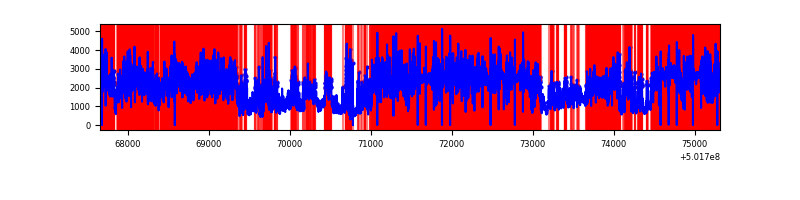 |
Top three noisy pixels from each quadrant. If the there are fewer than three noisy pixels in the level2.evt file, extra rows are filled as -1
| Pixel properties | Quadrant properties | ||||||
|---|---|---|---|---|---|---|---|
| Quadrant | DetID | PixID | Counts | Sigma | Mean | Median | Sigma |
| A | 15 | 32 | 1990686 | 9734.07 | 833 | 808 | 204.4 |
| A | 3 | 14 | 283287 | 1381.83 | 833 | 808 | 204.4 |
| A | 0 | 8 | 76274 | 369.16 | 833 | 808 | 204.4 |
| B | 5 | 185 | 42535 | 226.1 | 853 | 821 | 184.5 |
| B | 10 | 247 | 28758 | 151.42 | 853 | 821 | 184.5 |
| B | 2 | 249 | 26102 | 137.03 | 853 | 821 | 184.5 |
| C | 4 | 5 | 1280357 | 5777.72 | 815 | 807 | 221.5 |
| C | 12 | 252 | 471306 | 2124.5 | 815 | 807 | 221.5 |
| C | 1 | 16 | 91768 | 410.73 | 815 | 807 | 221.5 |
| D | 15 | 94 | 12397269 | 75122.1 | 584 | 558 | 165.0 |
| D | 2 | 249 | 327601 | 1981.83 | 584 | 558 | 165.0 |
| D | 3 | 12 | 248503 | 1502.51 | 584 | 558 | 165.0 |
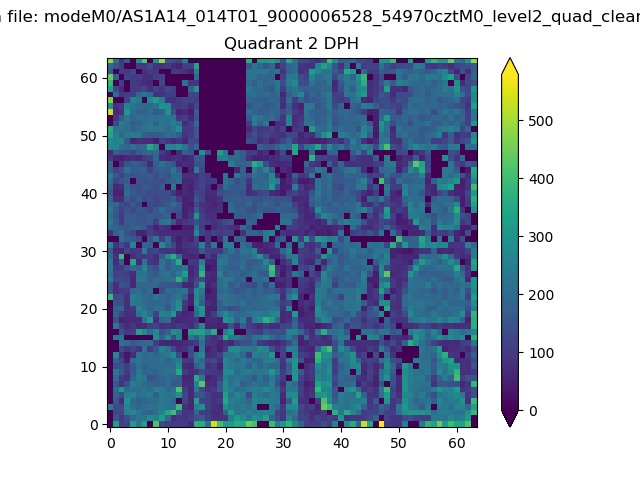
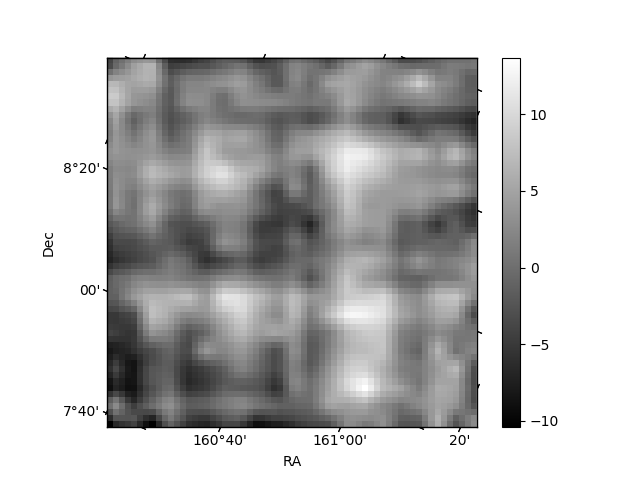
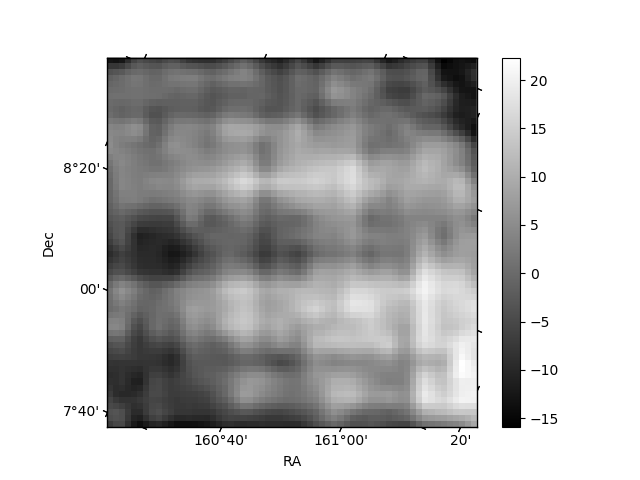
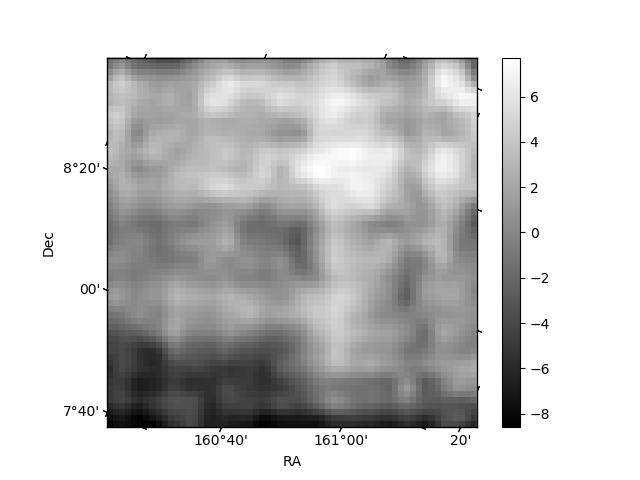
Histogram calculated using DETX and DETY for each event in the final _common_clean file
| Quadrant A |  |
 |
Quadrant B |
|---|---|---|---|
| Quadrant D | 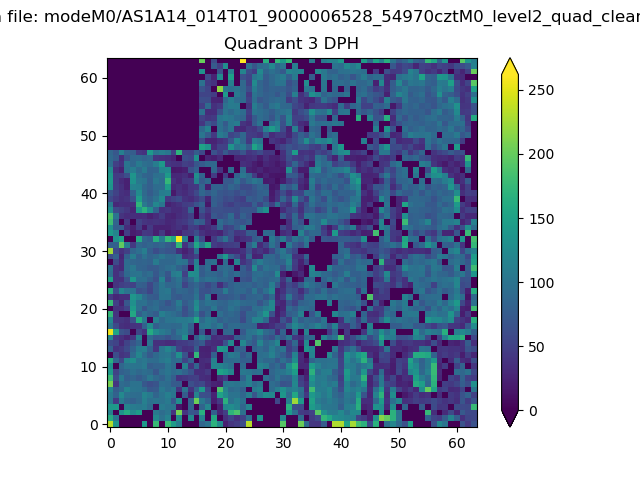 |
 |
Quadrant C |
| Plot type | Count rate plots | Images |
|---|---|---|
| Comparison with Poisson distribution Blue bars denote a histogram of data divided into 1 sec bins. Red curve is a Poisson curve with rate = median count rate of data. |
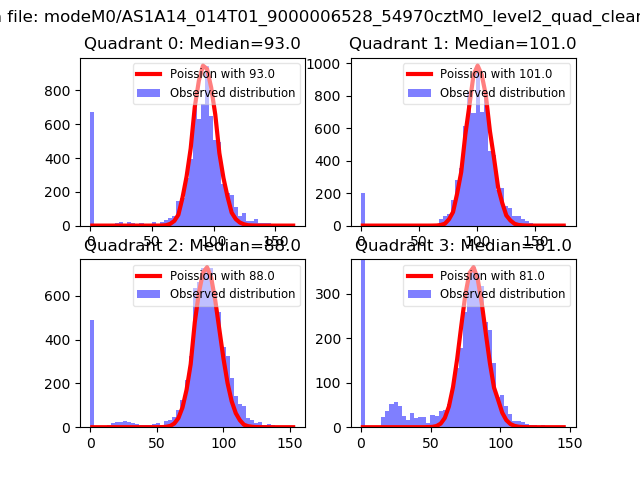 |
 |
| Quadrant-wise count rates Data is divided into 100 sec bins |
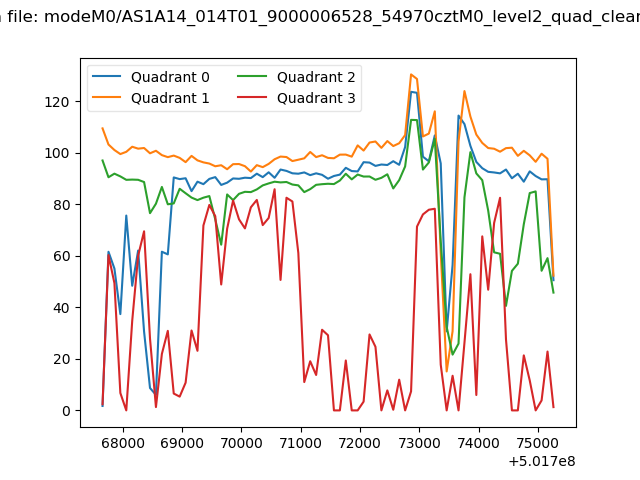 |
|
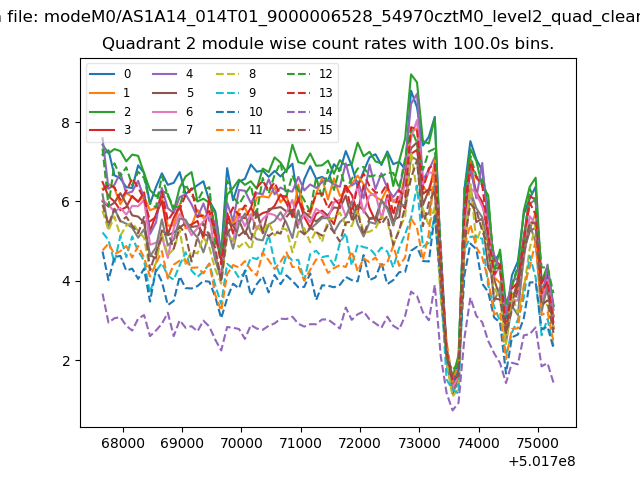
| Module-wise count rates for Quadrant A Data is divided into 100 sec bins |
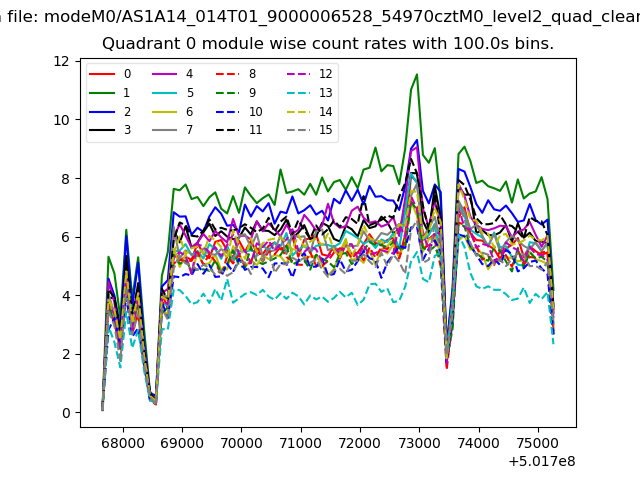 |
 |
| Module-wise count rates for Quadrant B Data is divided into 100 sec bins |
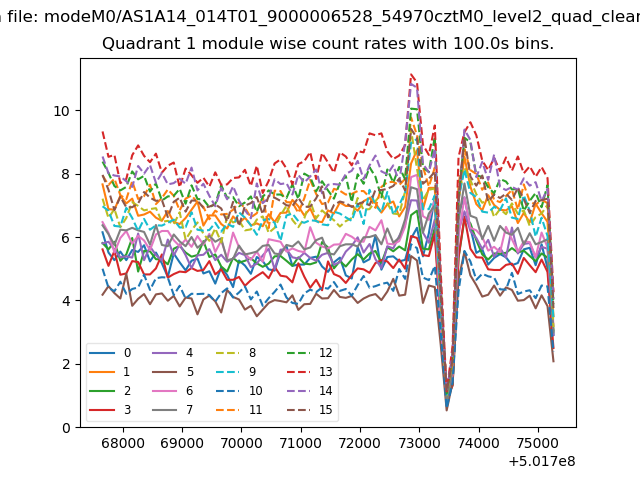 |
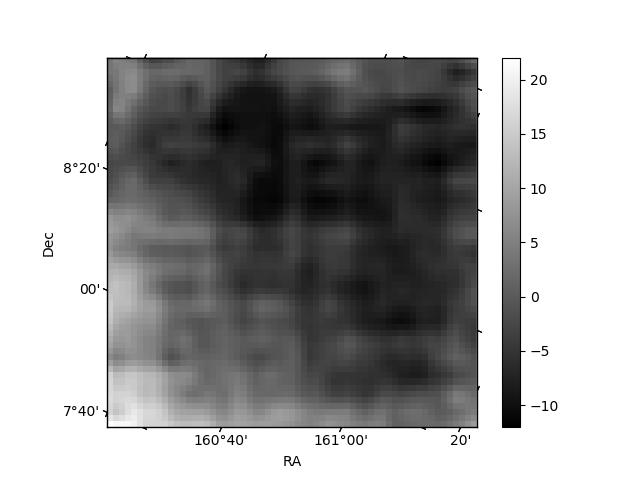 |
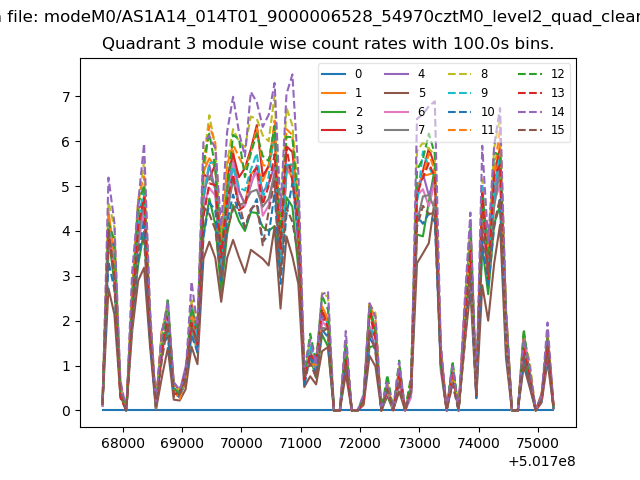
| Module-wise count rates for Quadrant C Data is divided into 100 sec bins |
 |
 |
| Module-wise count rates for Quadrant D Data is divided into 100 sec bins |
 |
 |
| Parameter | Plot |
|---|---|
| CZT HV Monitor | 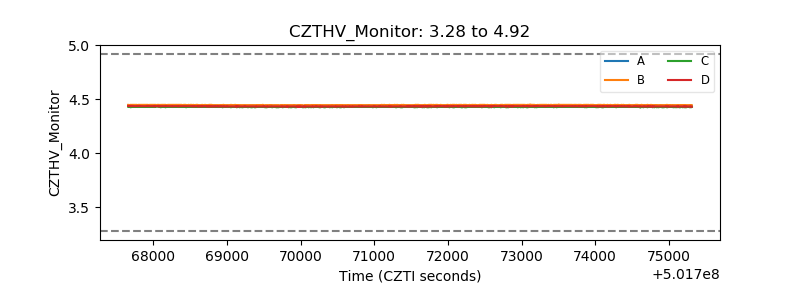 |
| D_VDD | 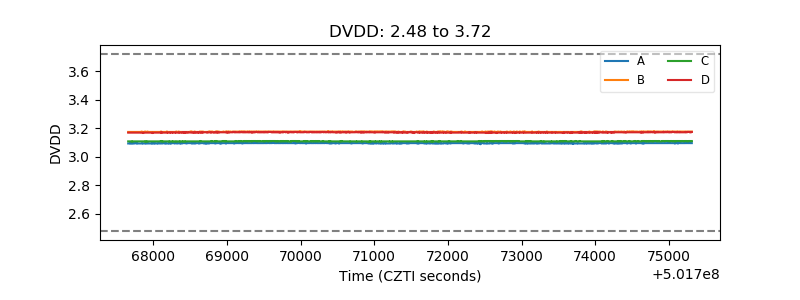 |
| Temperature 1 | 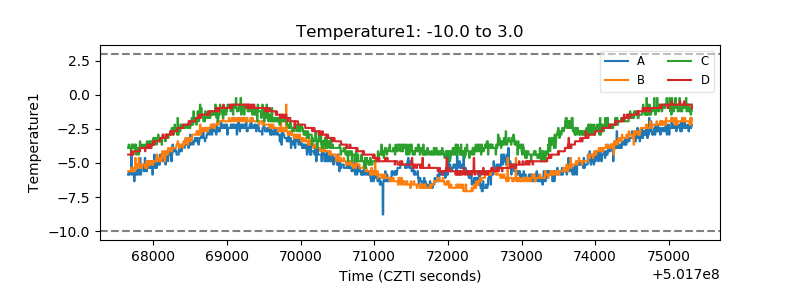 |
| Veto HV Monitor | 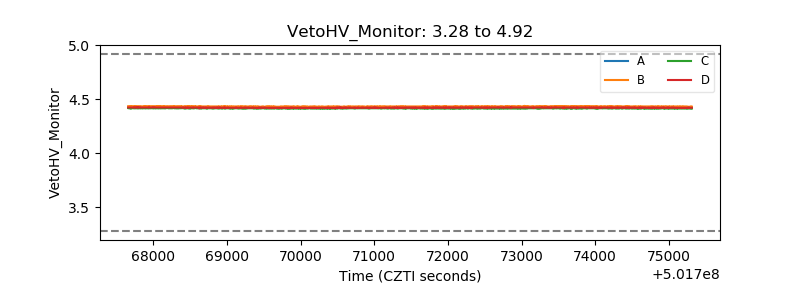 |
| Veto LLD | 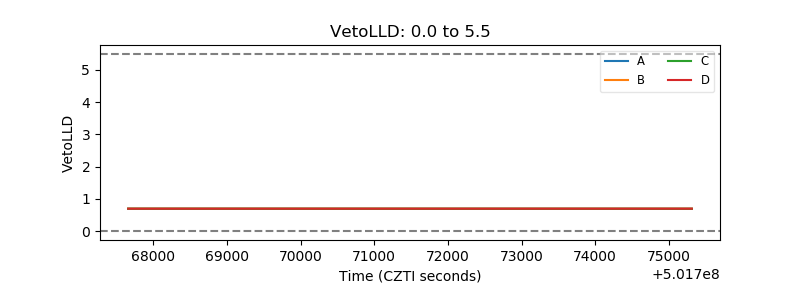 |
| Alpha Counter | 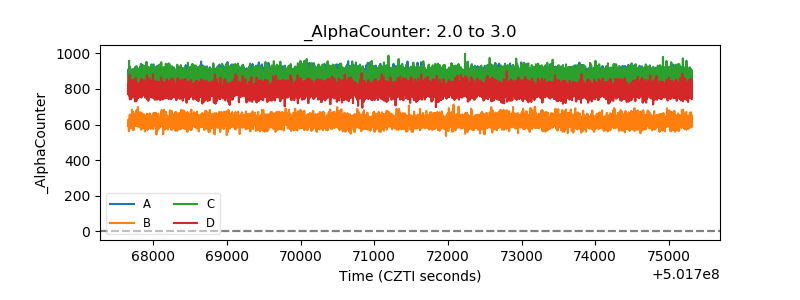 |
| _CPM_Rate | 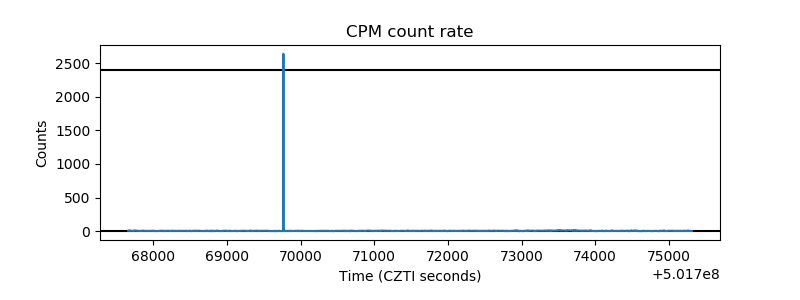 |
| CZT Counter | 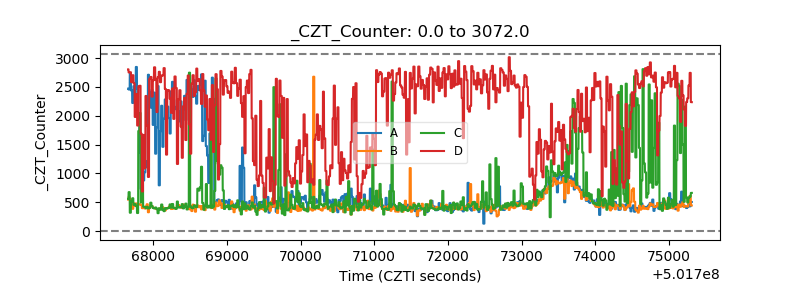 |
| +2.5 Volts monitor |  |
| +5 Volts monitor |  |
| _ROLL_ROT | 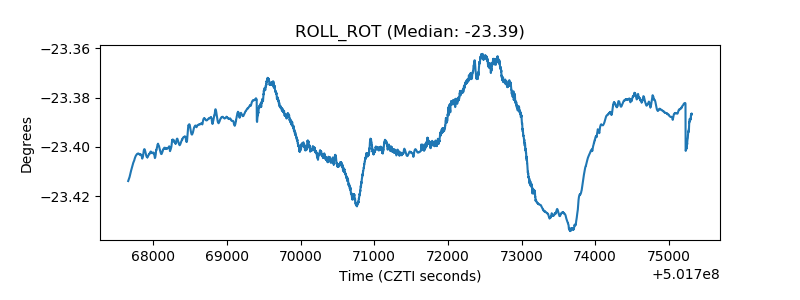 |
| _Roll_DEC | 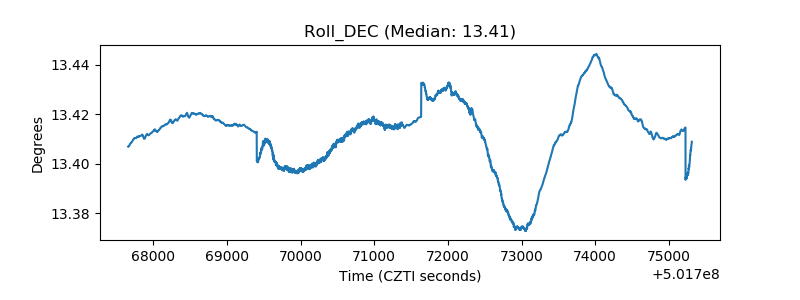 |
| _Roll_RA | 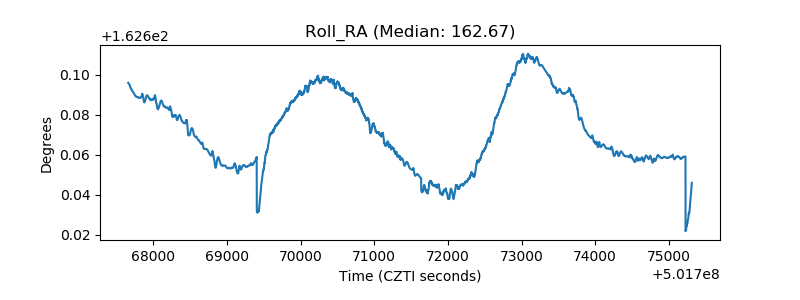 |
| Veto Counter | 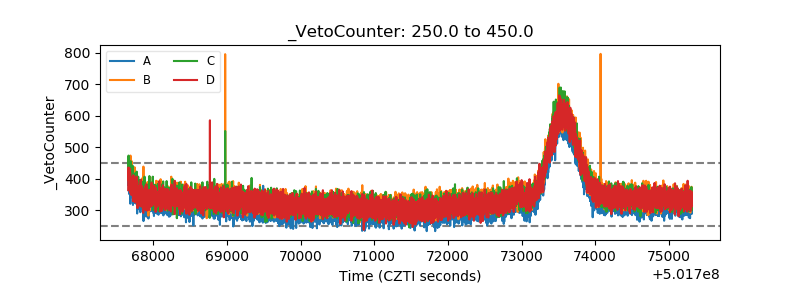 |