| Param | Original file | Final file |
|---|---|---|
| Filename | modeM0/AS1A14_014T01_9000006528_54971cztM0_level2.fits | modeM0/AS1A14_014T01_9000006528_54971cztM0_level2_quad_clean.evt |
| Size (bytes) | 886,723,200 | 91,434,240 |
| Size | 845.6 MB | 87.2 MB |
| Events in quadrant A | 3,545,784 | 720,308 |
| Events in quadrant B | 3,460,496 | 778,597 |
| Events in quadrant C | 7,219,073 | 590,828 |
| Events in quadrant D | 18,000,042 | 142,772 |
| Mode M0 | |||
|---|---|---|---|
| Quadrant | BADHDUFLAG | Total packets | Discarded packets |
| A | 0 | 16180 | 0 |
| B | 0 | 16064 | 0 |
| C | 0 | 26854 | 0 |
| D | 0 | 58795 | 1 |
| Mode SS | |||
|---|---|---|---|
| Quadrant | BADHDUFLAG | Total packets | Discarded packets |
| A | 0 | 154 | 0 |
| B | 0 | 154 | 0 |
| C | 0 | 154 | 0 |
| D | 0 | 154 | 0 |
| Quadrant | Total seconds | Saturated seconds | Saturation percentage |
|---|---|---|---|
| A | 7706 | 13 | 0.168700% |
| B | 7706 | 15 | 0.194654% |
| C | 7707 | 1295 | 16.802906% |
| D | 7706 | 6245 | 81.040747% |
Noise dominated data is calculated using 1-second bins in cleaned event files. If a bin has >2000 counts, and if more than 50% of those come from <1% of pixels, then it is considered to be noise-dominated and hence unusable.
| Quadrant | # 1 sec bins | Bins with >0 counts | Bins with >2000 counts | High rate bins dominated by noise | Noise dominated (total time) | Noise dominated (detector-on time) | Marked lightcurve |
|---|---|---|---|---|---|---|---|
| A | 7706 | 7706 | 11 | 11 | 0.14% | 0.14% | 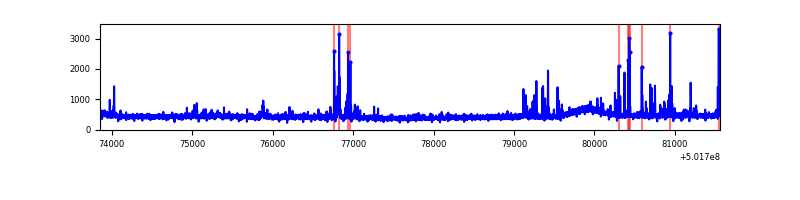 |
| B | 7706 | 7706 | 10 | 10 | 0.13% | 0.13% | 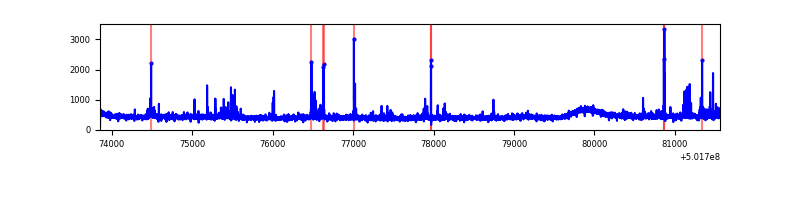 |
| C | 7706 | 7706 | 946 | 946 | 12.28% | 12.28% | 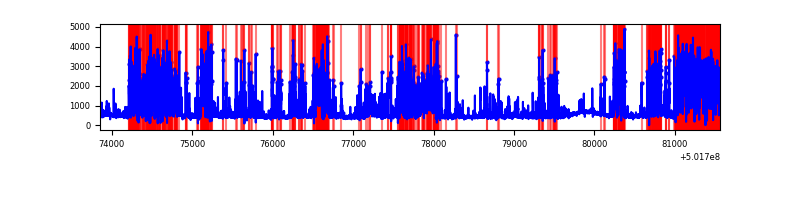 |
| D | 7706 | 7706 | 5850 | 5850 | 75.91% | 75.91% | 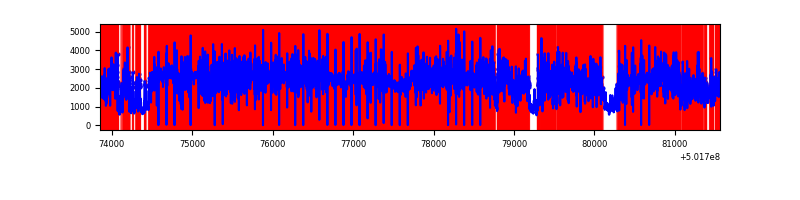 |
Top three noisy pixels from each quadrant. If the there are fewer than three noisy pixels in the level2.evt file, extra rows are filled as -1
| Pixel properties | Quadrant properties | ||||||
|---|---|---|---|---|---|---|---|
| Quadrant | DetID | PixID | Counts | Sigma | Mean | Median | Sigma |
| A | 4 | 249 | 104796 | 507.8 | 836 | 813 | 204.8 |
| A | 4 | 3 | 81349 | 393.3 | 836 | 813 | 204.8 |
| A | 13 | 248 | 48625 | 233.49 | 836 | 813 | 204.8 |
| B | 5 | 185 | 51591 | 283.9 | 825 | 794 | 178.9 |
| B | 0 | 245 | 38207 | 209.1 | 825 | 794 | 178.9 |
| B | 0 | 182 | 34307 | 187.3 | 825 | 794 | 178.9 |
| C | 4 | 5 | 3864737 | 18904.01 | 745 | 740 | 204.4 |
| C | 12 | 252 | 170732 | 831.66 | 745 | 740 | 204.4 |
| C | 14 | 254 | 84454 | 409.56 | 745 | 740 | 204.4 |
| D | 15 | 94 | 14577707 | 121176.86 | 413 | 393 | 120.3 |
| D | 2 | 249 | 965565 | 8023.19 | 413 | 393 | 120.3 |
| D | 14 | 52 | 354831 | 2946.34 | 413 | 393 | 120.3 |
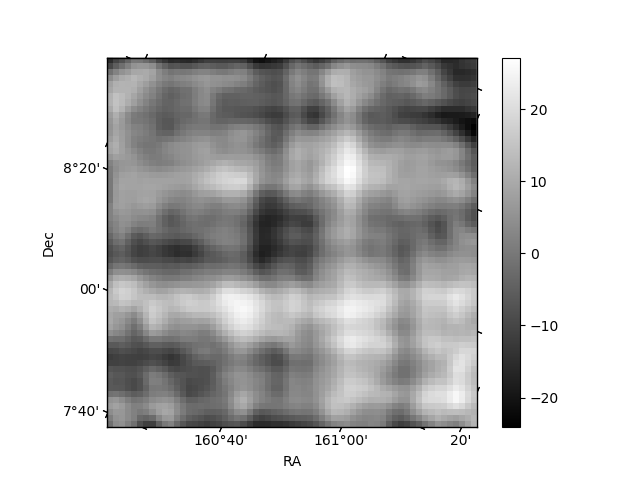
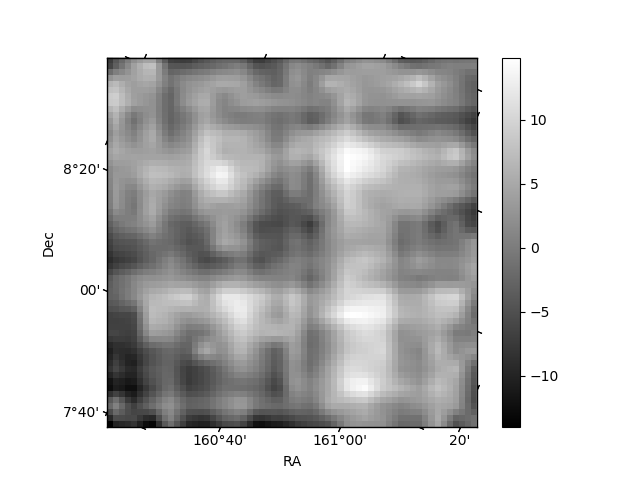
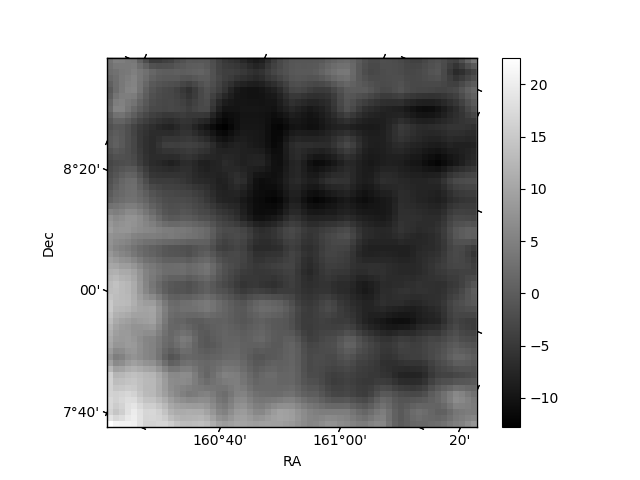
Histogram calculated using DETX and DETY for each event in the final _common_clean file
| Quadrant A | 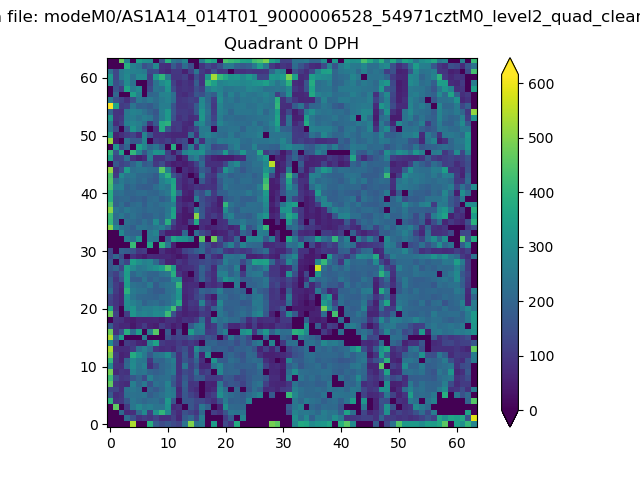 |
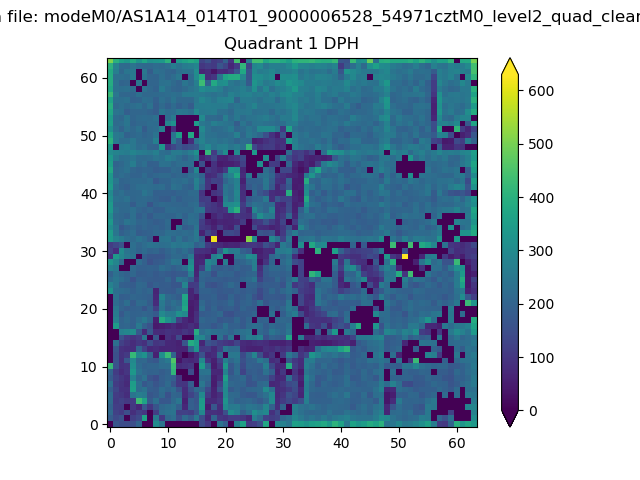 |
Quadrant B |
|---|---|---|---|
| Quadrant D | 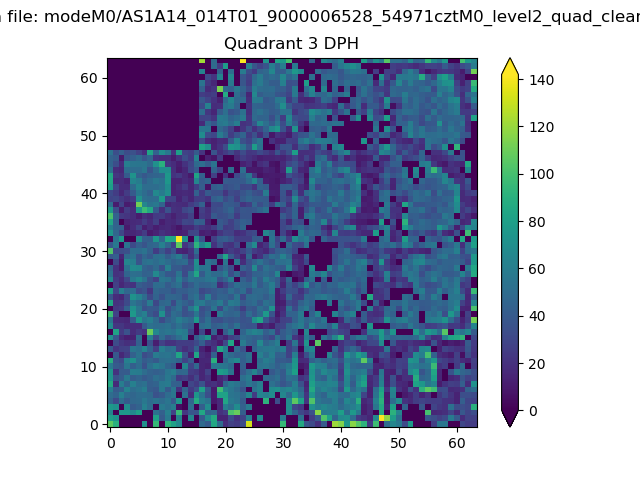 |
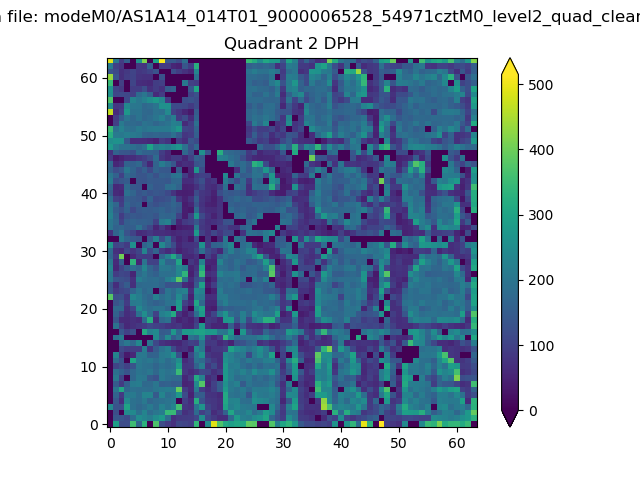 |
Quadrant C |
| Plot type | Count rate plots | Images |
|---|---|---|
| Comparison with Poisson distribution Blue bars denote a histogram of data divided into 1 sec bins. Red curve is a Poisson curve with rate = median count rate of data. |
 |
 |
| Quadrant-wise count rates Data is divided into 100 sec bins |
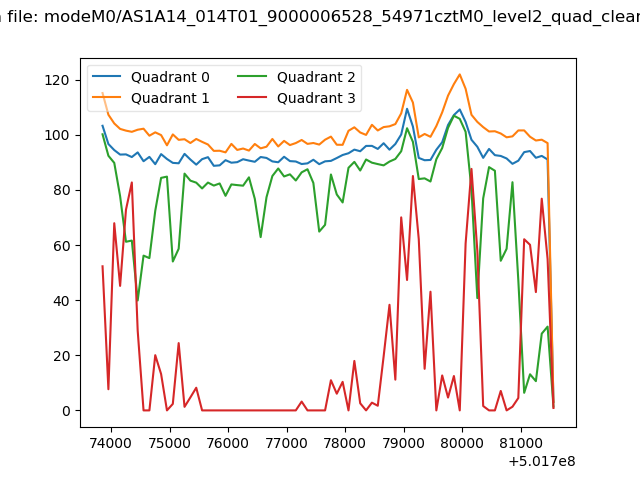 |
|
| Module-wise count rates for Quadrant A Data is divided into 100 sec bins |
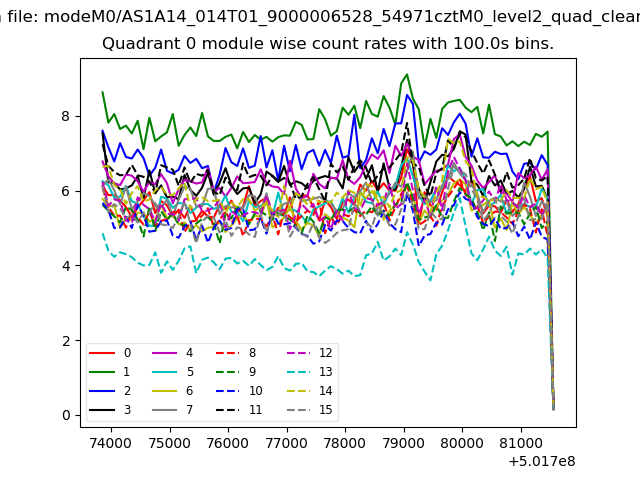 |
 |
| Module-wise count rates for Quadrant B Data is divided into 100 sec bins |
 |
 |
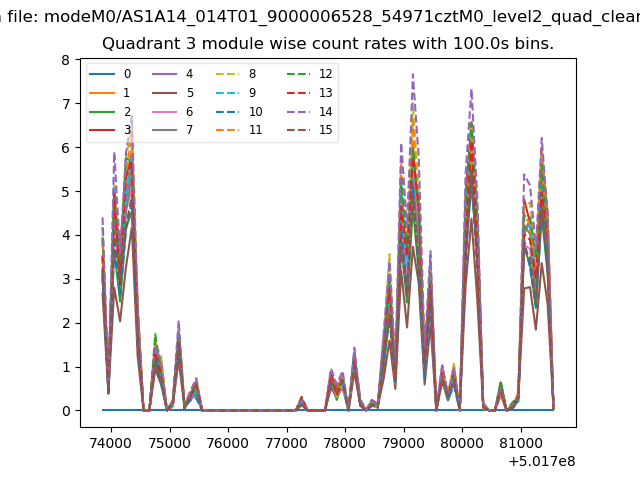
| Module-wise count rates for Quadrant C Data is divided into 100 sec bins |
 |
 |
| Module-wise count rates for Quadrant D Data is divided into 100 sec bins |
 |
 |
| Parameter | Plot |
|---|---|
| CZT HV Monitor |  |
| D_VDD | 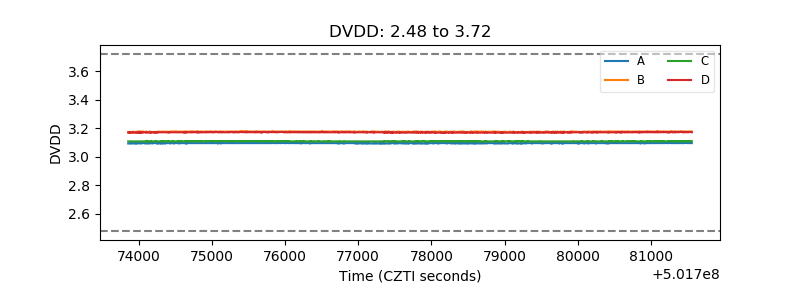 |
| Temperature 1 | 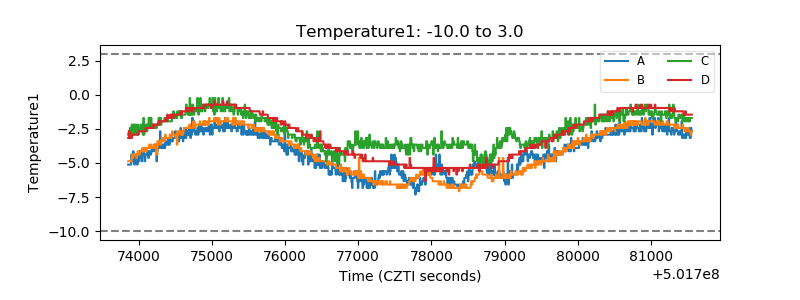 |
| Veto HV Monitor | 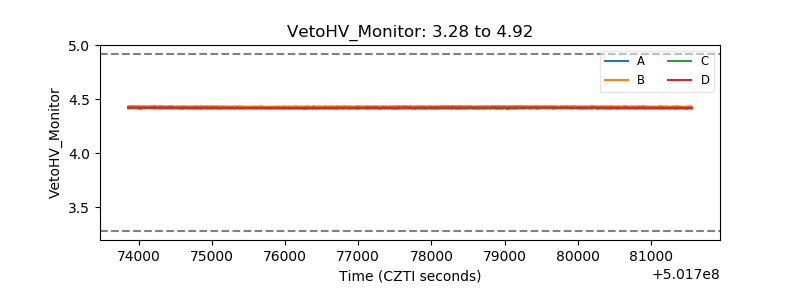 |
| Veto LLD | 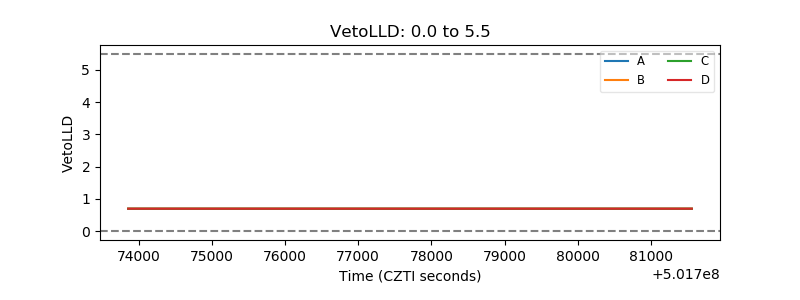 |
| Alpha Counter | 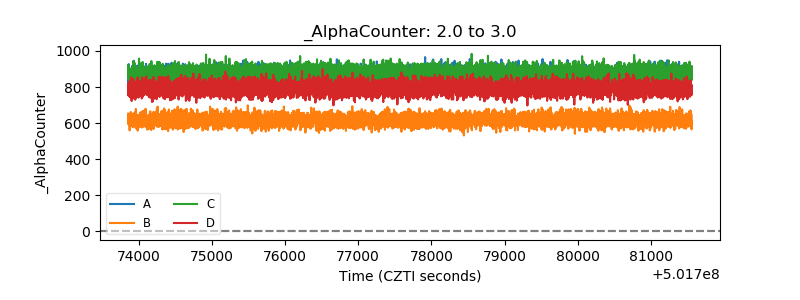 |
| _CPM_Rate | 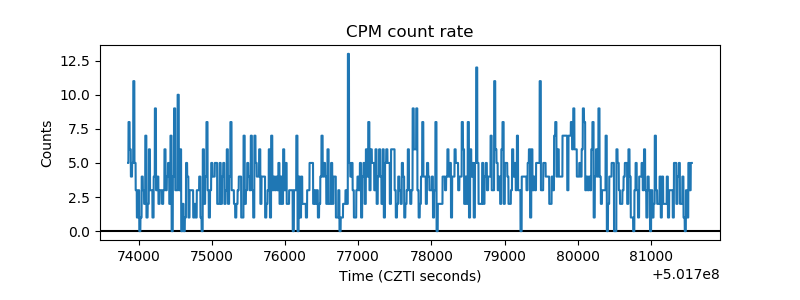 |
| CZT Counter | 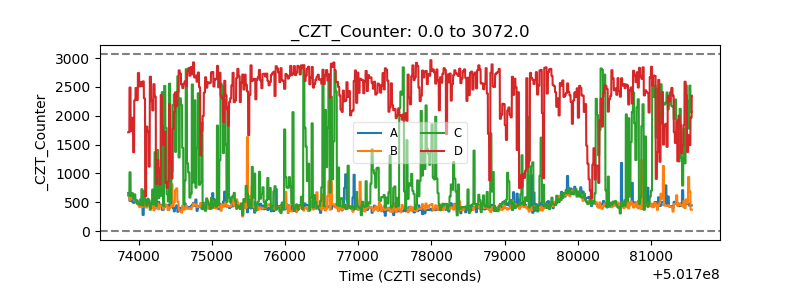 |
| +2.5 Volts monitor | 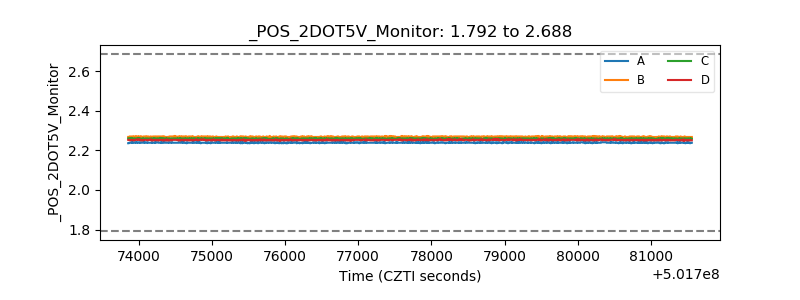 |
| +5 Volts monitor |  |
| _ROLL_ROT | 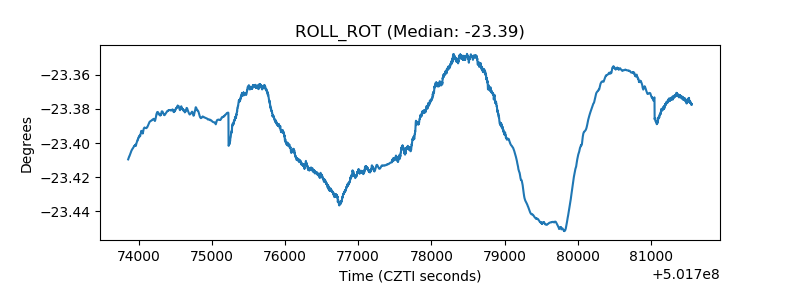 |
| _Roll_DEC | 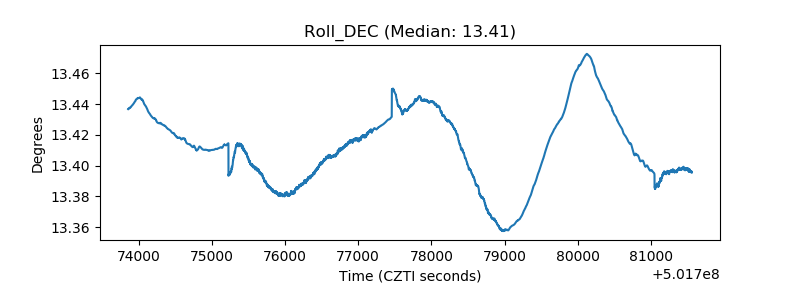 |
| _Roll_RA | 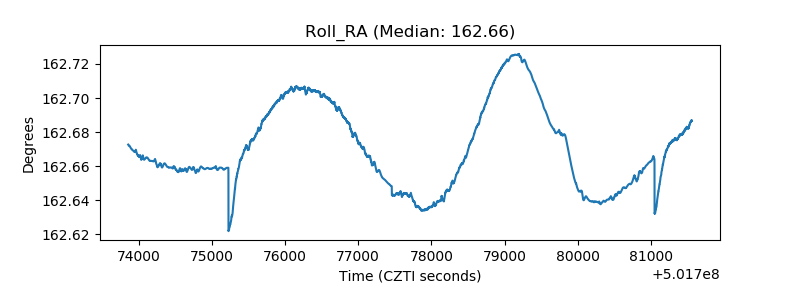 |
| Veto Counter | 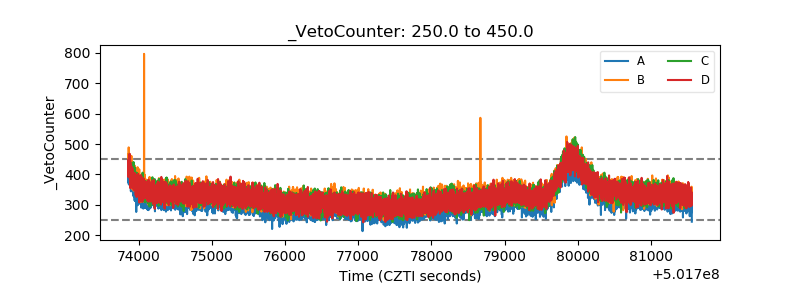 |