| Param | Original file | Final file |
|---|---|---|
| Filename | modeM0/AS1A14_014T01_9000006528_54972cztM0_level2.fits | modeM0/AS1A14_014T01_9000006528_54972cztM0_level2_quad_clean.evt |
| Size (bytes) | 1,024,156,800 | 92,312,640 |
| Size | 976.7 MB | 88.0 MB |
| Events in quadrant A | 5,276,381 | 716,687 |
| Events in quadrant B | 3,698,316 | 818,883 |
| Events in quadrant C | 8,132,786 | 598,832 |
| Events in quadrant D | 20,176,449 | 97,937 |
| Mode M0 | |||
|---|---|---|---|
| Quadrant | BADHDUFLAG | Total packets | Discarded packets |
| A | 0 | 21441 | 1 |
| B | 0 | 17059 | 0 |
| C | 0 | 29914 | 0 |
| D | 0 | 65404 | 0 |
| Mode SS | |||
|---|---|---|---|
| Quadrant | BADHDUFLAG | Total packets | Discarded packets |
| A | 0 | 162 | 0 |
| B | 0 | 162 | 0 |
| C | 0 | 162 | 0 |
| D | 0 | 162 | 0 |
| Quadrant | Total seconds | Saturated seconds | Saturation percentage |
|---|---|---|---|
| A | 8089 | 529 | 6.539745% |
| B | 8090 | 20 | 0.247219% |
| C | 8090 | 1661 | 20.531520% |
| D | 8090 | 7119 | 87.997528% |
Noise dominated data is calculated using 1-second bins in cleaned event files. If a bin has >2000 counts, and if more than 50% of those come from <1% of pixels, then it is considered to be noise-dominated and hence unusable.
| Quadrant | # 1 sec bins | Bins with >0 counts | Bins with >2000 counts | High rate bins dominated by noise | Noise dominated (total time) | Noise dominated (detector-on time) | Marked lightcurve |
|---|---|---|---|---|---|---|---|
| A | 8089 | 8089 | 458 | 458 | 5.66% | 5.66% |  |
| B | 8090 | 8090 | 5 | 5 | 0.06% | 0.06% |  |
| C | 8090 | 8090 | 1178 | 1178 | 14.56% | 14.56% |  |
| D | 8090 | 8090 | 6893 | 6893 | 85.20% | 85.20% |  |
Top three noisy pixels from each quadrant. If the there are fewer than three noisy pixels in the level2.evt file, extra rows are filled as -1
| Pixel properties | Quadrant properties | ||||||
|---|---|---|---|---|---|---|---|
| Quadrant | DetID | PixID | Counts | Sigma | Mean | Median | Sigma |
| A | 15 | 32 | 1332500 | 6176.62 | 870 | 845 | 215.6 |
| A | 4 | 249 | 164378 | 758.52 | 870 | 845 | 215.6 |
| A | 13 | 248 | 143329 | 660.88 | 870 | 845 | 215.6 |
| B | 0 | 182 | 74855 | 384.89 | 881 | 849 | 192.3 |
| B | 5 | 185 | 51288 | 262.32 | 881 | 849 | 192.3 |
| B | 12 | 111 | 23595 | 118.3 | 881 | 849 | 192.3 |
| C | 4 | 5 | 4403041 | 20675.15 | 778 | 772 | 212.9 |
| C | 13 | 3 | 352422 | 1651.52 | 778 | 772 | 212.9 |
| C | 12 | 252 | 93444 | 435.23 | 778 | 772 | 212.9 |
| D | 15 | 94 | 16730749 | 139229.8 | 415 | 396 | 120.2 |
| D | 2 | 249 | 897729 | 7467.59 | 415 | 396 | 120.2 |
| D | 3 | 12 | 243075 | 2019.57 | 415 | 396 | 120.2 |
Histogram calculated using DETX and DETY for each event in the final _common_clean file
| Quadrant A |  |
 |
Quadrant B |
|---|---|---|---|
| Quadrant D |  |
 |
Quadrant C |
| Plot type | Count rate plots | Images |
|---|---|---|
| Comparison with Poisson distribution Blue bars denote a histogram of data divided into 1 sec bins. Red curve is a Poisson curve with rate = median count rate of data. |
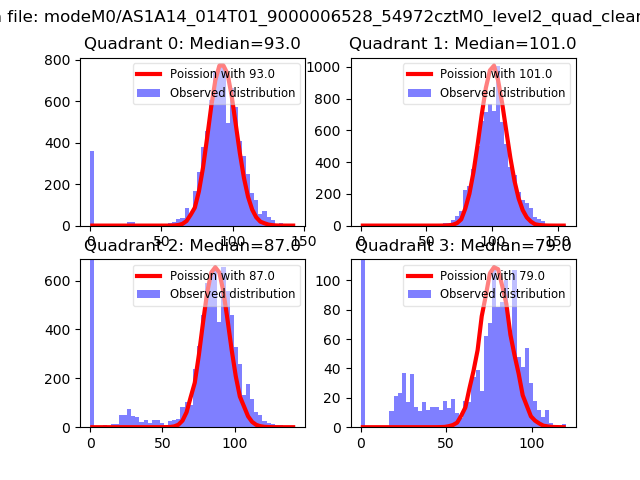 |
 |
| Quadrant-wise count rates Data is divided into 100 sec bins |
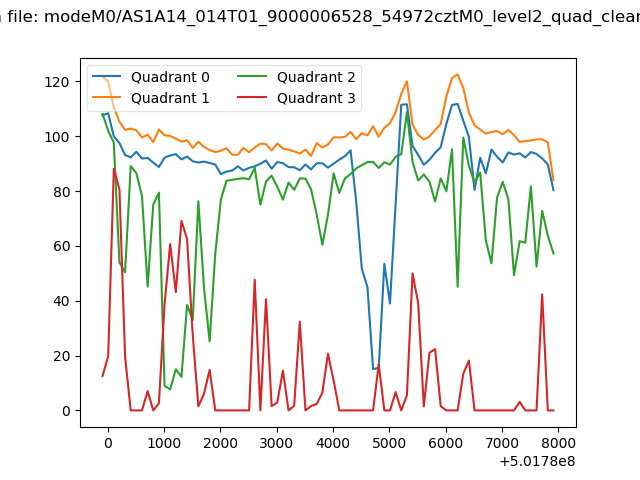 |
|
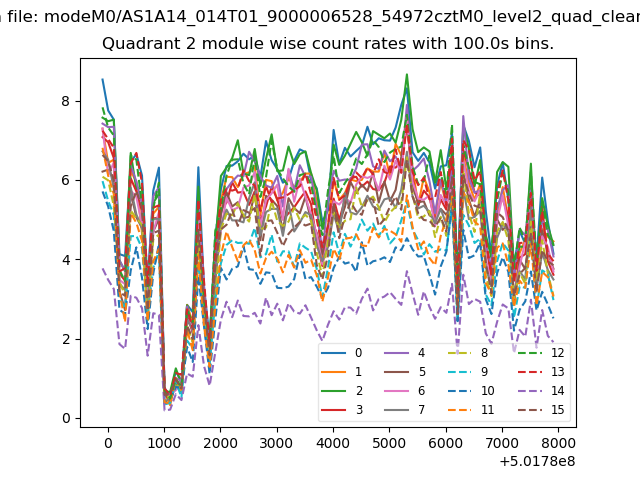
| Module-wise count rates for Quadrant A Data is divided into 100 sec bins |
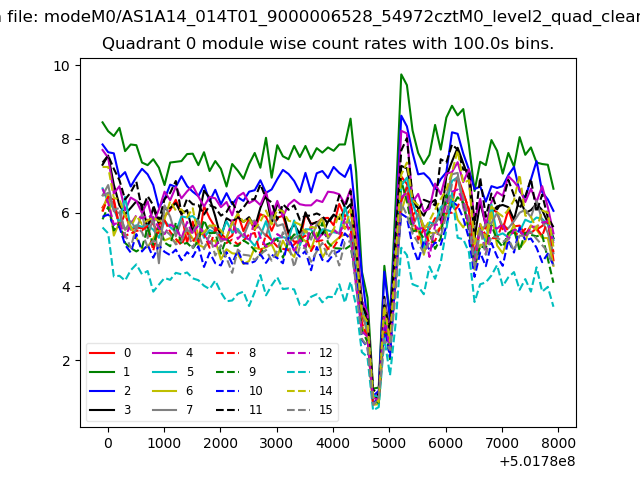 |
 |
| Module-wise count rates for Quadrant B Data is divided into 100 sec bins |
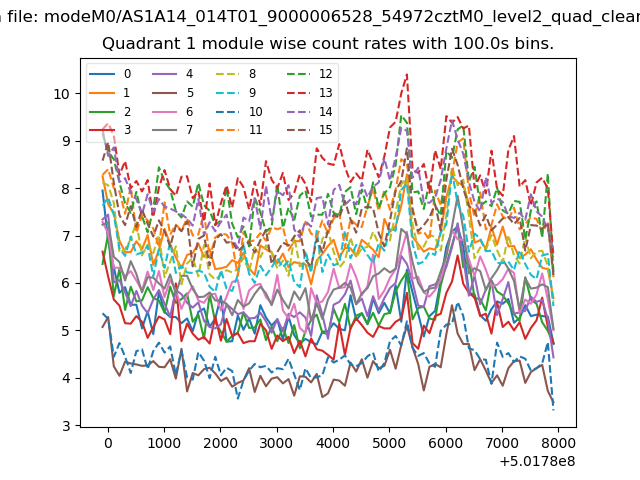 |
 |
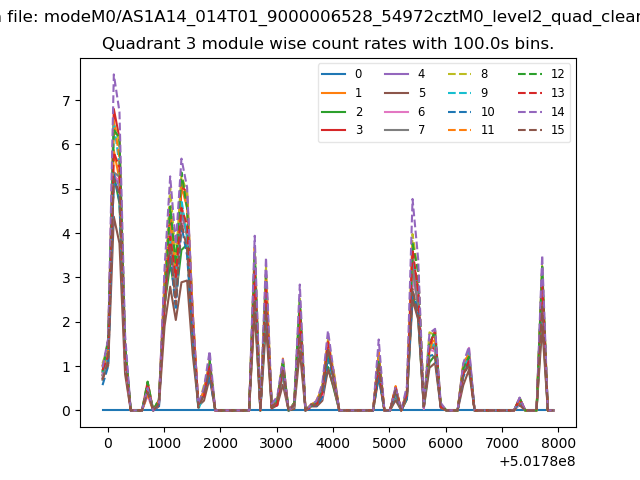
| Module-wise count rates for Quadrant C Data is divided into 100 sec bins |
 |
 |
| Module-wise count rates for Quadrant D Data is divided into 100 sec bins |
 |
 |
| Parameter | Plot |
|---|---|
| CZT HV Monitor | 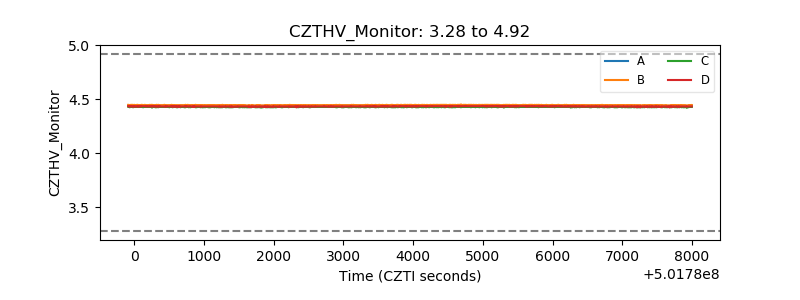 |
| D_VDD |  |
| Temperature 1 |  |
| Veto HV Monitor |  |
| Veto LLD |  |
| Alpha Counter | 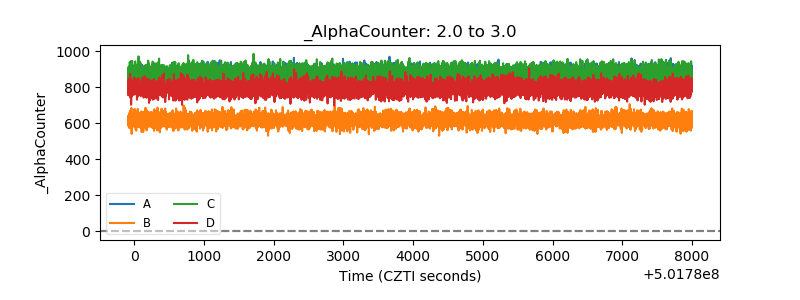 |
| _CPM_Rate | 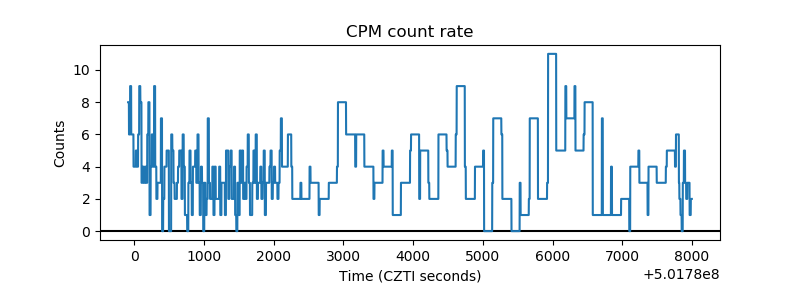 |
| CZT Counter |  |
| +2.5 Volts monitor |  |
| +5 Volts monitor |  |
| _ROLL_ROT | 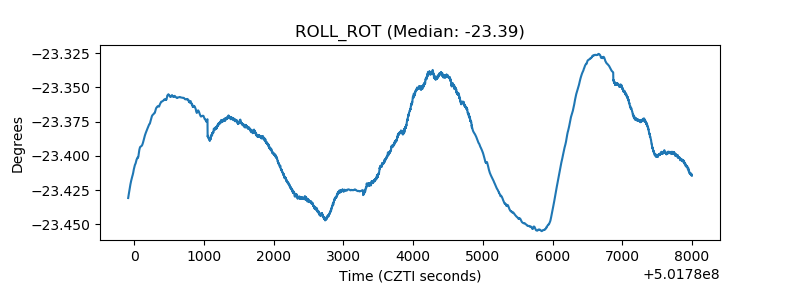 |
| _Roll_DEC |  |
| _Roll_RA |  |
| Veto Counter | 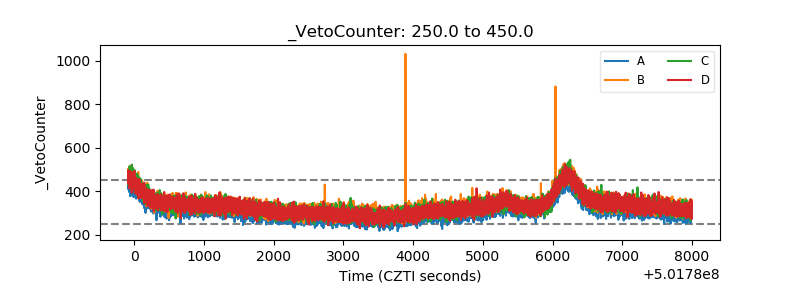 |