| Param | Original file | Final file |
|---|---|---|
| Filename | modeM0/AS1A14_014T01_9000006528_54976cztM0_level2.fits | modeM0/AS1A14_014T01_9000006528_54976cztM0_level2_quad_clean.evt |
| Size (bytes) | 1,244,056,320 | 107,472,960 |
| Size | 1.2 GB | 102.5 MB |
| Events in quadrant A | 8,232,828 | 744,388 |
| Events in quadrant B | 4,709,258 | 963,180 |
| Events in quadrant C | 6,226,125 | 831,527 |
| Events in quadrant D | 26,113,965 | 27,417 |
| Mode M0 | |||
|---|---|---|---|
| Quadrant | BADHDUFLAG | Total packets | Discarded packets |
| A | 0 | 31909 | 1 |
| B | 0 | 21753 | 1 |
| C | 0 | 25936 | 1 |
| D | 0 | 84177 | 1 |
| Mode SS | |||
|---|---|---|---|
| Quadrant | BADHDUFLAG | Total packets | Discarded packets |
| A | 0 | 200 | 0 |
| B | 0 | 200 | 0 |
| C | 0 | 200 | 0 |
| D | 0 | 200 | 0 |
| Mode M9 | |||
|---|---|---|---|
| Quadrant | BADHDUFLAG | Total packets | Discarded packets |
| A | 0 | 1 | 0 |
| B | 0 | 1 | 0 |
| C | 0 | 1 | 0 |
| D | 0 | 1 | 0 |
| Quadrant | Total seconds | Saturated seconds | Saturation percentage |
|---|---|---|---|
| A | 9918 | 1708 | 17.221214% |
| B | 9918 | 247 | 2.490421% |
| C | 9919 | 621 | 6.260712% |
| D | 9919 | 9653 | 97.318278% |
Noise dominated data is calculated using 1-second bins in cleaned event files. If a bin has >2000 counts, and if more than 50% of those come from <1% of pixels, then it is considered to be noise-dominated and hence unusable.
| Quadrant | # 1 sec bins | Bins with >0 counts | Bins with >2000 counts | High rate bins dominated by noise | Noise dominated (total time) | Noise dominated (detector-on time) | Marked lightcurve |
|---|---|---|---|---|---|---|---|
| A | 9988 | 9919 | 1391 | 1391 | 13.93% | 14.02% | 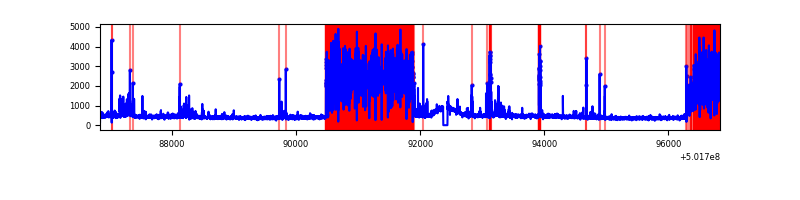 |
| B | 9988 | 9919 | 25 | 25 | 0.25% | 0.25% | 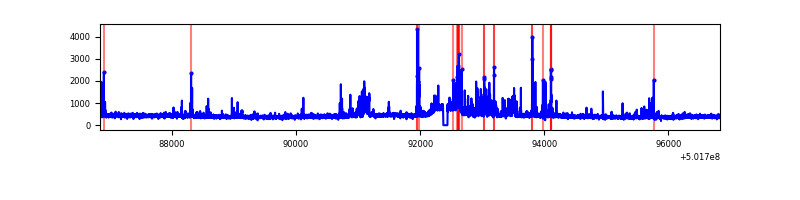 |
| C | 9989 | 9920 | 435 | 435 | 4.35% | 4.39% | 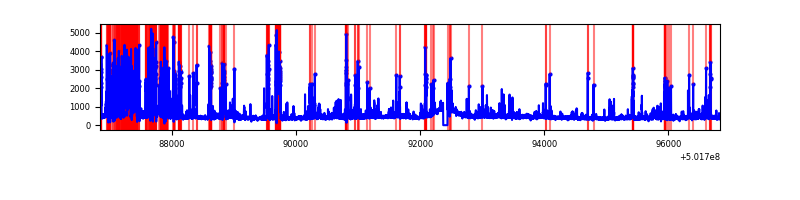 |
| D | 9988 | 9918 | 9210 | 9210 | 92.21% | 92.86% | 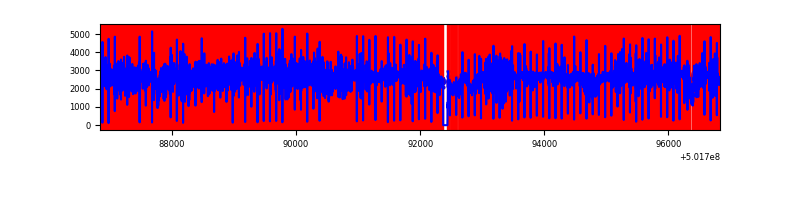 |
Top three noisy pixels from each quadrant. If the there are fewer than three noisy pixels in the level2.evt file, extra rows are filled as -1
| Pixel properties | Quadrant properties | ||||||
|---|---|---|---|---|---|---|---|
| Quadrant | DetID | PixID | Counts | Sigma | Mean | Median | Sigma |
| A | 15 | 32 | 4015701 | 17054.12 | 945 | 921 | 235.4 |
| A | 4 | 249 | 143763 | 606.77 | 945 | 921 | 235.4 |
| A | 13 | 248 | 141894 | 598.83 | 945 | 921 | 235.4 |
| B | 4 | 81 | 191142 | 862.63 | 1030 | 995 | 220.4 |
| B | 0 | 182 | 177408 | 800.33 | 1030 | 995 | 220.4 |
| B | 10 | 247 | 88718 | 397.97 | 1030 | 995 | 220.4 |
| C | 4 | 5 | 1628410 | 5982.85 | 995 | 988 | 272.0 |
| C | 13 | 3 | 207497 | 759.18 | 995 | 988 | 272.0 |
| C | 6 | 223 | 157845 | 576.65 | 995 | 988 | 272.0 |
| D | 15 | 94 | 22551857 | 230473.13 | 333 | 318 | 97.8 |
| D | 2 | 249 | 788966 | 8059.86 | 333 | 318 | 97.8 |
| D | 2 | 172 | 438949 | 4482.74 | 333 | 318 | 97.8 |
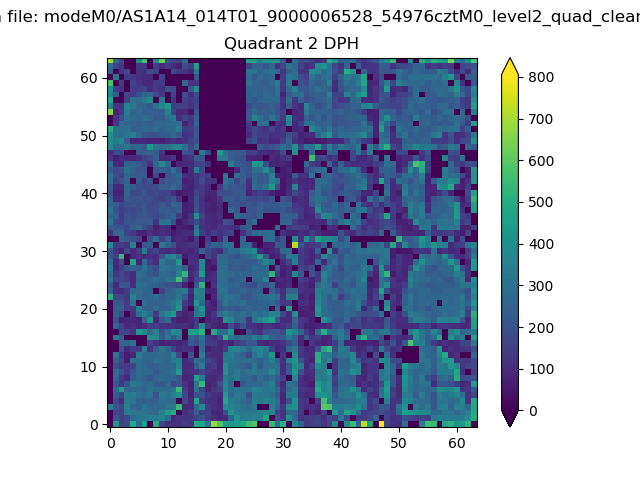
Histogram calculated using DETX and DETY for each event in the final _common_clean file
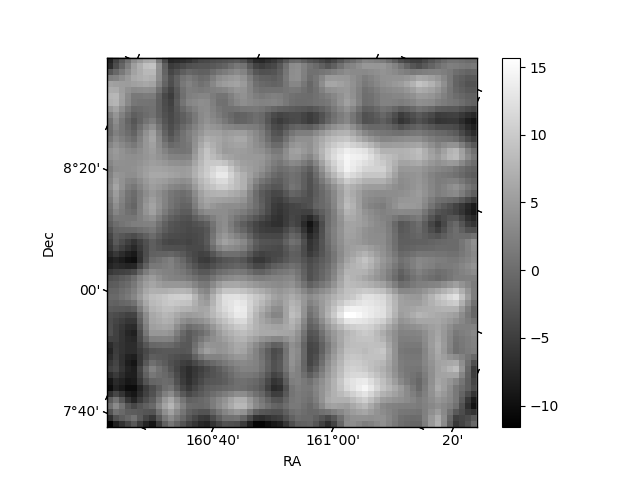
| Quadrant A |  |
 |
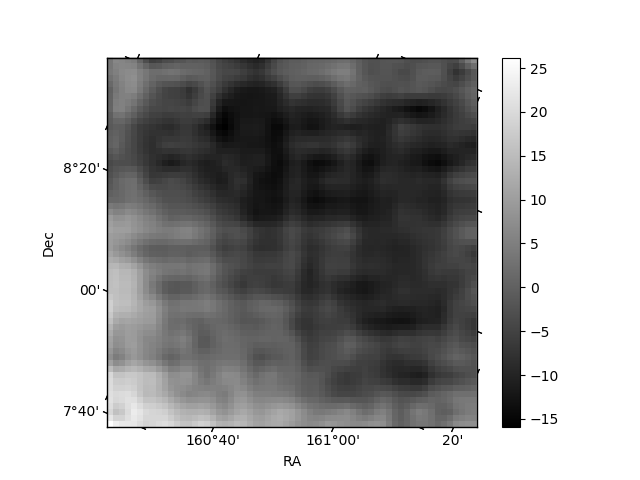
Quadrant B |
|---|---|---|---|
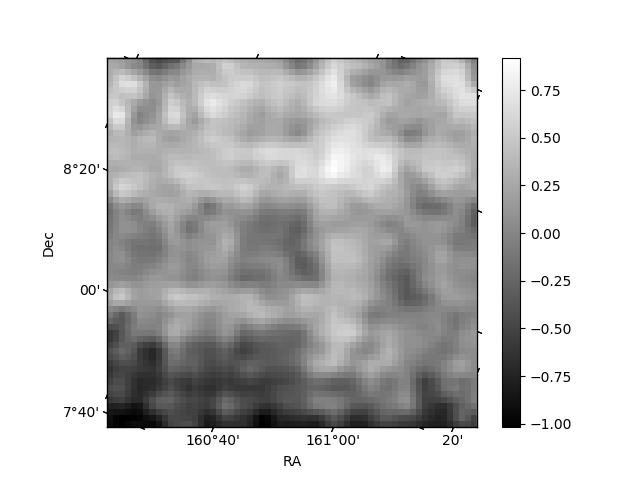
| Quadrant D |  |
 |
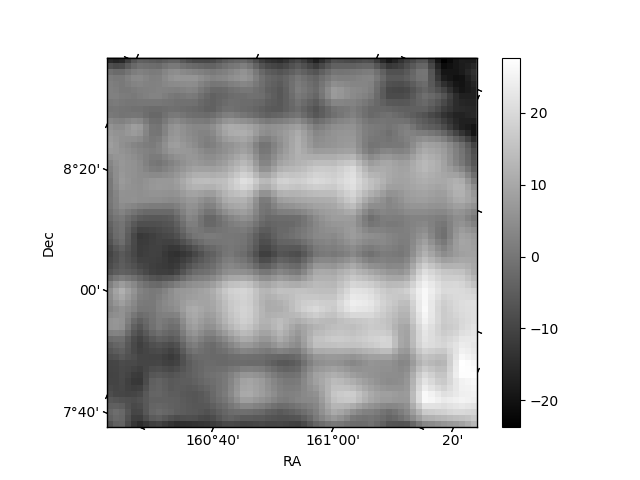
Quadrant C |
| Plot type | Count rate plots | Images |
|---|---|---|
| Comparison with Poisson distribution Blue bars denote a histogram of data divided into 1 sec bins. Red curve is a Poisson curve with rate = median count rate of data. |
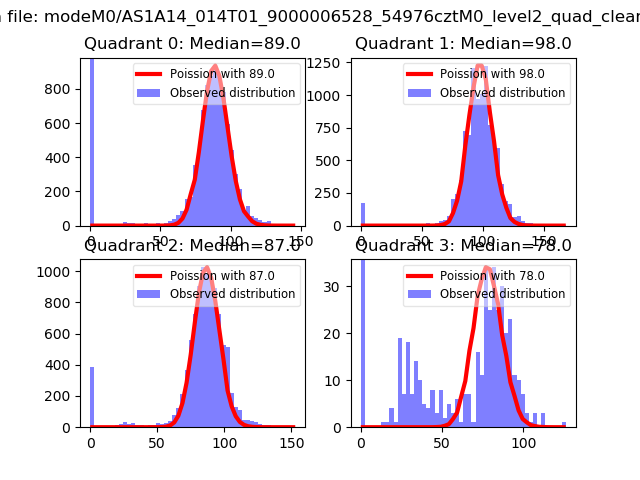 |
 |
| Quadrant-wise count rates Data is divided into 100 sec bins |
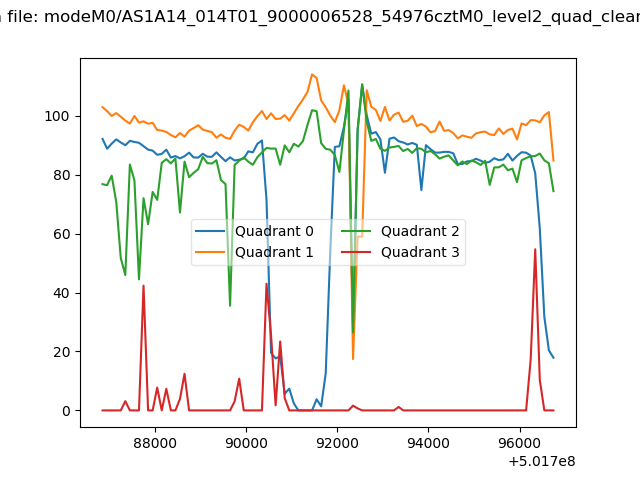 |
|
| Module-wise count rates for Quadrant A Data is divided into 100 sec bins |
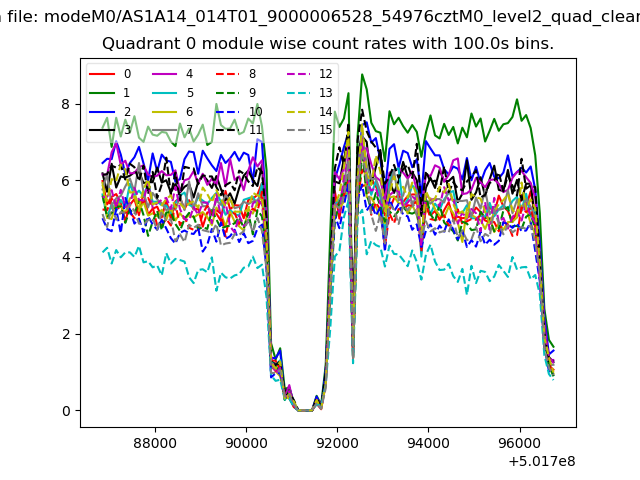 |
 |
| Module-wise count rates for Quadrant B Data is divided into 100 sec bins |
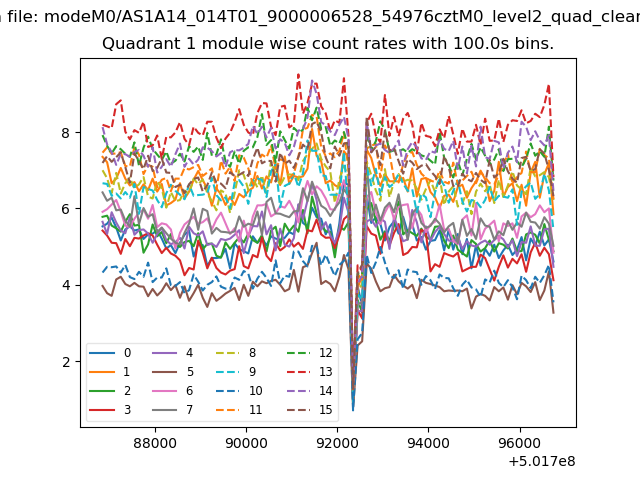 |
 |
| Module-wise count rates for Quadrant C Data is divided into 100 sec bins |
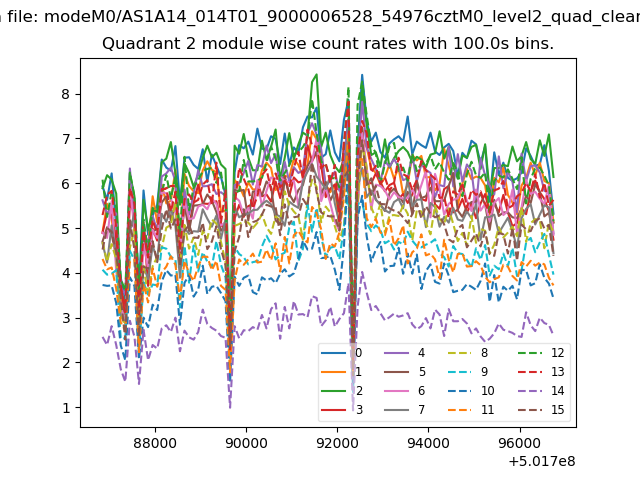 |
 |
| Module-wise count rates for Quadrant D Data is divided into 100 sec bins |
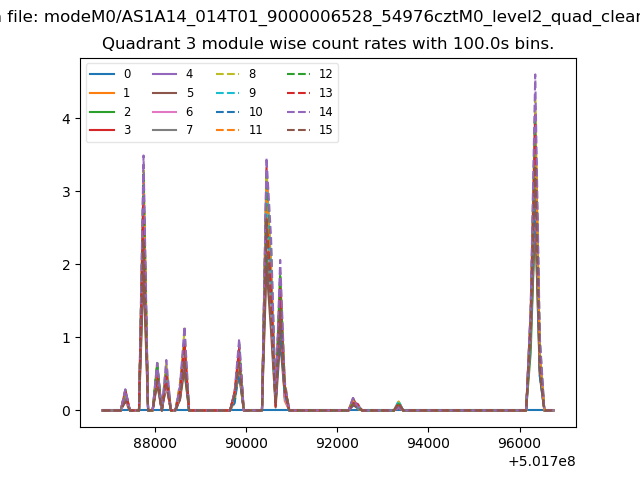 |
 |
| Parameter | Plot |
|---|---|
| CZT HV Monitor | 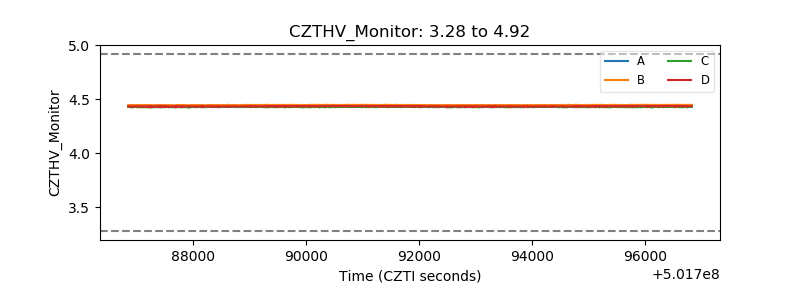 |
| D_VDD | 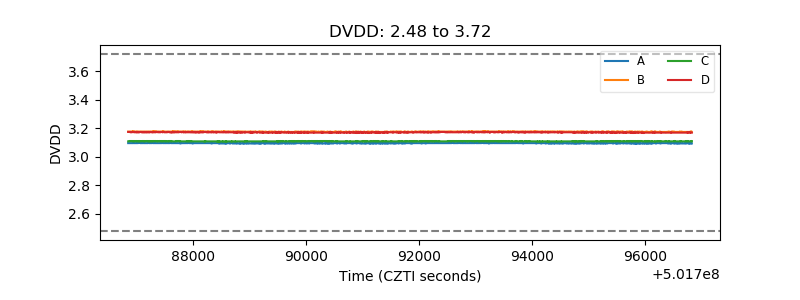 |
| Temperature 1 | 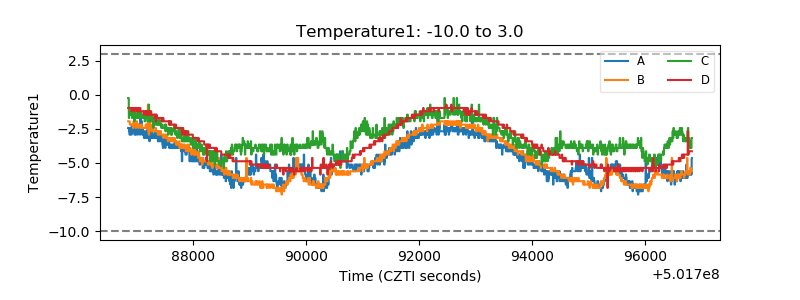 |
| Veto HV Monitor | 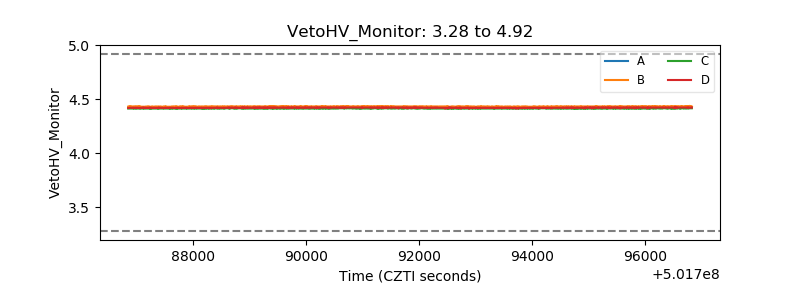 |
| Veto LLD |  |
| Alpha Counter | 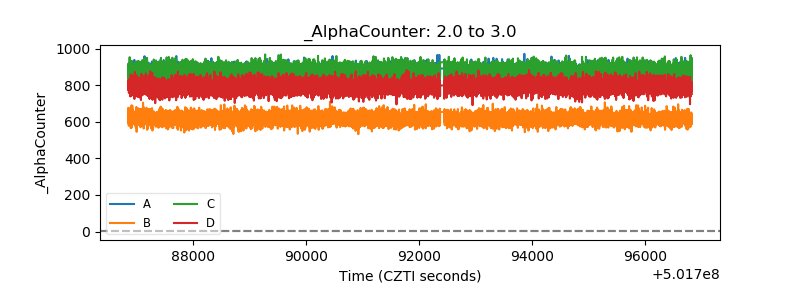 |
| _CPM_Rate | 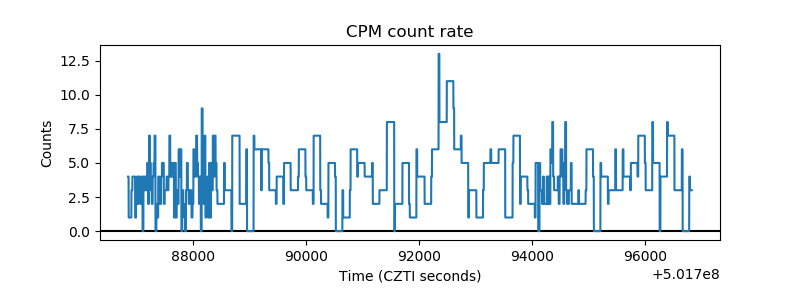 |
| CZT Counter | 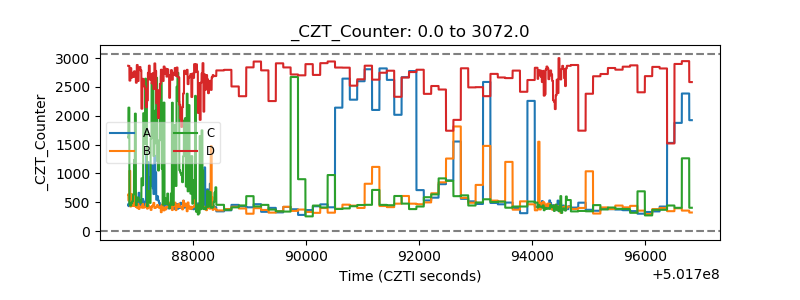 |
| +2.5 Volts monitor |  |
| +5 Volts monitor |  |
| _ROLL_ROT | 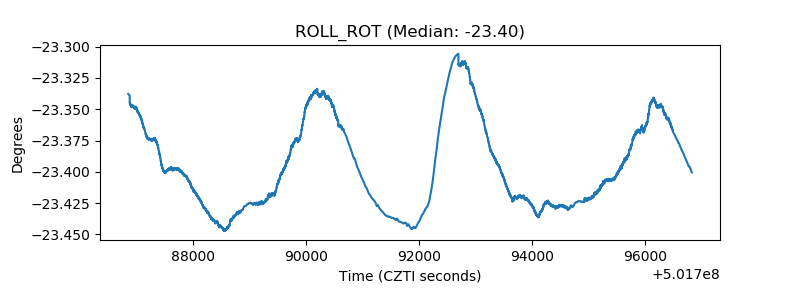 |
| _Roll_DEC | 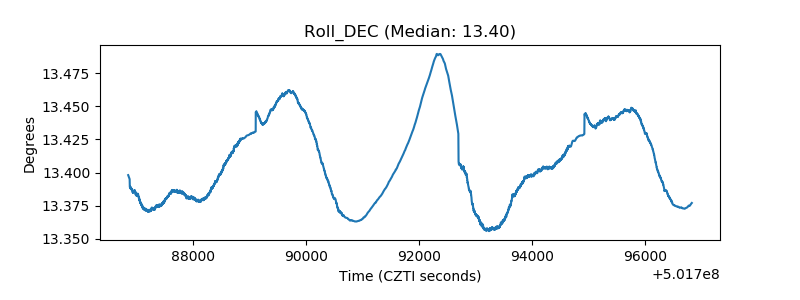 |
| _Roll_RA | 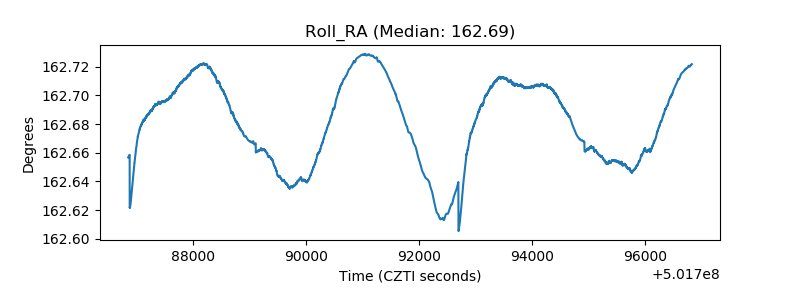 |
| Veto Counter | 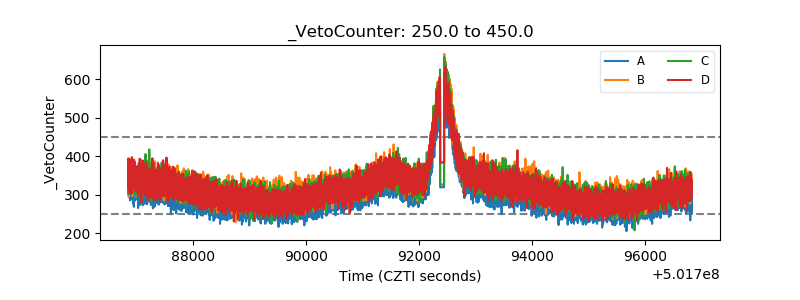 |