| Param | Original file | Final file |
|---|---|---|
| Filename | modeM0/AS1A14_014T01_9000006528_54978cztM0_level2.fits | modeM0/AS1A14_014T01_9000006528_54978cztM0_level2_quad_clean.evt |
| Size (bytes) | 2,422,912,320 | 217,630,080 |
| Size | 2.3 GB | 207.5 MB |
| Events in quadrant A | 19,160,037 | 1,386,302 |
| Events in quadrant B | 9,027,222 | 1,948,236 |
| Events in quadrant C | 11,339,999 | 1,687,753 |
| Events in quadrant D | 48,653,245 | 221,144 |
| Mode M0 | |||
|---|---|---|---|
| Quadrant | BADHDUFLAG | Total packets | Discarded packets |
| A | 0 | 70548 | 4 |
| B | 0 | 41645 | 4 |
| C | 0 | 48070 | 4 |
| D | 0 | 157880 | 12 |
| Mode SS | |||
|---|---|---|---|
| Quadrant | BADHDUFLAG | Total packets | Discarded packets |
| A | 0 | 402 | 0 |
| B | 0 | 402 | 0 |
| C | 0 | 402 | 0 |
| D | 0 | 402 | 0 |
| Mode M9 | |||
|---|---|---|---|
| Quadrant | BADHDUFLAG | Total packets | Discarded packets |
| A | 0 | 28 | 0 |
| B | 0 | 28 | 0 |
| C | 0 | 28 | 0 |
| D | 0 | 28 | 0 |
| Quadrant | Total seconds | Saturated seconds | Saturation percentage |
|---|---|---|---|
| A | 19515 | 4166 | 21.347681% |
| B | 19515 | 165 | 0.845503% |
| C | 19515 | 707 | 3.622854% |
| D | 19514 | 17186 | 88.070104% |
Noise dominated data is calculated using 1-second bins in cleaned event files. If a bin has >2000 counts, and if more than 50% of those come from <1% of pixels, then it is considered to be noise-dominated and hence unusable.
| Quadrant | # 1 sec bins | Bins with >0 counts | Bins with >2000 counts | High rate bins dominated by noise | Noise dominated (total time) | Noise dominated (detector-on time) | Marked lightcurve |
|---|---|---|---|---|---|---|---|
| A | 22485 | 19519 | 3344 | 3344 | 14.87% | 17.13% | 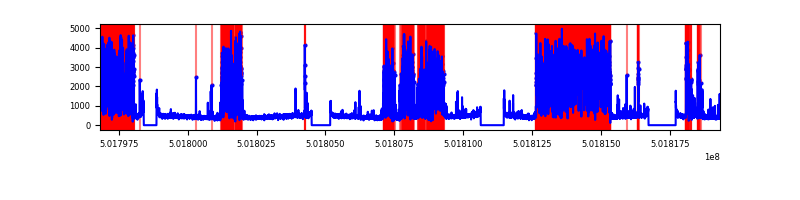 |
| B | 22485 | 19519 | 35 | 35 | 0.16% | 0.18% | 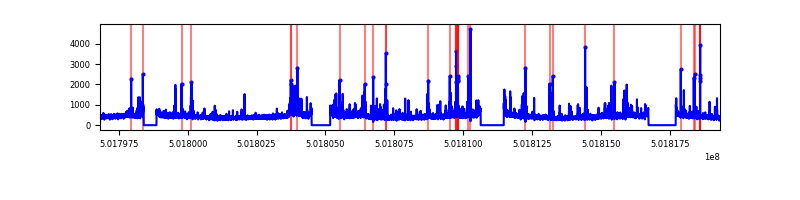 |
| C | 22485 | 19519 | 528 | 528 | 2.35% | 2.71% | 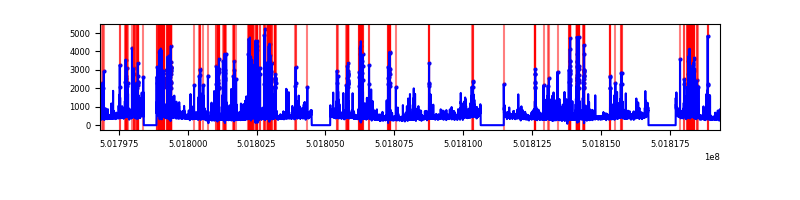 |
| D | 22485 | 19515 | 16595 | 16595 | 73.80% | 85.04% | 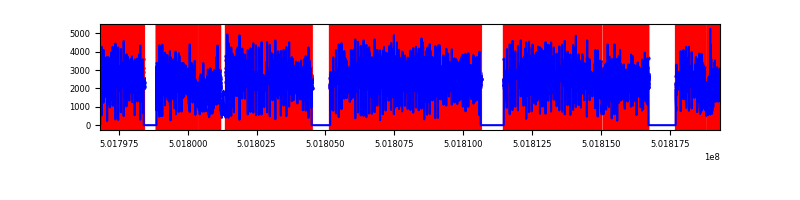 |
Top three noisy pixels from each quadrant. If the there are fewer than three noisy pixels in the level2.evt file, extra rows are filled as -1
| Pixel properties | Quadrant properties | ||||||
|---|---|---|---|---|---|---|---|
| Quadrant | DetID | PixID | Counts | Sigma | Mean | Median | Sigma |
| A | 15 | 32 | 11396232 | 24784.96 | 1860 | 1811 | 459.7 |
| A | 13 | 248 | 135586 | 290.99 | 1860 | 1811 | 459.7 |
| A | 4 | 3 | 119207 | 255.36 | 1860 | 1811 | 459.7 |
| B | 5 | 185 | 367110 | 826.01 | 2052 | 1974 | 442.0 |
| B | 10 | 245 | 182773 | 409.0 | 2052 | 1974 | 442.0 |
| B | 10 | 247 | 77825 | 171.59 | 2052 | 1974 | 442.0 |
| C | 4 | 5 | 1848555 | 3370.0 | 1990 | 1978 | 547.9 |
| C | 13 | 3 | 739851 | 1346.61 | 1990 | 1978 | 547.9 |
| C | 6 | 223 | 300370 | 544.56 | 1990 | 1978 | 547.9 |
| D | 15 | 94 | 41674915 | 157746.33 | 921 | 877 | 264.2 |
| D | 11 | 129 | 822832 | 3111.3 | 921 | 877 | 264.2 |
| D | 9 | 19 | 578560 | 2186.67 | 921 | 877 | 264.2 |
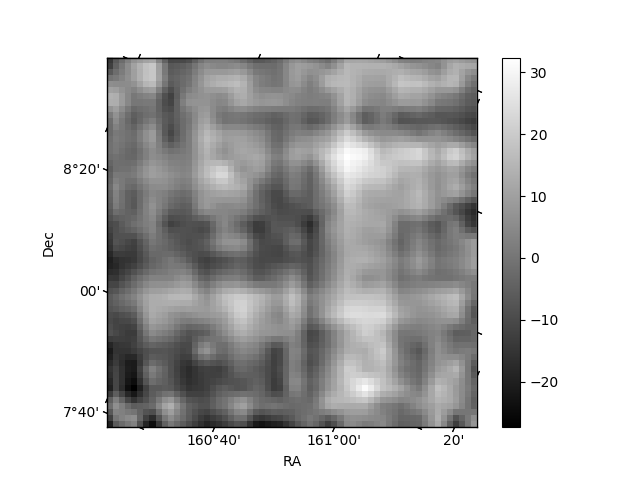
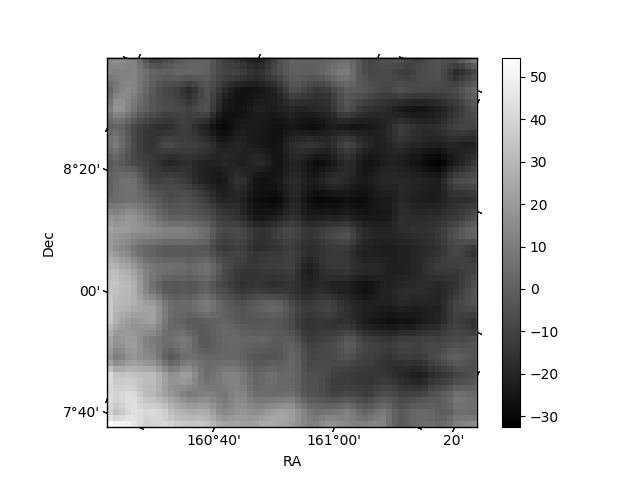
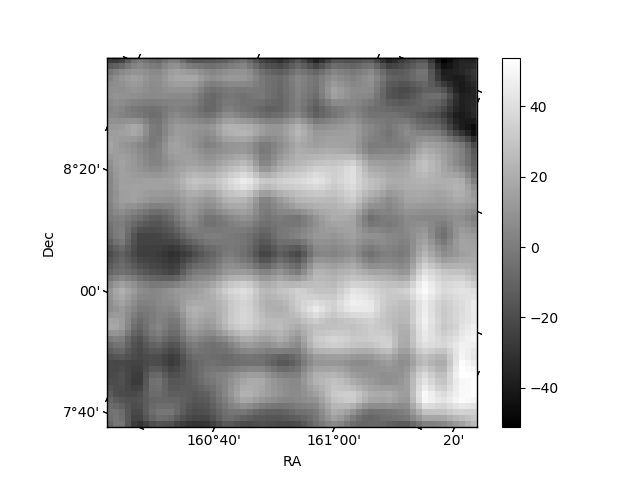
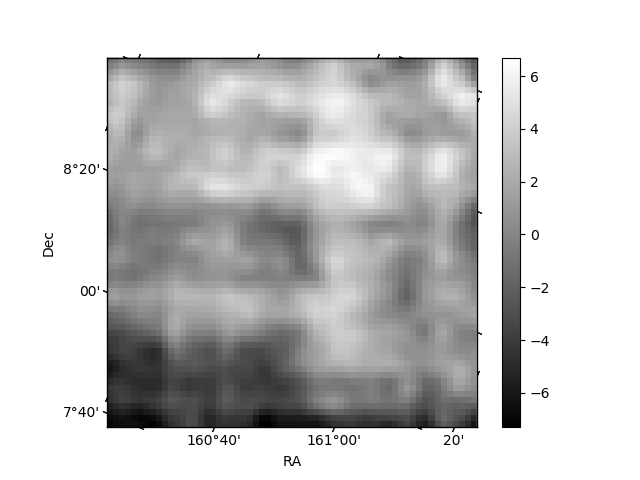
Histogram calculated using DETX and DETY for each event in the final _common_clean file
| Quadrant A | 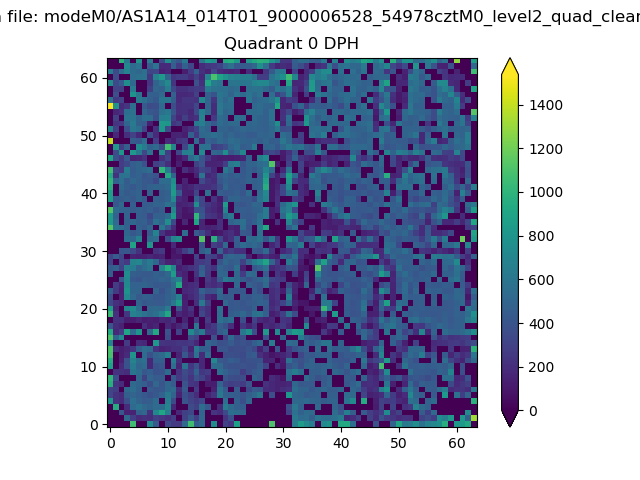 |
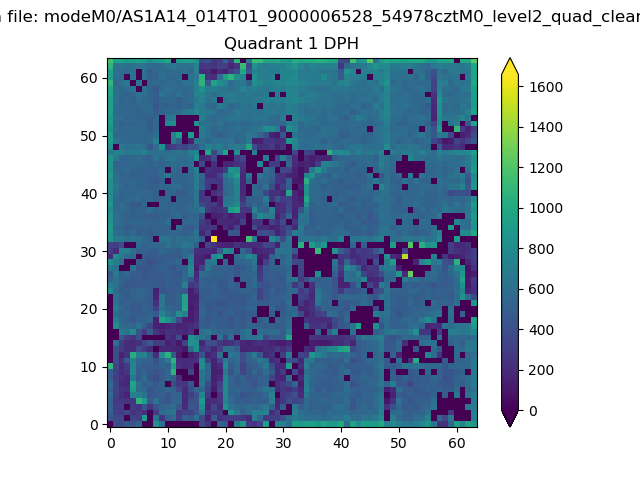 |
Quadrant B |
|---|---|---|---|
| Quadrant D | 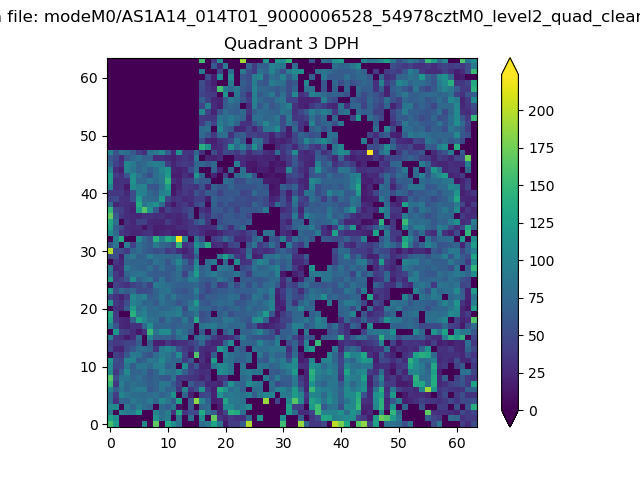 |
 |
Quadrant C |
| Plot type | Count rate plots | Images |
|---|---|---|
| Comparison with Poisson distribution Blue bars denote a histogram of data divided into 1 sec bins. Red curve is a Poisson curve with rate = median count rate of data. |
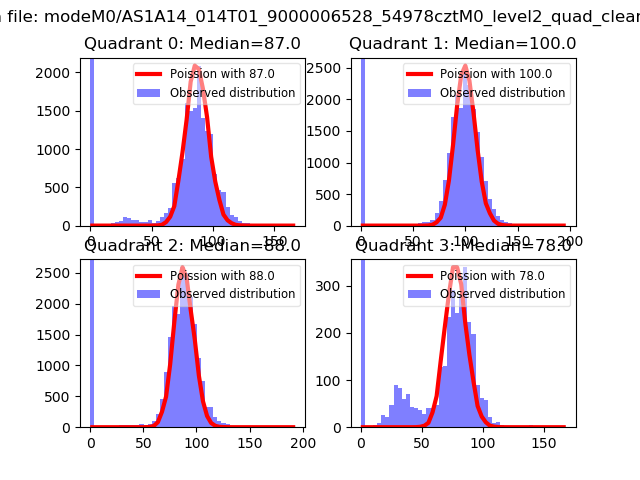 |
 |
| Quadrant-wise count rates Data is divided into 100 sec bins |
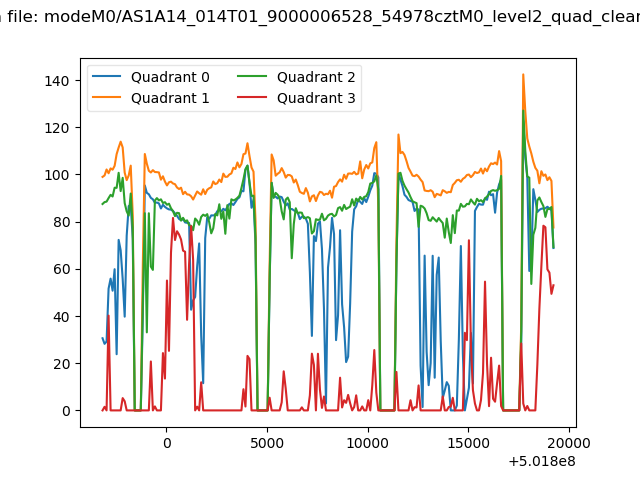 |
|
| Module-wise count rates for Quadrant A Data is divided into 100 sec bins |
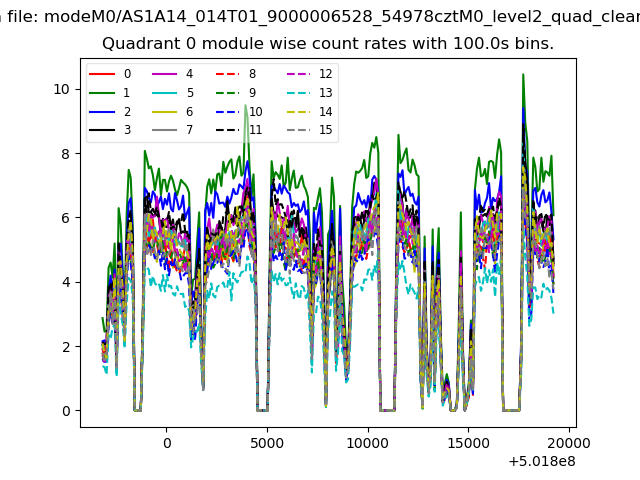 |
 |
| Module-wise count rates for Quadrant B Data is divided into 100 sec bins |
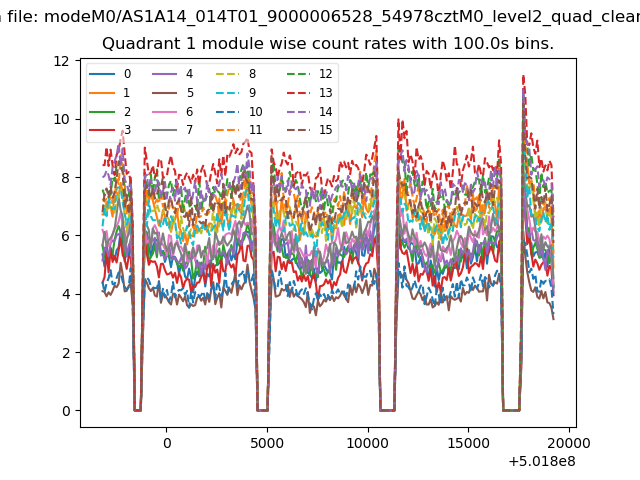 |
 |
| Module-wise count rates for Quadrant C Data is divided into 100 sec bins |
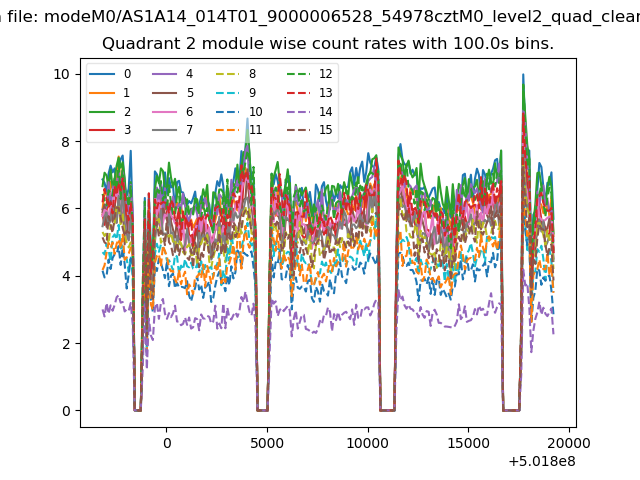 |
 |
| Module-wise count rates for Quadrant D Data is divided into 100 sec bins |
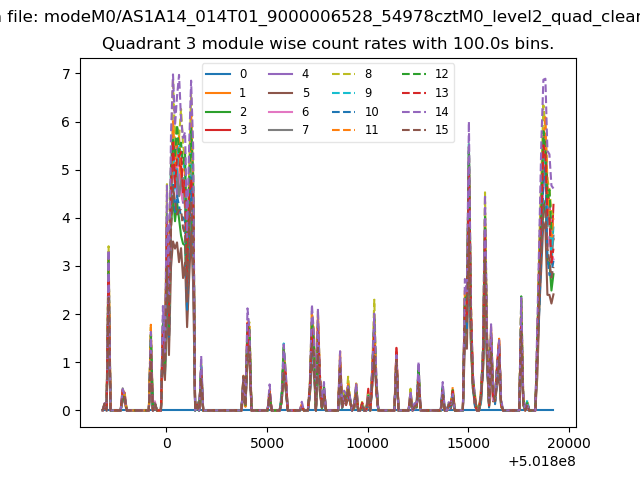 |
 |
| Parameter | Plot |
|---|---|
| CZT HV Monitor | 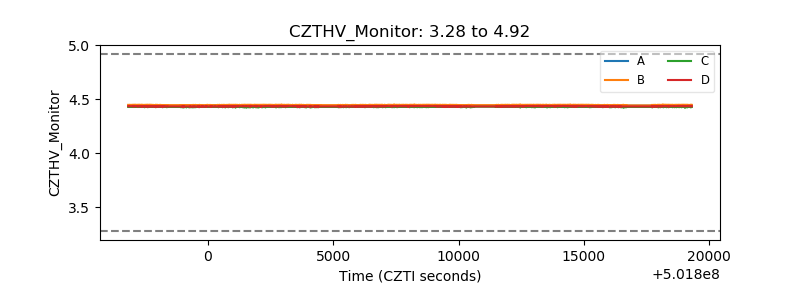 |
| D_VDD | 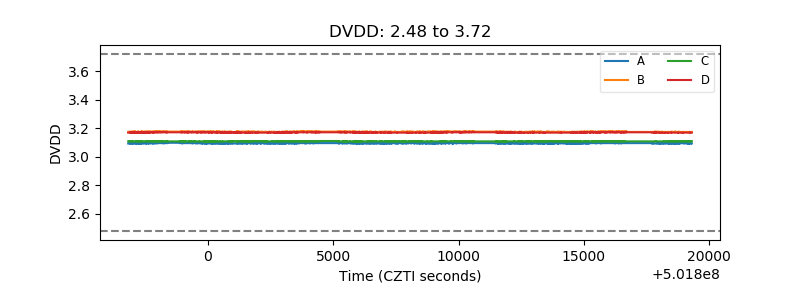 |
| Temperature 1 | 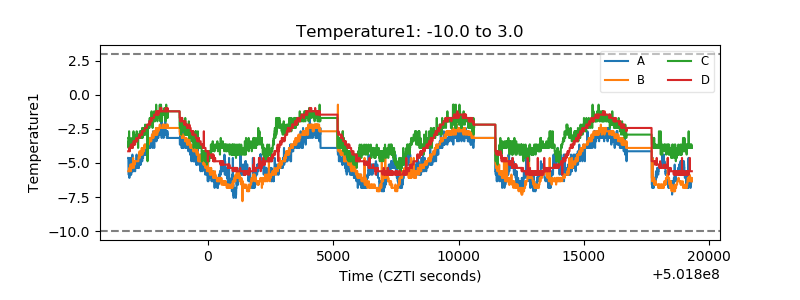 |
| Veto HV Monitor | 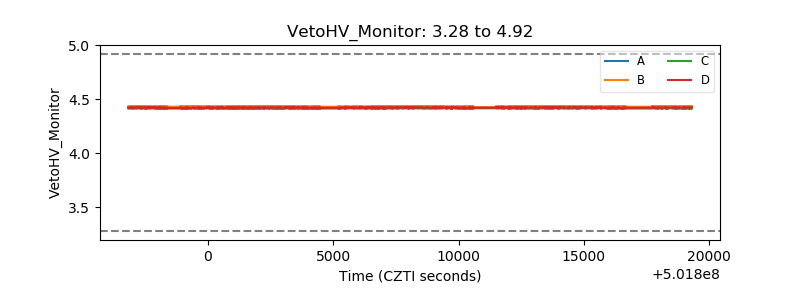 |
| Veto LLD | 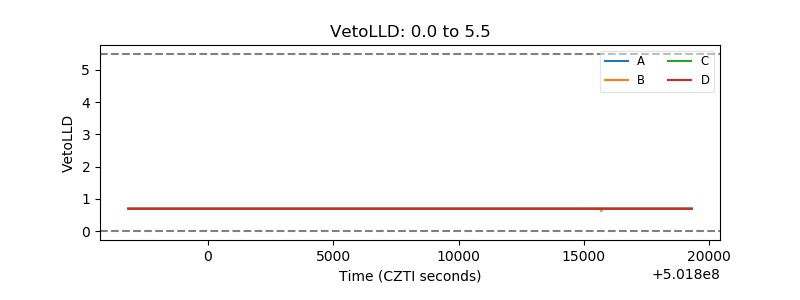 |
| Alpha Counter | 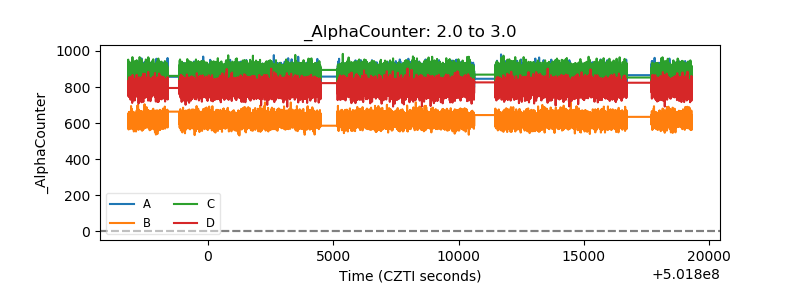 |
| _CPM_Rate | 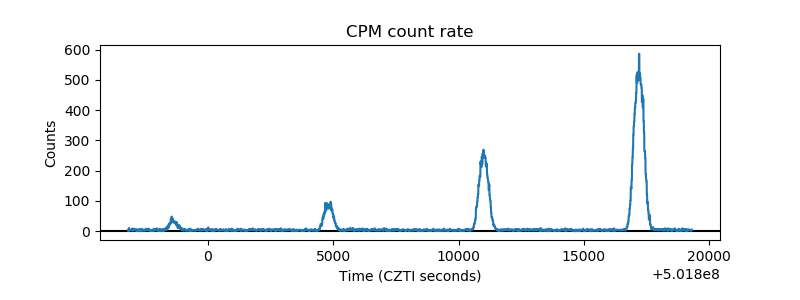 |
| CZT Counter |  |
| +2.5 Volts monitor |  |
| +5 Volts monitor |  |
| _ROLL_ROT | 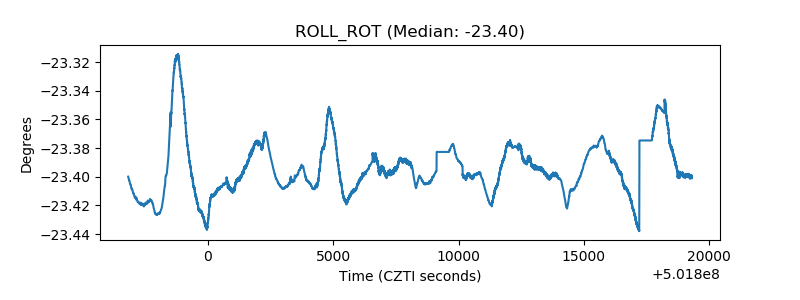 |
| _Roll_DEC | 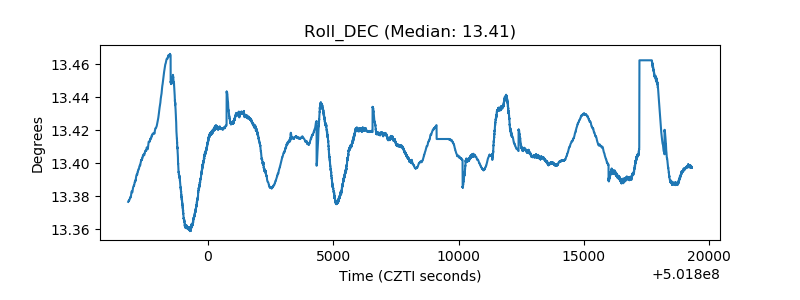 |
| _Roll_RA |  |
| Veto Counter | 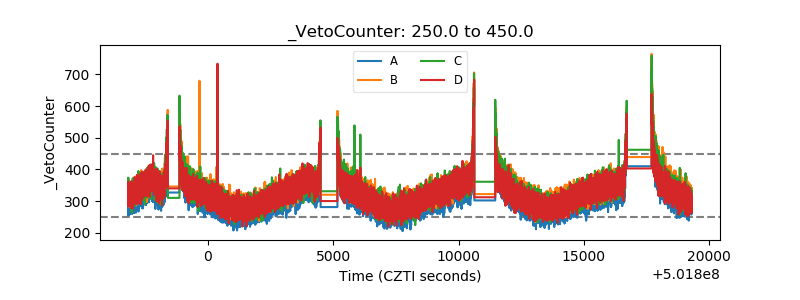 |