| Param | Original file | Final file |
|---|---|---|
| Filename | modeM0/AS1A14_014T01_9000006528_54979cztM0_level2.fits | modeM0/AS1A14_014T01_9000006528_54979cztM0_level2_quad_clean.evt |
| Size (bytes) | 744,160,320 | 86,762,880 |
| Size | 709.7 MB | 82.7 MB |
| Events in quadrant A | 4,833,451 | 607,611 |
| Events in quadrant B | 3,020,230 | 703,703 |
| Events in quadrant C | 4,724,529 | 582,523 |
| Events in quadrant D | 14,446,577 | 264,089 |
| Mode M0 | |||
|---|---|---|---|
| Quadrant | BADHDUFLAG | Total packets | Discarded packets |
| A | 0 | 19175 | 2 |
| B | 0 | 14135 | 2 |
| C | 0 | 18910 | 2 |
| D | 0 | 47543 | 3 |
| Mode SS | |||
|---|---|---|---|
| Quadrant | BADHDUFLAG | Total packets | Discarded packets |
| A | 0 | 136 | 0 |
| B | 0 | 136 | 0 |
| C | 0 | 136 | 0 |
| D | 0 | 136 | 0 |
| Mode M9 | |||
|---|---|---|---|
| Quadrant | BADHDUFLAG | Total packets | Discarded packets |
| A | 0 | 11 | 0 |
| B | 0 | 11 | 0 |
| C | 0 | 11 | 0 |
| D | 0 | 11 | 0 |
| Quadrant | Total seconds | Saturated seconds | Saturation percentage |
|---|---|---|---|
| A | 6730 | 518 | 7.696880% |
| B | 6730 | 37 | 0.549777% |
| C | 6731 | 511 | 7.591740% |
| D | 6730 | 3841 | 57.072808% |
Noise dominated data is calculated using 1-second bins in cleaned event files. If a bin has >2000 counts, and if more than 50% of those come from <1% of pixels, then it is considered to be noise-dominated and hence unusable.
| Quadrant | # 1 sec bins | Bins with >0 counts | Bins with >2000 counts | High rate bins dominated by noise | Noise dominated (total time) | Noise dominated (detector-on time) | Marked lightcurve |
|---|---|---|---|---|---|---|---|
| A | 7850 | 6731 | 433 | 433 | 5.52% | 6.43% | 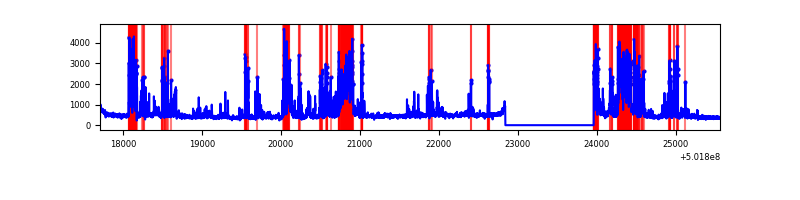 |
| B | 7850 | 6731 | 19 | 19 | 0.24% | 0.28% | 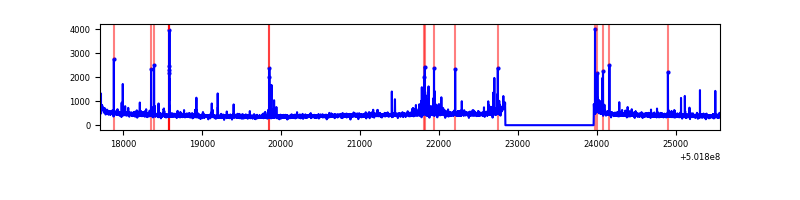 |
| C | 7851 | 6732 | 446 | 446 | 5.68% | 6.63% | 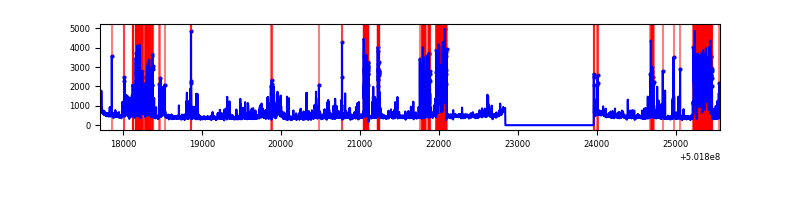 |
| D | 7850 | 6731 | 4158 | 4158 | 52.97% | 61.77% | 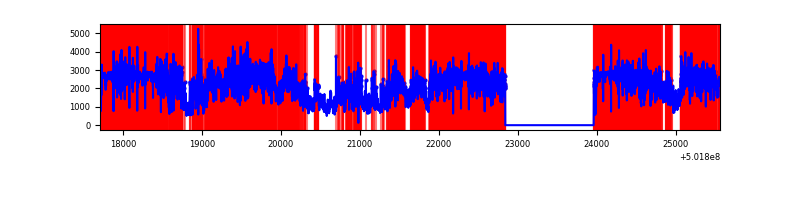 |
Top three noisy pixels from each quadrant. If the there are fewer than three noisy pixels in the level2.evt file, extra rows are filled as -1
| Pixel properties | Quadrant properties | ||||||
|---|---|---|---|---|---|---|---|
| Quadrant | DetID | PixID | Counts | Sigma | Mean | Median | Sigma |
| A | 15 | 32 | 1939214 | 11288.52 | 690 | 675 | 171.7 |
| A | 13 | 248 | 78918 | 455.63 | 690 | 675 | 171.7 |
| A | 0 | 8 | 42680 | 244.6 | 690 | 675 | 171.7 |
| B | 10 | 245 | 101886 | 665.07 | 709 | 685 | 152.2 |
| B | 5 | 185 | 33145 | 213.32 | 709 | 685 | 152.2 |
| B | 10 | 14 | 26323 | 168.49 | 709 | 685 | 152.2 |
| C | 4 | 5 | 847284 | 4585.01 | 669 | 665 | 184.6 |
| C | 13 | 3 | 825100 | 4464.86 | 669 | 665 | 184.6 |
| C | 14 | 254 | 138081 | 744.2 | 669 | 665 | 184.6 |
| D | 15 | 94 | 11532195 | 80867.12 | 497 | 474 | 142.6 |
| D | 1 | 31 | 284001 | 1988.25 | 497 | 474 | 142.6 |
| D | 11 | 129 | 124683 | 871.02 | 497 | 474 | 142.6 |
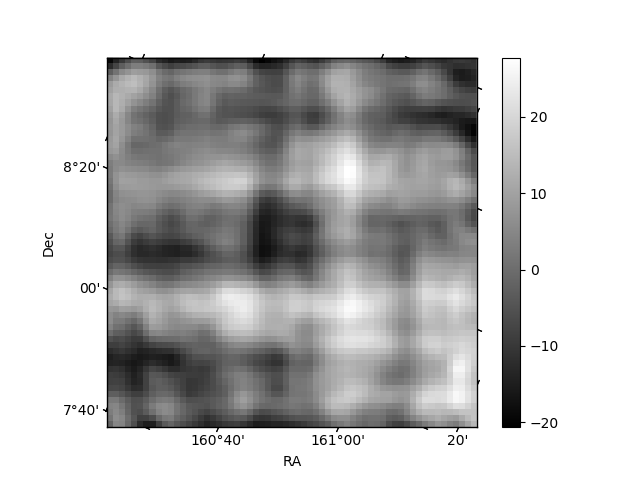
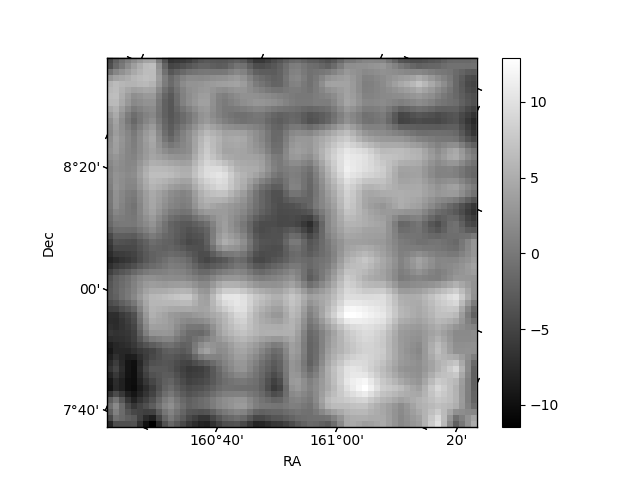
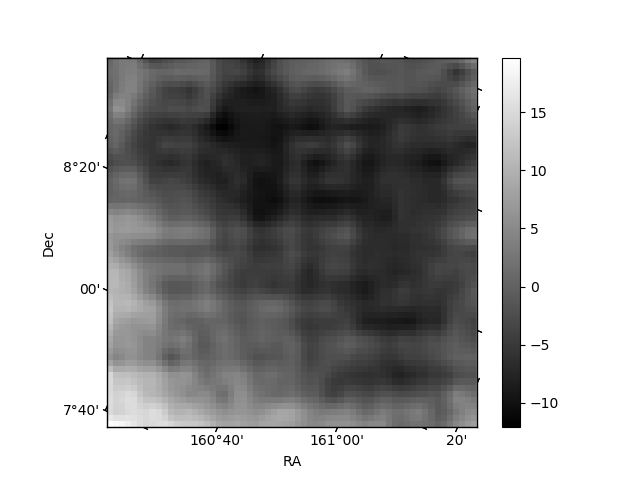
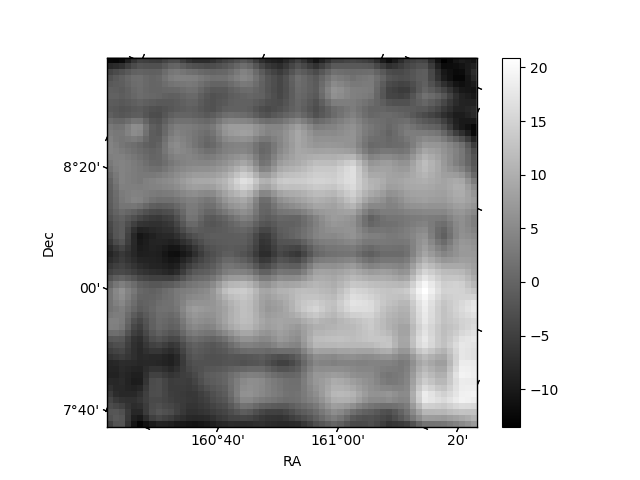
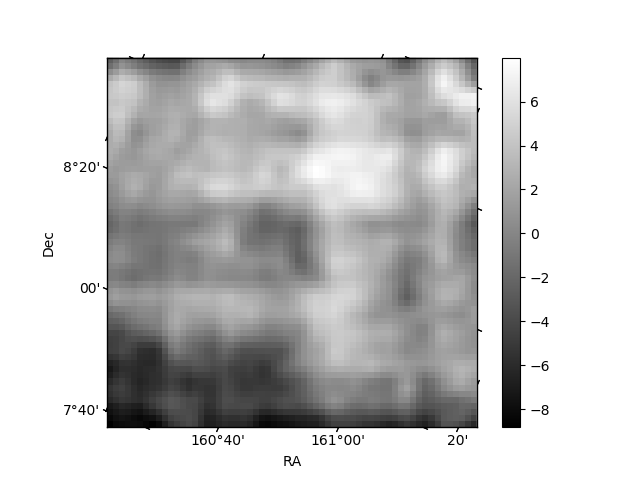
Histogram calculated using DETX and DETY for each event in the final _common_clean file
| Quadrant A | 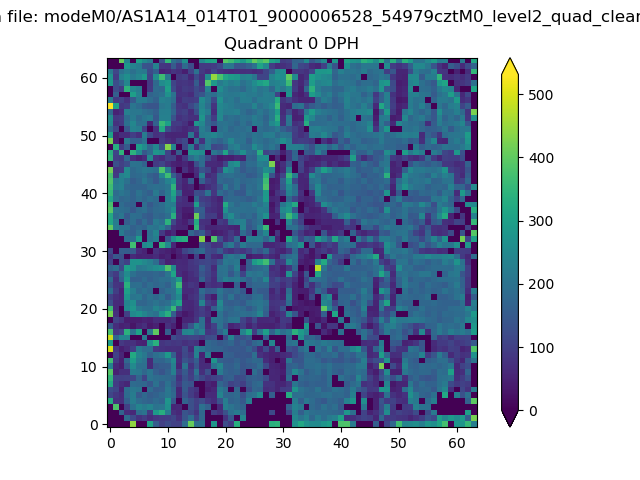 |
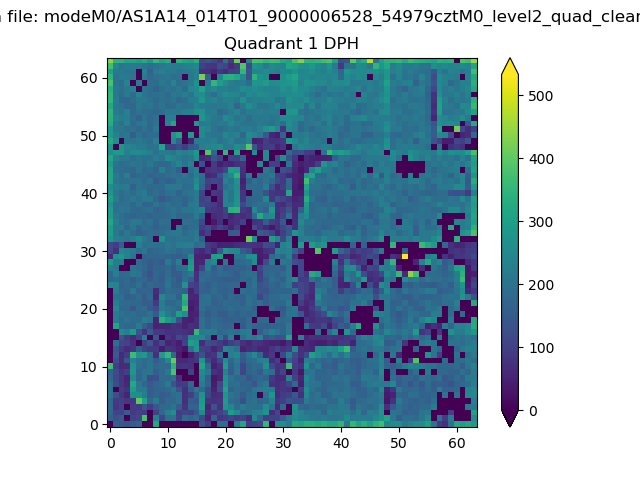 |
Quadrant B |
|---|---|---|---|
| Quadrant D | 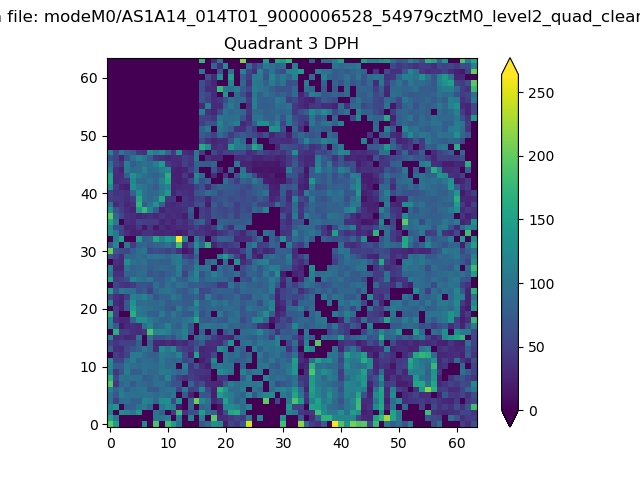 |
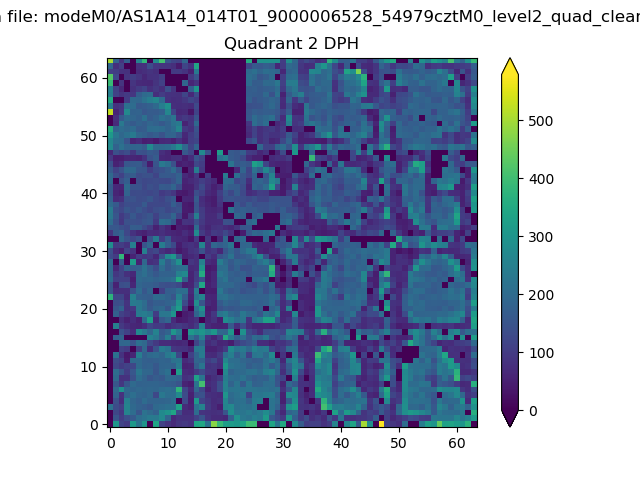 |
Quadrant C |
| Plot type | Count rate plots | Images |
|---|---|---|
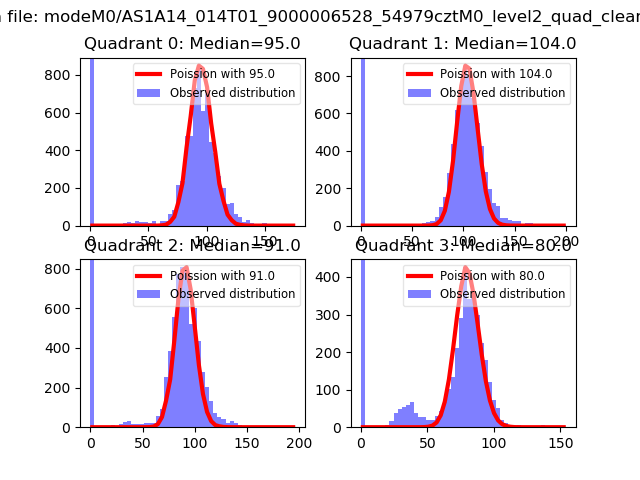
| Comparison with Poisson distribution Blue bars denote a histogram of data divided into 1 sec bins. Red curve is a Poisson curve with rate = median count rate of data. |
 |
 |
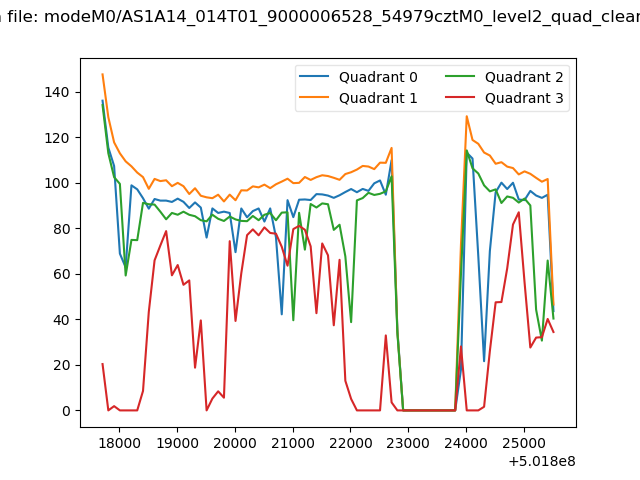
| Quadrant-wise count rates Data is divided into 100 sec bins |
 |
|
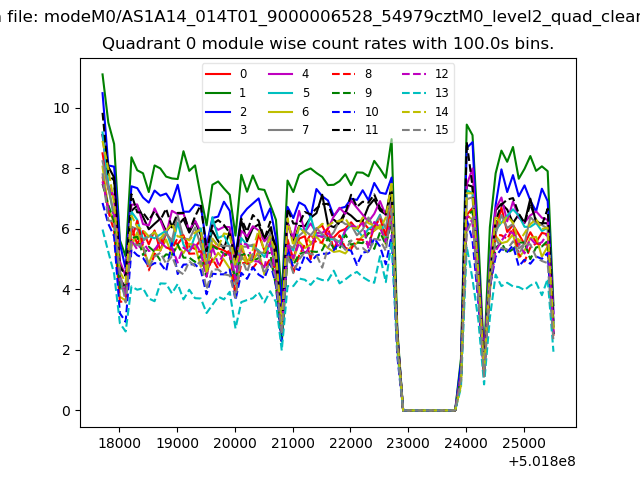
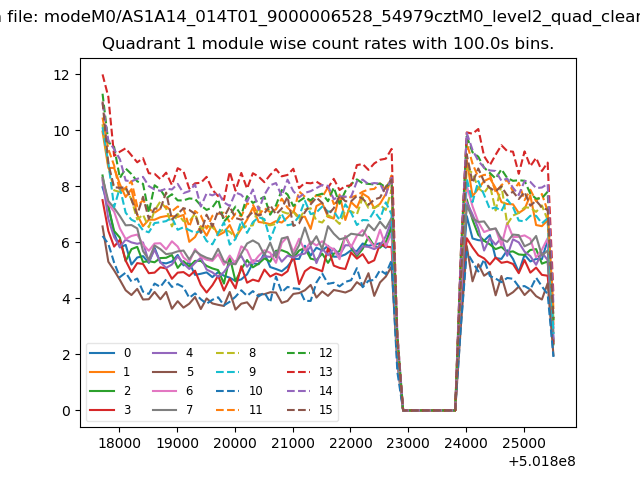
| Module-wise count rates for Quadrant A Data is divided into 100 sec bins |
 |
 |
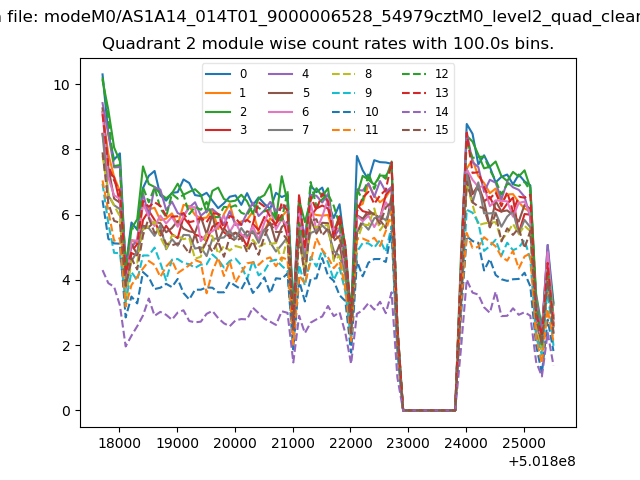
| Module-wise count rates for Quadrant B Data is divided into 100 sec bins |
 |
 |
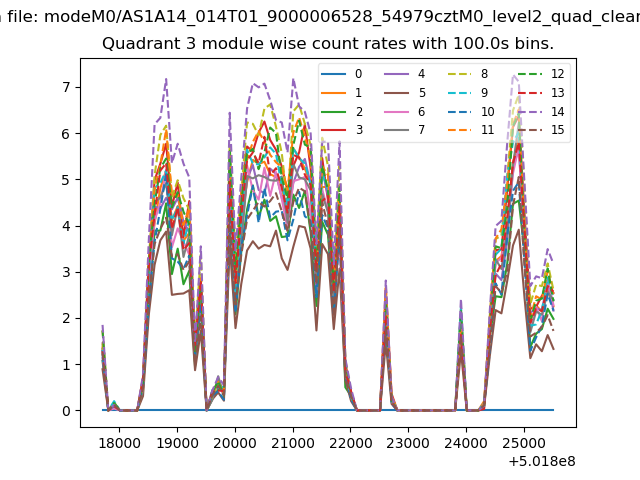
| Module-wise count rates for Quadrant C Data is divided into 100 sec bins |
 |
 |
| Module-wise count rates for Quadrant D Data is divided into 100 sec bins |
 |
 |
| Parameter | Plot |
|---|---|
| CZT HV Monitor | 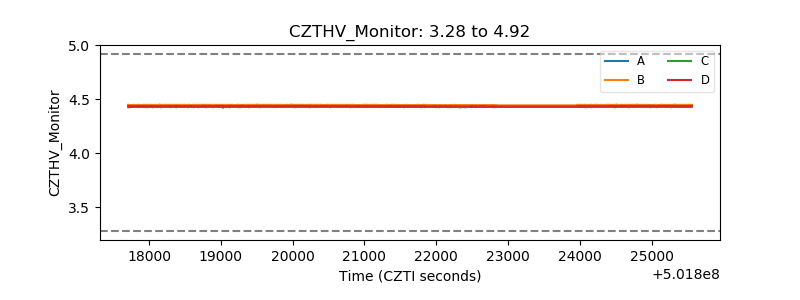 |
| D_VDD | 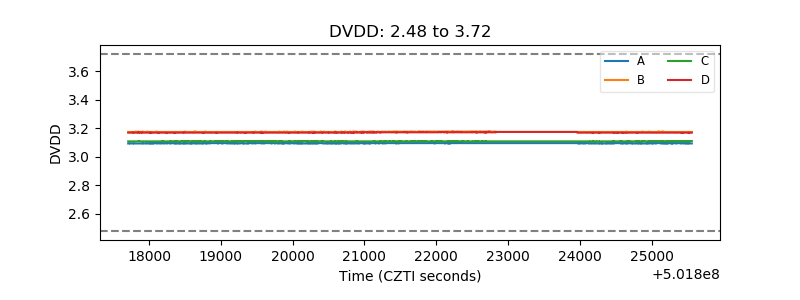 |
| Temperature 1 | 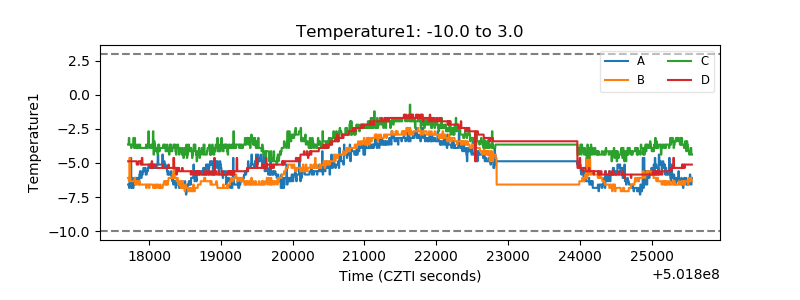 |
| Veto HV Monitor | 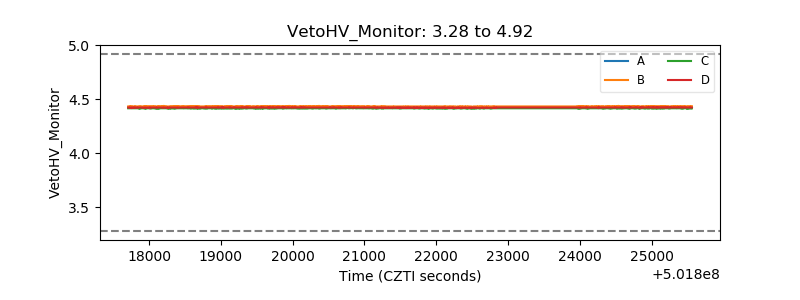 |
| Veto LLD |  |
| Alpha Counter | 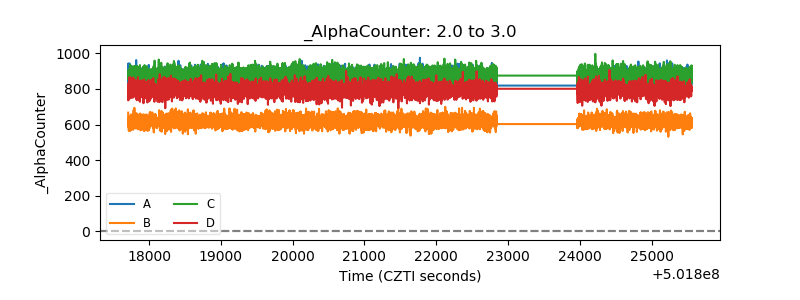 |
| _CPM_Rate | 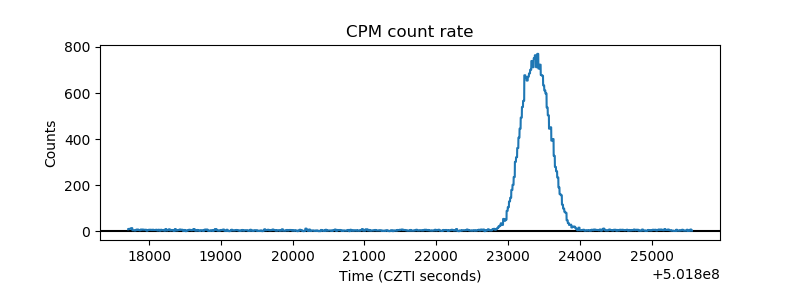 |
| CZT Counter | 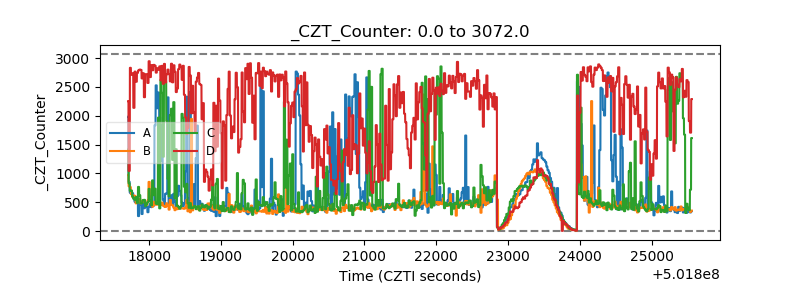 |
| +2.5 Volts monitor | 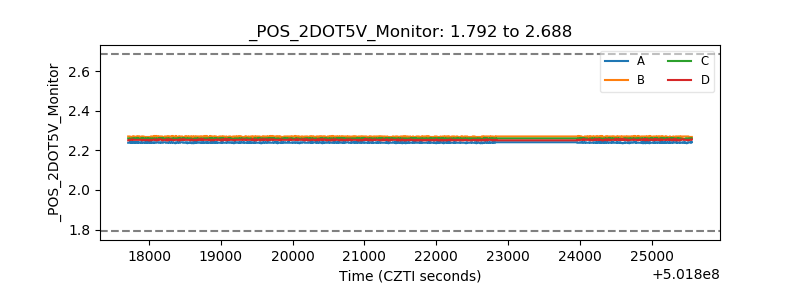 |
| +5 Volts monitor |  |
| _ROLL_ROT | 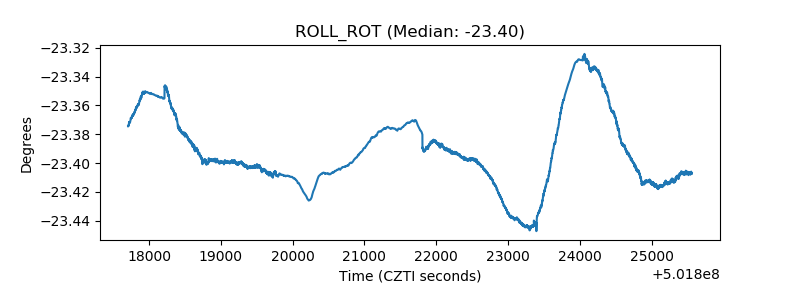 |
| _Roll_DEC | 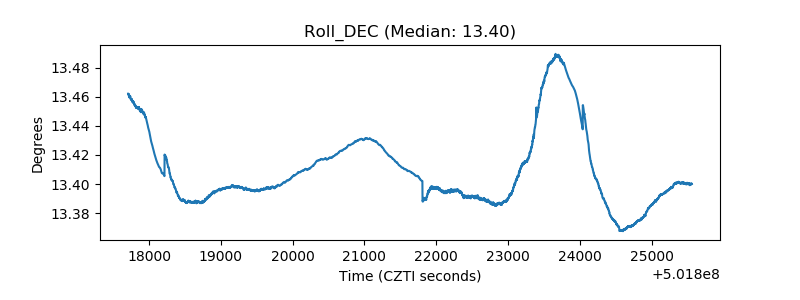 |
| _Roll_RA | 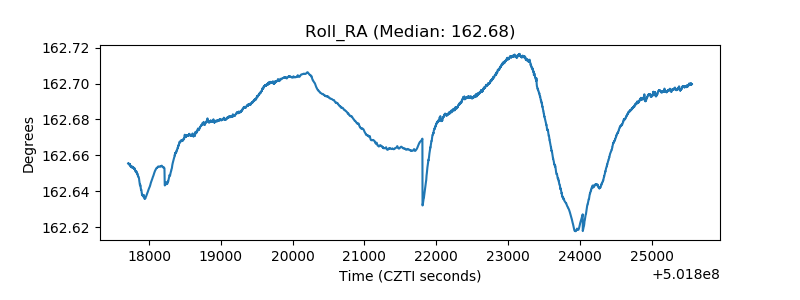 |
| Veto Counter | 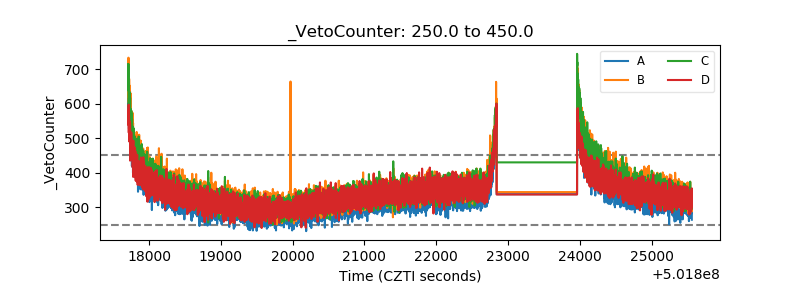 |