| Param | Original file | Final file |
|---|---|---|
| Filename | modeM0/AS1A14_014T01_9000006528_54980cztM0_level2.fits | modeM0/AS1A14_014T01_9000006528_54980cztM0_level2_quad_clean.evt |
| Size (bytes) | 719,061,120 | 77,137,920 |
| Size | 685.8 MB | 73.6 MB |
| Events in quadrant A | 4,018,727 | 570,153 |
| Events in quadrant B | 2,937,908 | 653,948 |
| Events in quadrant C | 4,307,880 | 549,424 |
| Events in quadrant D | 14,871,611 | 129,400 |
| Mode M0 | |||
|---|---|---|---|
| Quadrant | BADHDUFLAG | Total packets | Discarded packets |
| A | 0 | 16514 | 1 |
| B | 0 | 13394 | 1 |
| C | 0 | 17357 | 1 |
| D | 0 | 48471 | 1 |
| Mode SS | |||
|---|---|---|---|
| Quadrant | BADHDUFLAG | Total packets | Discarded packets |
| A | 0 | 126 | 0 |
| B | 0 | 126 | 0 |
| C | 0 | 126 | 0 |
| D | 0 | 126 | 0 |
| Mode M9 | |||
|---|---|---|---|
| Quadrant | BADHDUFLAG | Total packets | Discarded packets |
| A | 0 | 11 | 0 |
| B | 0 | 11 | 0 |
| C | 0 | 11 | 0 |
| D | 0 | 11 | 0 |
| Quadrant | Total seconds | Saturated seconds | Saturation percentage |
|---|---|---|---|
| A | 6197 | 418 | 6.745199% |
| B | 6198 | 71 | 1.145531% |
| C | 6198 | 405 | 6.534366% |
| D | 6198 | 4790 | 77.282995% |
Noise dominated data is calculated using 1-second bins in cleaned event files. If a bin has >2000 counts, and if more than 50% of those come from <1% of pixels, then it is considered to be noise-dominated and hence unusable.
| Quadrant | # 1 sec bins | Bins with >0 counts | Bins with >2000 counts | High rate bins dominated by noise | Noise dominated (total time) | Noise dominated (detector-on time) | Marked lightcurve |
|---|---|---|---|---|---|---|---|
| A | 7332 | 6198 | 322 | 322 | 4.39% | 5.20% | 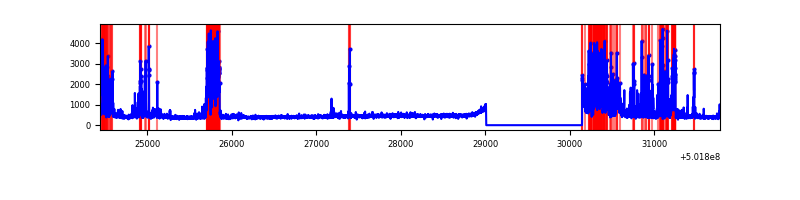 |
| B | 7333 | 6199 | 27 | 27 | 0.37% | 0.44% | 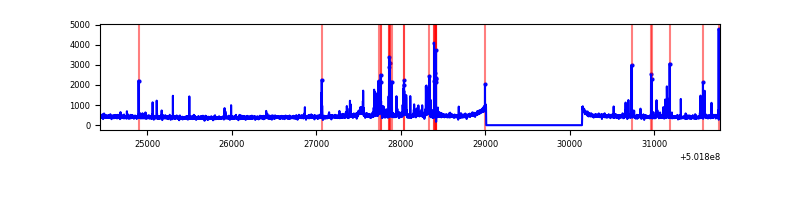 |
| C | 7333 | 6199 | 357 | 357 | 4.87% | 5.76% | 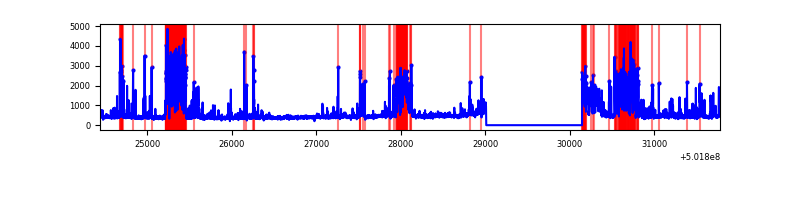 |
| D | 7333 | 6198 | 4920 | 4920 | 67.09% | 79.38% | 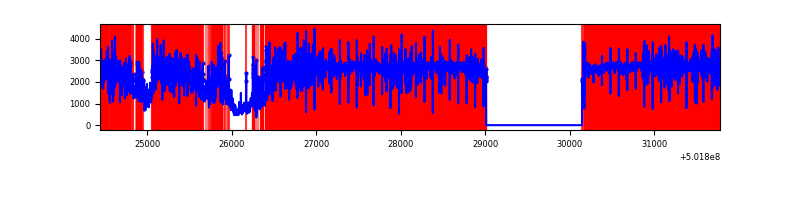 |
Top three noisy pixels from each quadrant. If the there are fewer than three noisy pixels in the level2.evt file, extra rows are filled as -1
| Pixel properties | Quadrant properties | ||||||
|---|---|---|---|---|---|---|---|
| Quadrant | DetID | PixID | Counts | Sigma | Mean | Median | Sigma |
| A | 15 | 32 | 987788 | 6136.74 | 645 | 629 | 160.9 |
| A | 0 | 8 | 296115 | 1836.91 | 645 | 629 | 160.9 |
| A | 7 | 190 | 169174 | 1047.77 | 645 | 629 | 160.9 |
| B | 10 | 14 | 93480 | 657.64 | 655 | 633 | 141.2 |
| B | 5 | 236 | 65706 | 460.91 | 655 | 633 | 141.2 |
| B | 4 | 81 | 61936 | 434.21 | 655 | 633 | 141.2 |
| C | 13 | 3 | 691000 | 3953.32 | 631 | 625 | 174.6 |
| C | 6 | 223 | 688324 | 3937.99 | 631 | 625 | 174.6 |
| C | 4 | 5 | 278930 | 1593.67 | 631 | 625 | 174.6 |
| D | 15 | 94 | 12976627 | 137865.87 | 326 | 311 | 94.1 |
| D | 11 | 129 | 143038 | 1516.39 | 326 | 311 | 94.1 |
| D | 1 | 31 | 62044 | 655.88 | 326 | 311 | 94.1 |
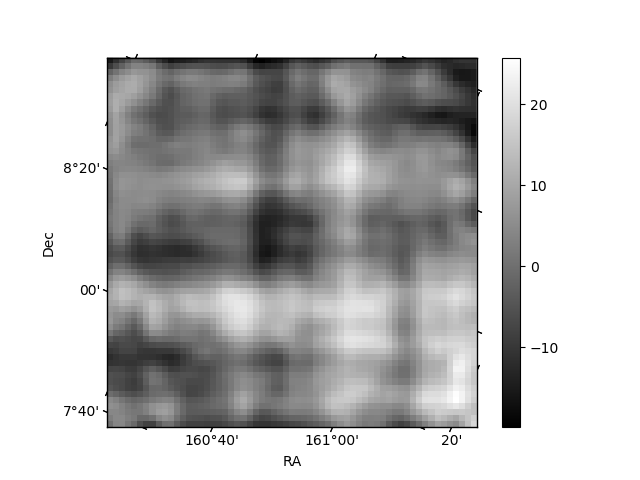
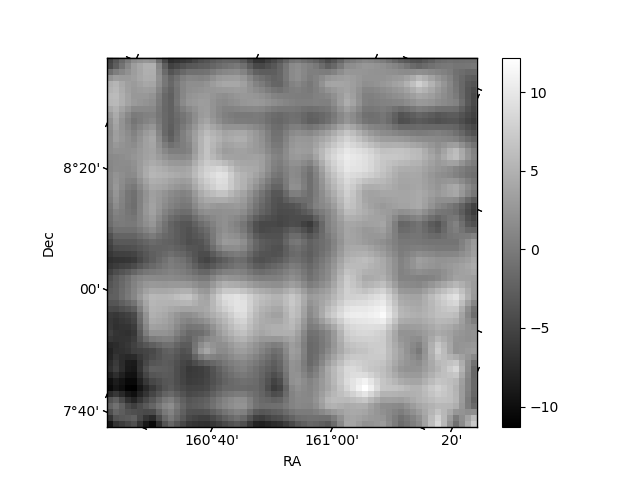
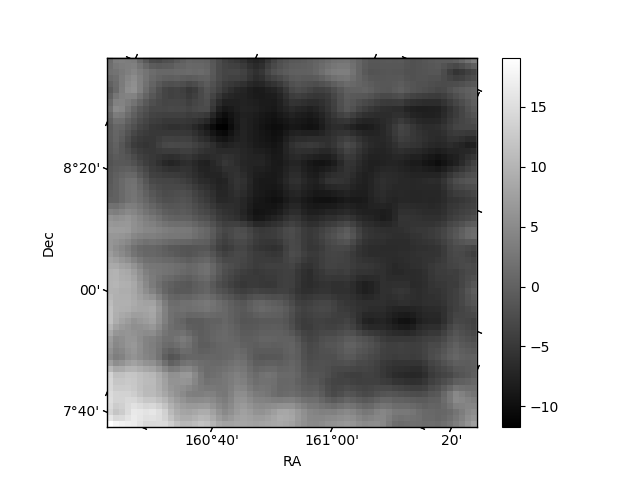
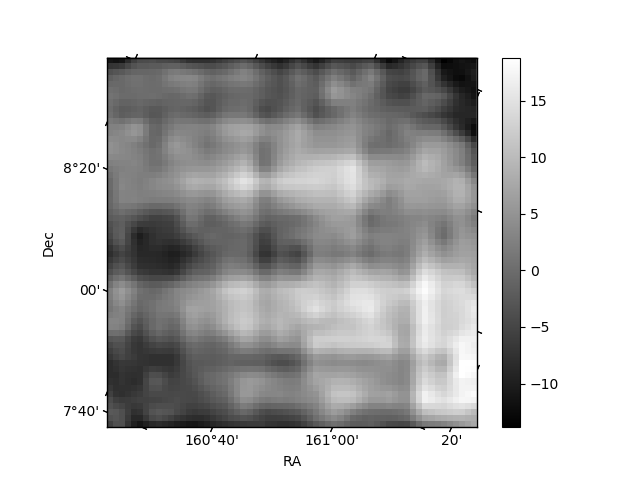
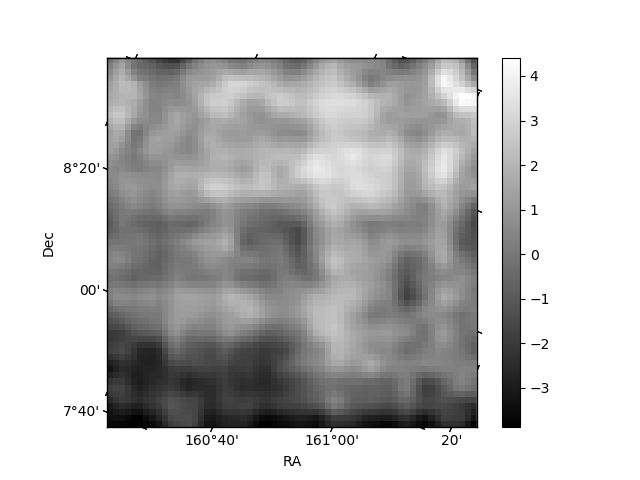
Histogram calculated using DETX and DETY for each event in the final _common_clean file
| Quadrant A | 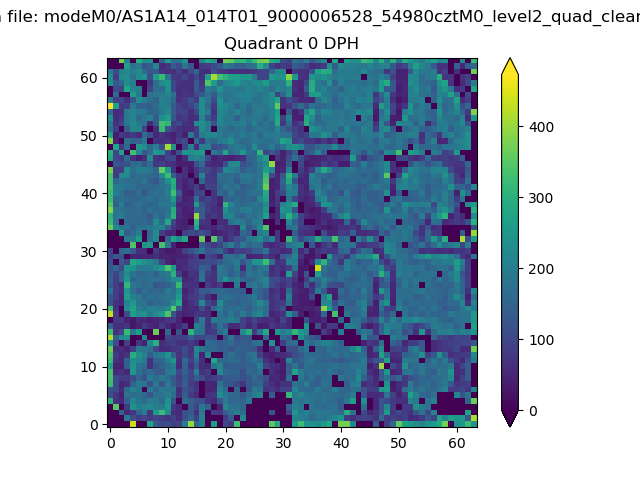 |
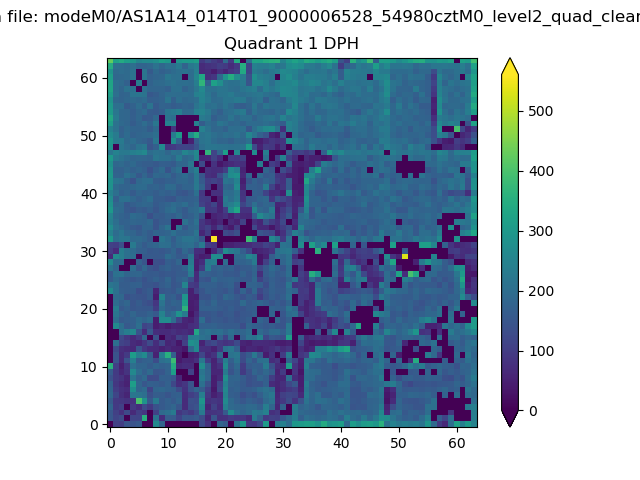 |
Quadrant B |
|---|---|---|---|
| Quadrant D | 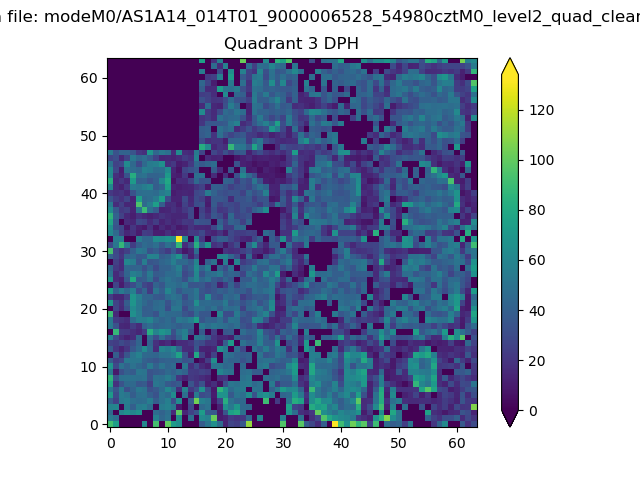 |
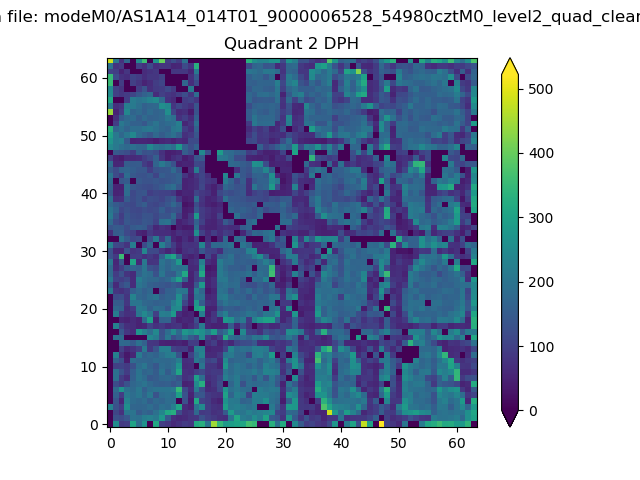 |
Quadrant C |
| Plot type | Count rate plots | Images |
|---|---|---|
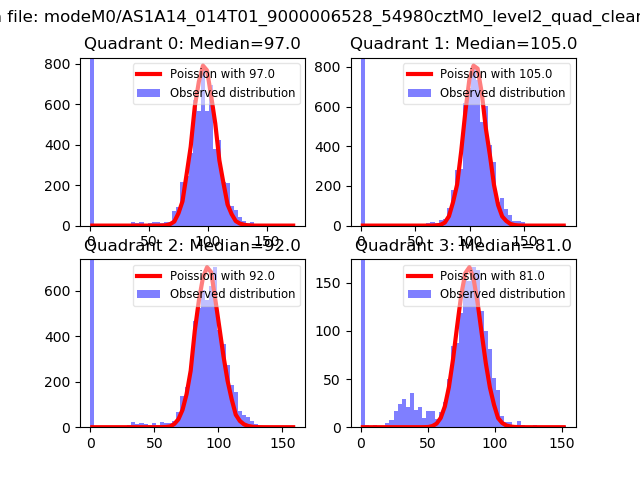
| Comparison with Poisson distribution Blue bars denote a histogram of data divided into 1 sec bins. Red curve is a Poisson curve with rate = median count rate of data. |
 |
 |
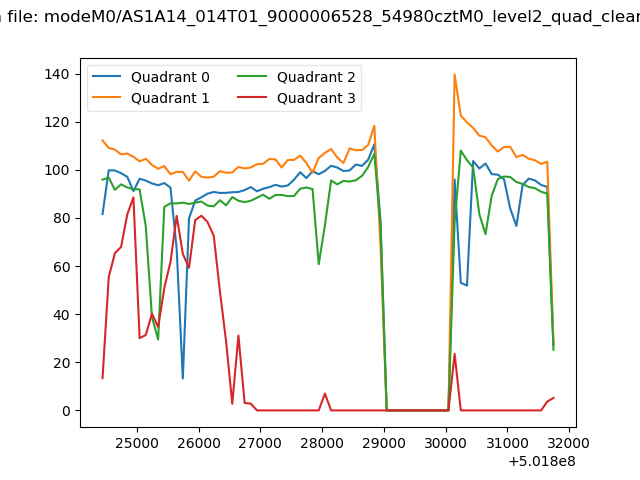
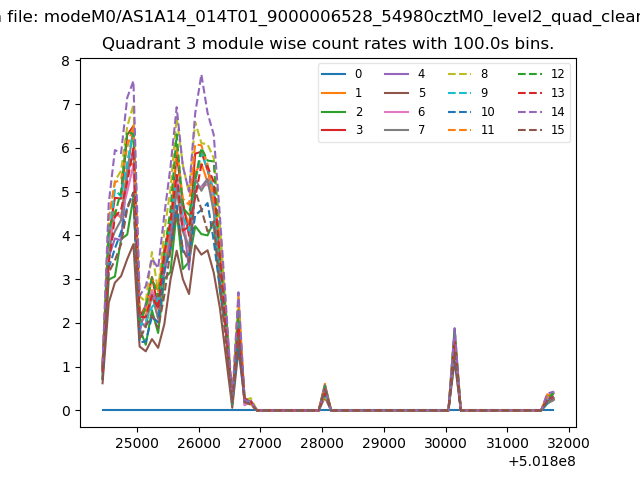
| Quadrant-wise count rates Data is divided into 100 sec bins |
 |
|
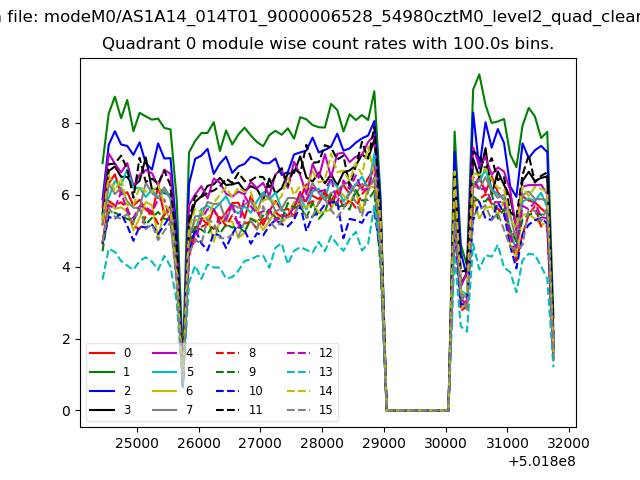
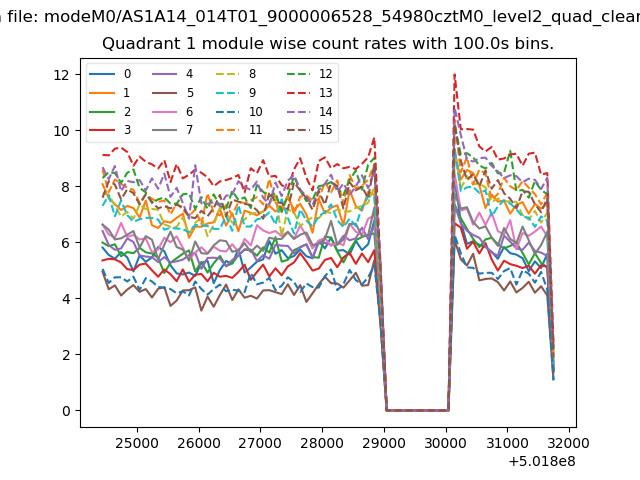
| Module-wise count rates for Quadrant A Data is divided into 100 sec bins |
 |
 |
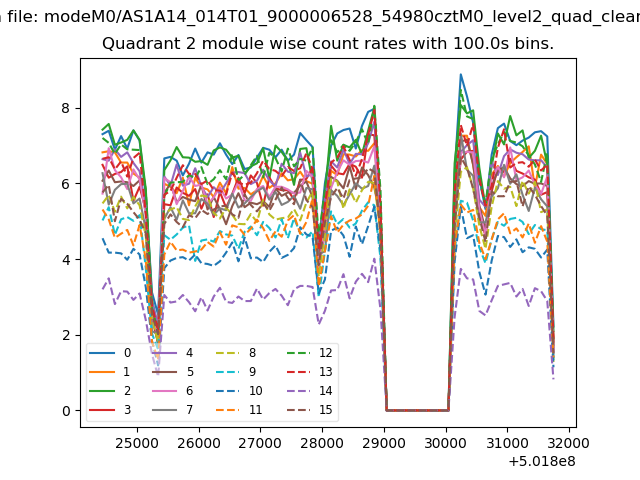
| Module-wise count rates for Quadrant B Data is divided into 100 sec bins |
 |
 |
| Module-wise count rates for Quadrant C Data is divided into 100 sec bins |
 |
 |
| Module-wise count rates for Quadrant D Data is divided into 100 sec bins |
 |
 |
| Parameter | Plot |
|---|---|
| CZT HV Monitor | 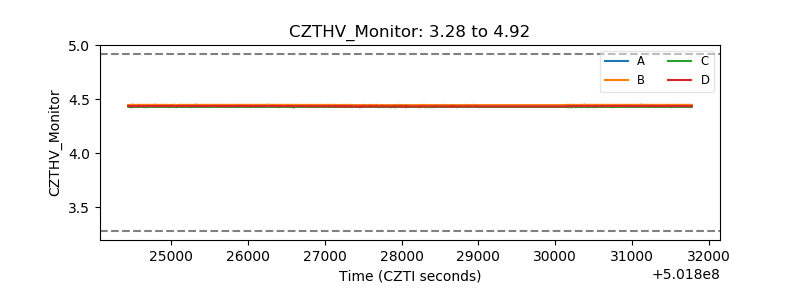 |
| D_VDD | 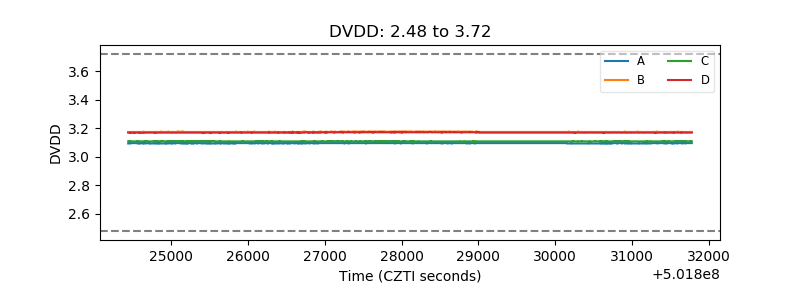 |
| Temperature 1 | 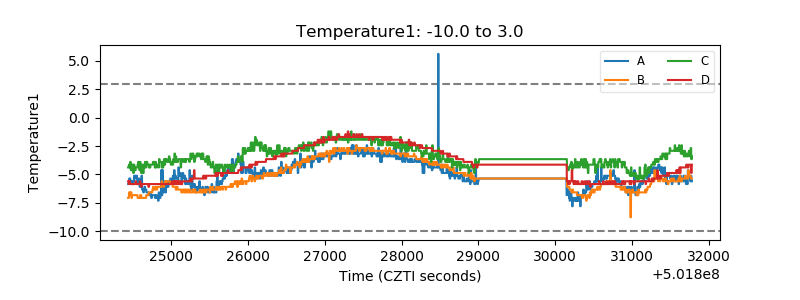 |
| Veto HV Monitor | 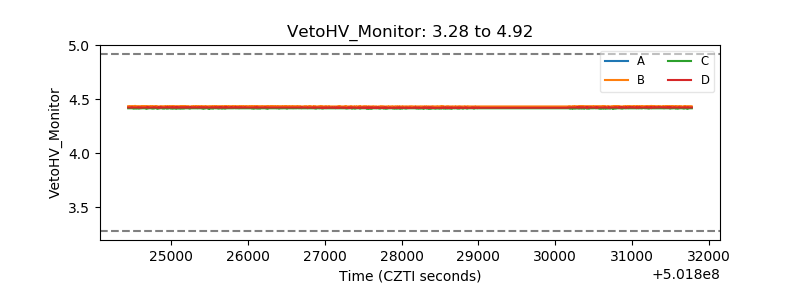 |
| Veto LLD | 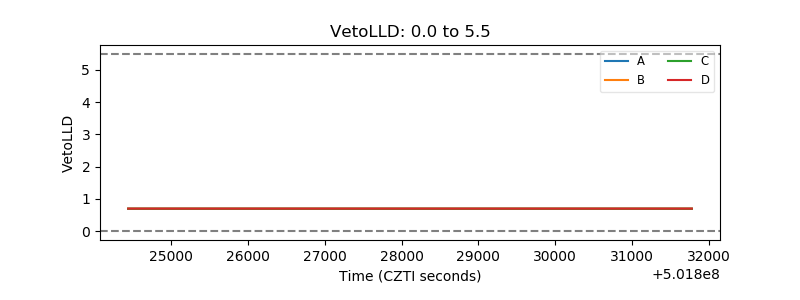 |
| Alpha Counter | 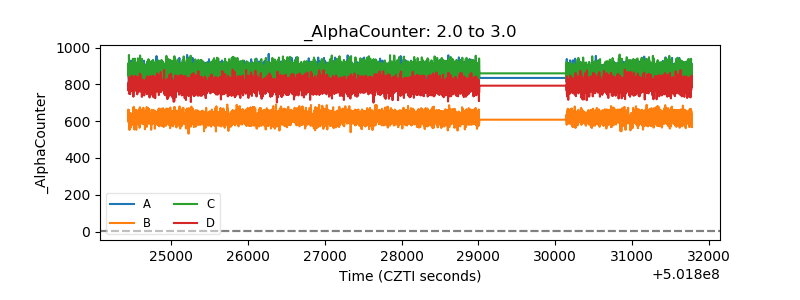 |
| _CPM_Rate | 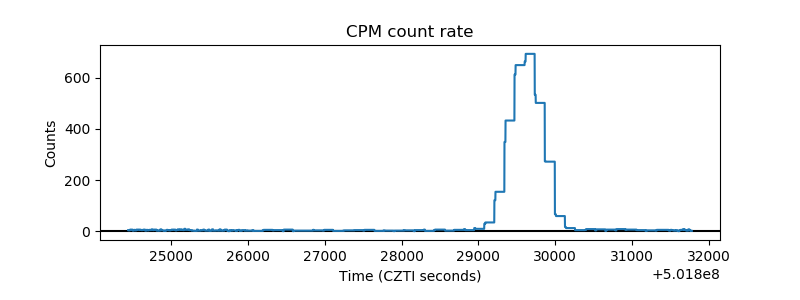 |
| CZT Counter | 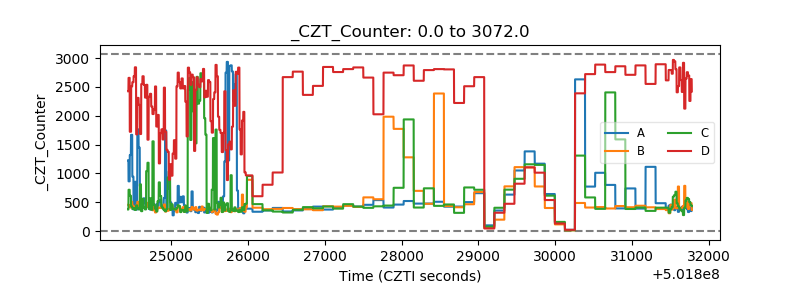 |
| +2.5 Volts monitor |  |
| +5 Volts monitor |  |
| _ROLL_ROT | 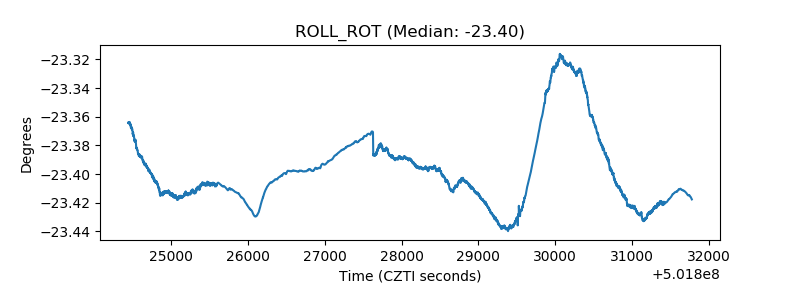 |
| _Roll_DEC | 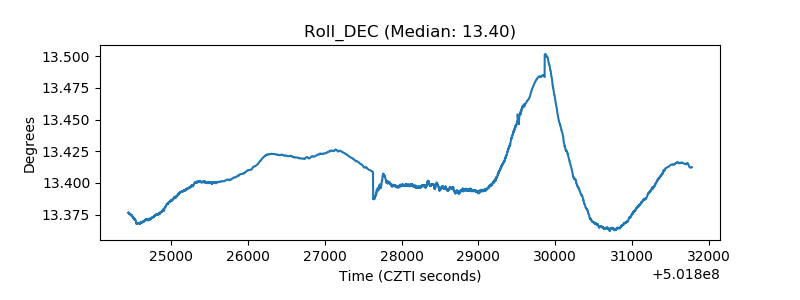 |
| _Roll_RA | 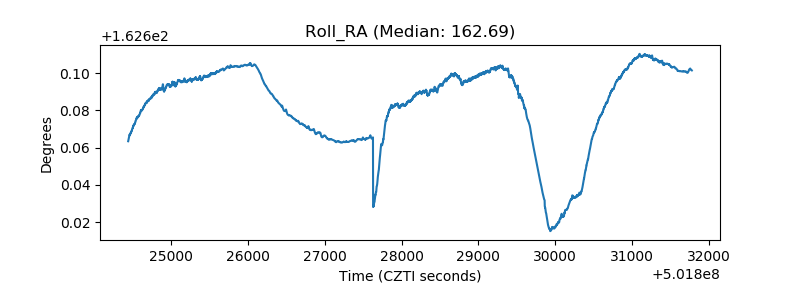 |
| Veto Counter | 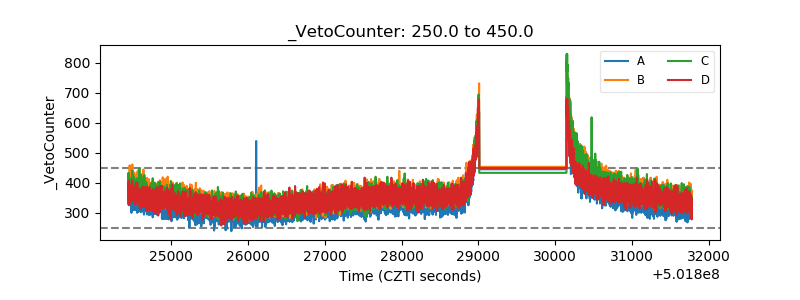 |