| Param | Original file | Final file |
|---|---|---|
| Filename | modeM0/AS1A14_014T01_9000006528_54981cztM0_level2.fits | modeM0/AS1A14_014T01_9000006528_54981cztM0_level2_quad_clean.evt |
| Size (bytes) | 672,408,000 | 68,653,440 |
| Size | 641.3 MB | 65.5 MB |
| Events in quadrant A | 2,924,709 | 550,794 |
| Events in quadrant B | 3,668,851 | 587,376 |
| Events in quadrant C | 2,904,480 | 530,837 |
| Events in quadrant D | 14,950,834 | 12,949 |
| Mode M0 | |||
|---|---|---|---|
| Quadrant | BADHDUFLAG | Total packets | Discarded packets |
| A | 0 | 13128 | 239 |
| B | 0 | 15091 | 136 |
| C | 0 | 12769 | 116 |
| D | 0 | 49014 | 712 |
| Mode SS | |||
|---|---|---|---|
| Quadrant | BADHDUFLAG | Total packets | Discarded packets |
| A | 0 | 116 | 0 |
| B | 0 | 116 | 0 |
| C | 0 | 116 | 0 |
| D | 0 | 116 | 0 |
| Mode M9 | |||
|---|---|---|---|
| Quadrant | BADHDUFLAG | Total packets | Discarded packets |
| A | 0 | 11 | 0 |
| B | 0 | 11 | 0 |
| C | 0 | 11 | 0 |
| D | 0 | 11 | 0 |
| Quadrant | Total seconds | Saturated seconds | Saturation percentage |
|---|---|---|---|
| A | 5669 | 126 | 2.222614% |
| B | 5675 | 221 | 3.894273% |
| C | 5684 | 76 | 1.337087% |
| D | 5656 | 5542 | 97.984441% |
Noise dominated data is calculated using 1-second bins in cleaned event files. If a bin has >2000 counts, and if more than 50% of those come from <1% of pixels, then it is considered to be noise-dominated and hence unusable.
| Quadrant | # 1 sec bins | Bins with >0 counts | Bins with >2000 counts | High rate bins dominated by noise | Noise dominated (total time) | Noise dominated (detector-on time) | Marked lightcurve |
|---|---|---|---|---|---|---|---|
| A | 6834 | 5683 | 71 | 71 | 1.04% | 1.25% | 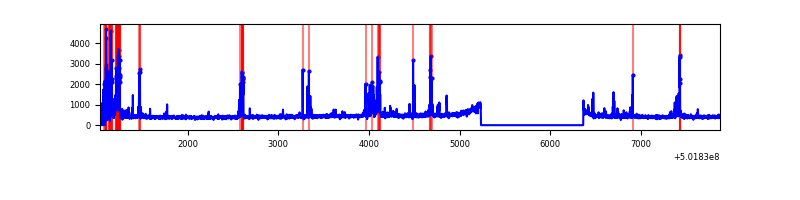 |
| B | 6823 | 5687 | 95 | 95 | 1.39% | 1.67% | 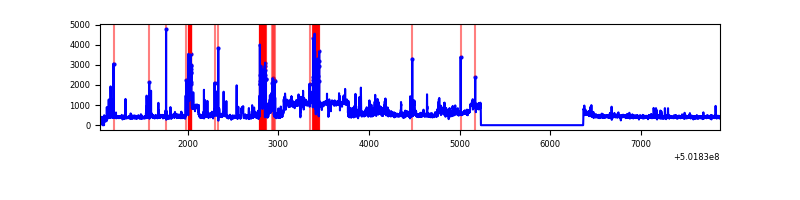 |
| C | 6843 | 5697 | 56 | 56 | 0.82% | 0.98% | 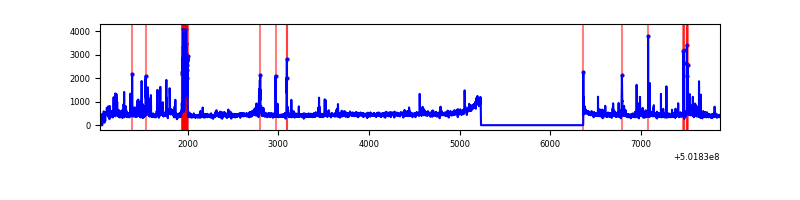 |
| D | 6814 | 5659 | 5451 | 5451 | 80.00% | 96.32% | 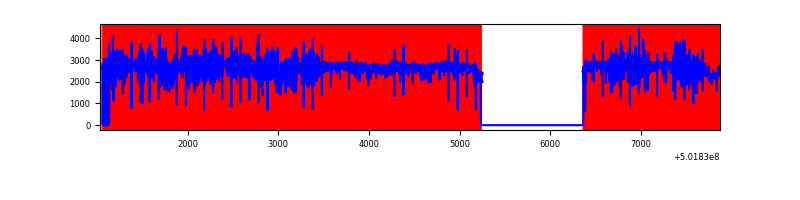 |
Top three noisy pixels from each quadrant. If the there are fewer than three noisy pixels in the level2.evt file, extra rows are filled as -1
| Pixel properties | Quadrant properties | ||||||
|---|---|---|---|---|---|---|---|
| Quadrant | DetID | PixID | Counts | Sigma | Mean | Median | Sigma |
| A | 0 | 8 | 247916 | 1605.26 | 622 | 606 | 154.1 |
| A | 13 | 248 | 169729 | 1097.76 | 622 | 606 | 154.1 |
| A | 15 | 32 | 54639 | 350.72 | 622 | 606 | 154.1 |
| B | 5 | 236 | 605156 | 4600.29 | 610 | 588 | 131.4 |
| B | 0 | 183 | 554867 | 4217.63 | 610 | 588 | 131.4 |
| B | 10 | 245 | 31335 | 233.96 | 610 | 588 | 131.4 |
| C | 13 | 3 | 208463 | 1249.73 | 604 | 600 | 166.3 |
| C | 4 | 5 | 138017 | 826.19 | 604 | 600 | 166.3 |
| C | 1 | 16 | 50490 | 299.95 | 604 | 600 | 166.3 |
| D | 15 | 94 | 13639000 | 221115.28 | 212 | 203 | 61.7 |
| D | 2 | 249 | 109099 | 1765.45 | 212 | 203 | 61.7 |
| D | 1 | 31 | 93088 | 1505.87 | 212 | 203 | 61.7 |
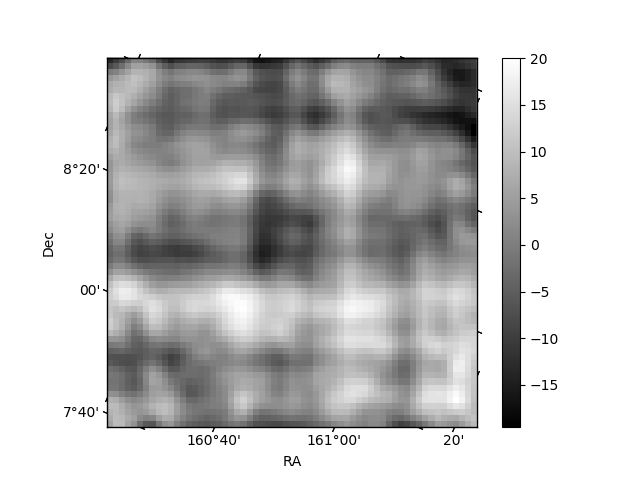
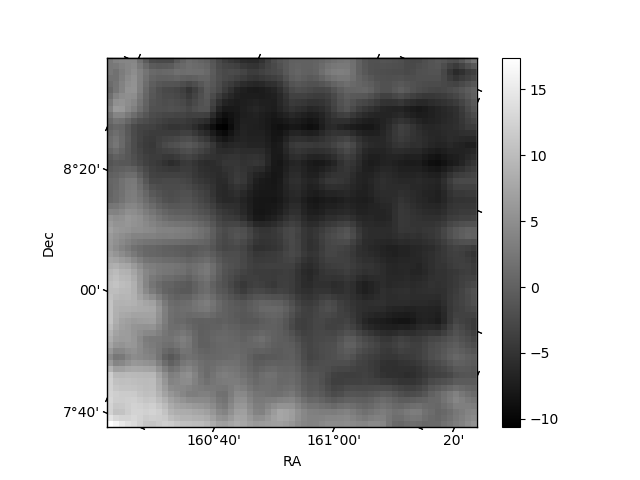
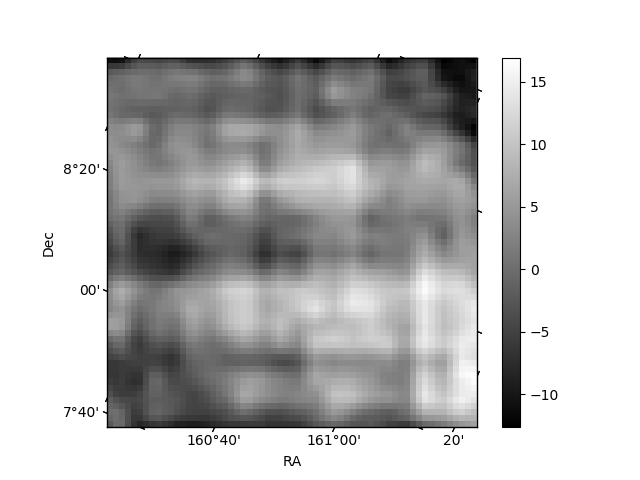
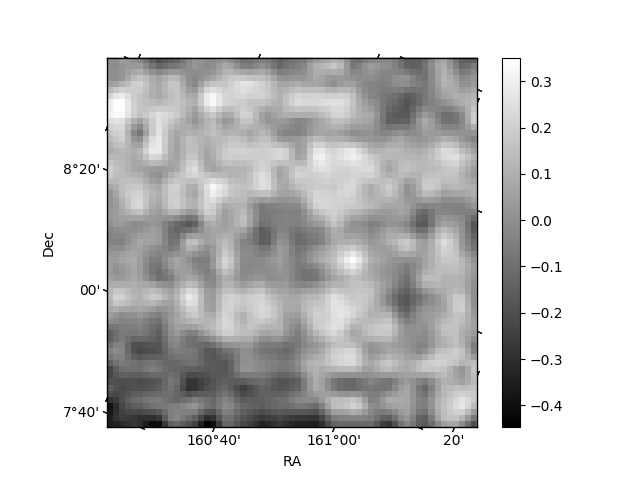
Histogram calculated using DETX and DETY for each event in the final _common_clean file
| Quadrant A | 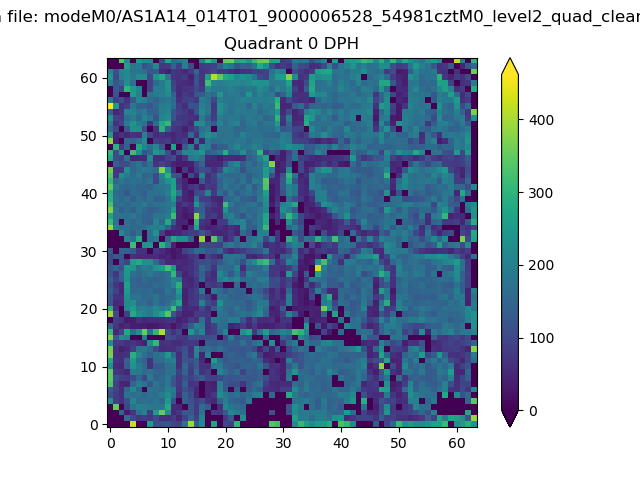 |
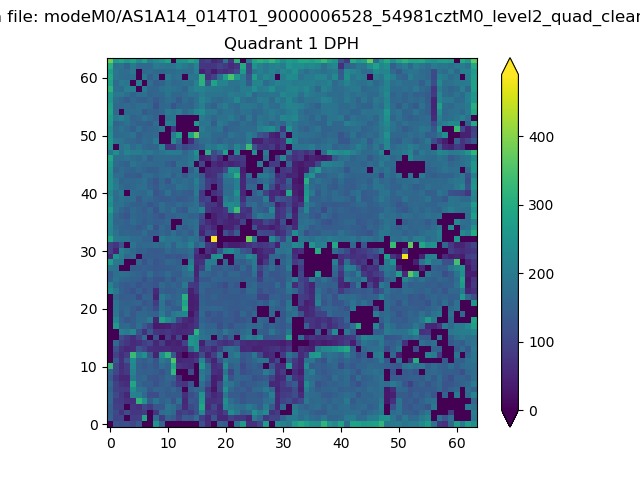 |
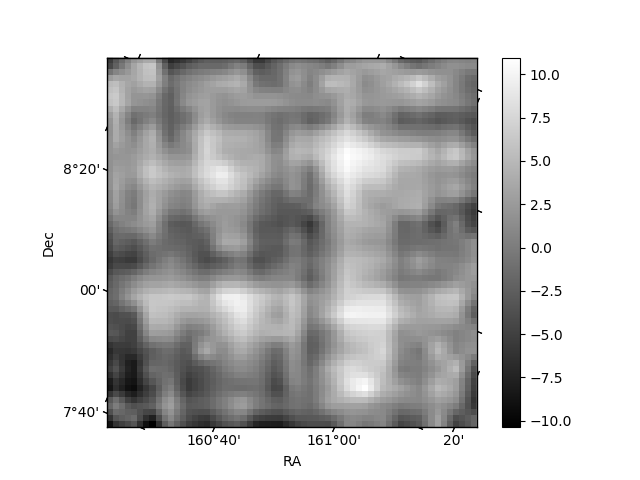
Quadrant B |
|---|---|---|---|
| Quadrant D | 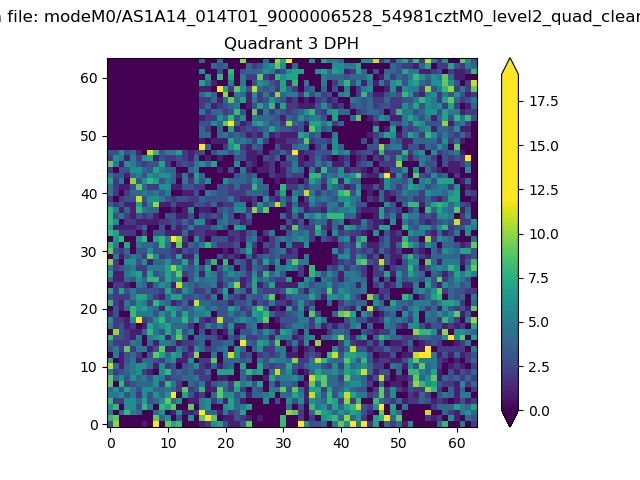 |
 |
Quadrant C |
| Plot type | Count rate plots | Images |
|---|---|---|
| Comparison with Poisson distribution Blue bars denote a histogram of data divided into 1 sec bins. Red curve is a Poisson curve with rate = median count rate of data. |
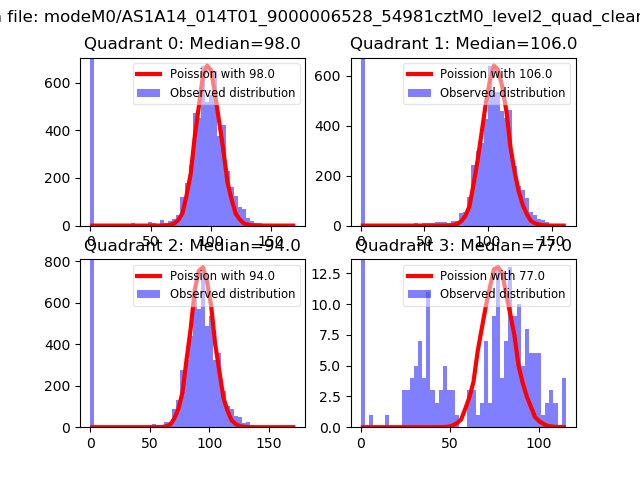 |
 |
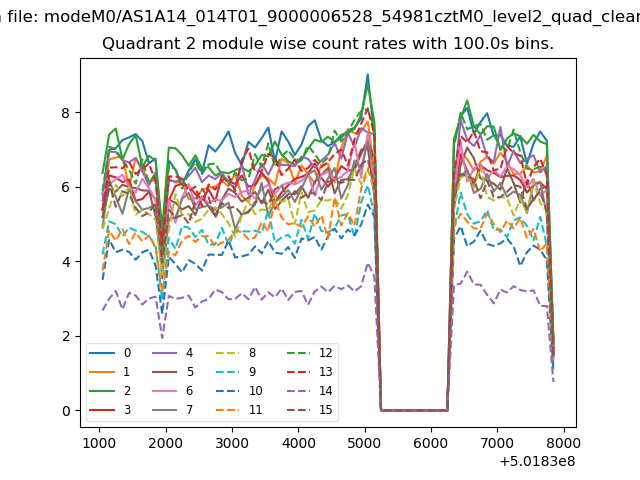
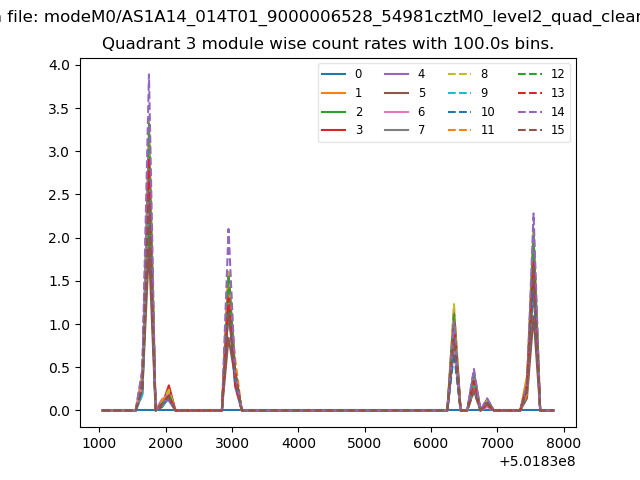
| Quadrant-wise count rates Data is divided into 100 sec bins |
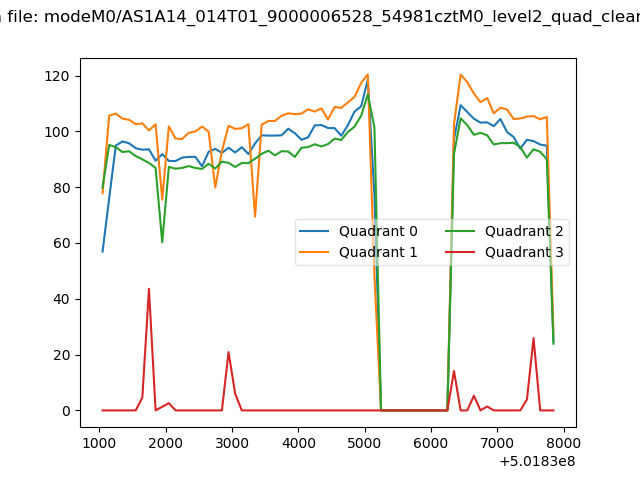 |
|
| Module-wise count rates for Quadrant A Data is divided into 100 sec bins |
 |
 |
| Module-wise count rates for Quadrant B Data is divided into 100 sec bins |
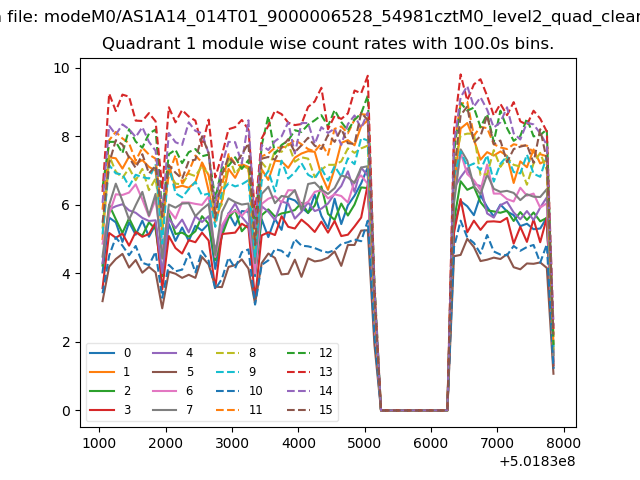 |
 |
| Module-wise count rates for Quadrant C Data is divided into 100 sec bins |
 |
 |
| Module-wise count rates for Quadrant D Data is divided into 100 sec bins |
 |
 |
| Parameter | Plot |
|---|---|
| CZT HV Monitor | 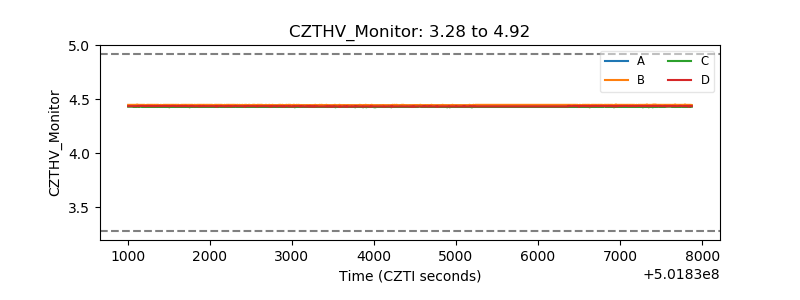 |
| D_VDD | 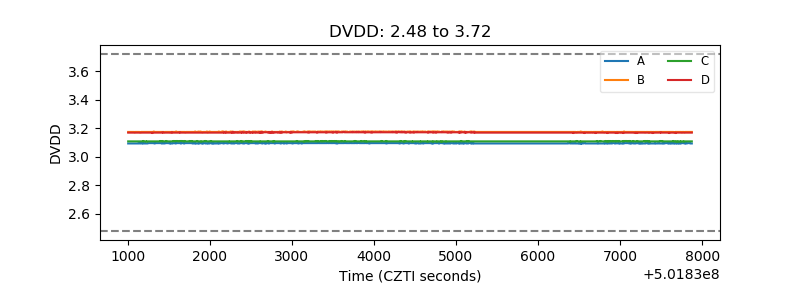 |
| Temperature 1 | 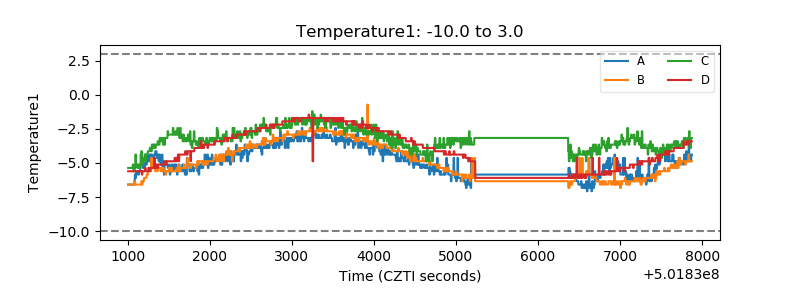 |
| Veto HV Monitor | 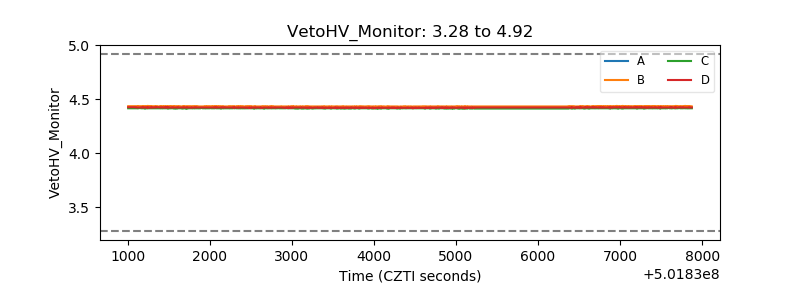 |
| Veto LLD | 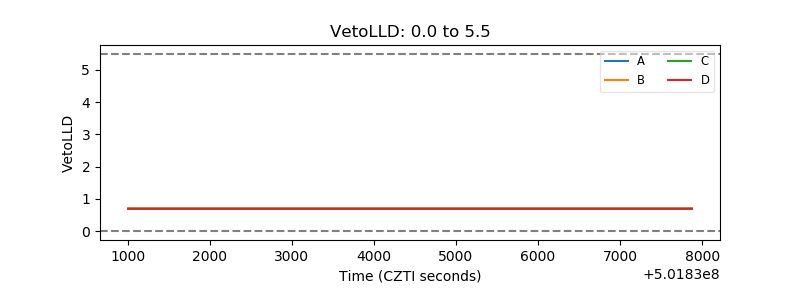 |
| Alpha Counter | 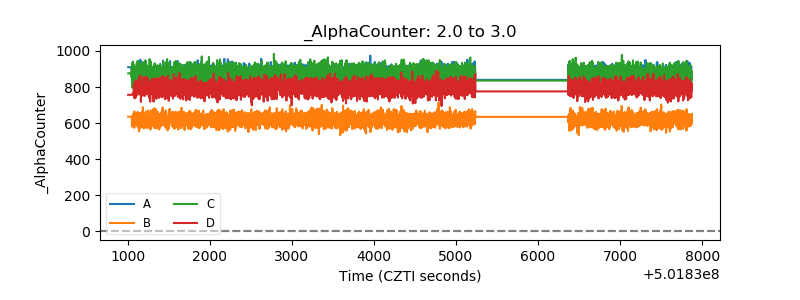 |
| _CPM_Rate | 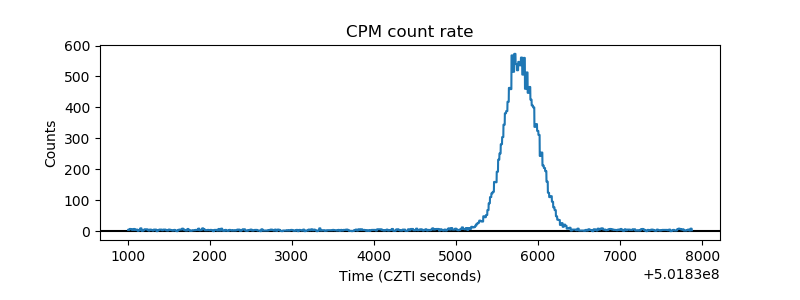 |
| CZT Counter |  |
| +2.5 Volts monitor | 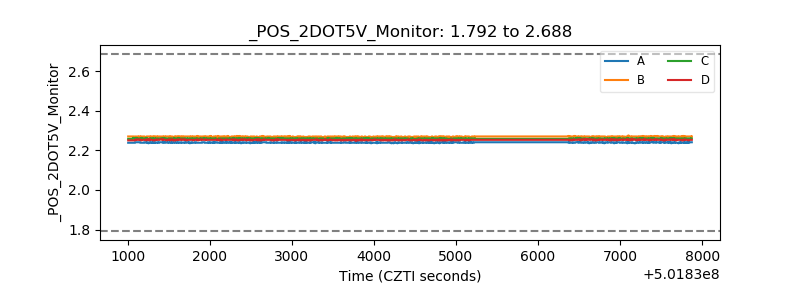 |
| +5 Volts monitor | 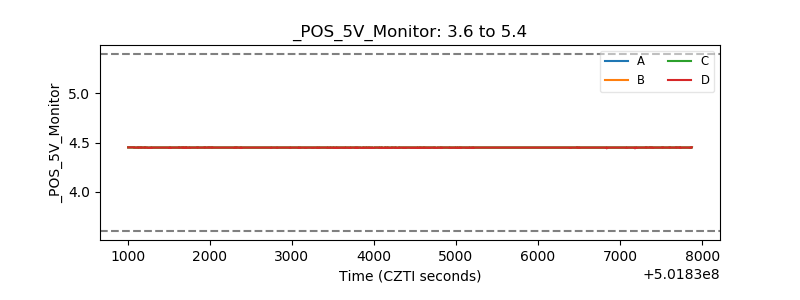 |
| _ROLL_ROT | 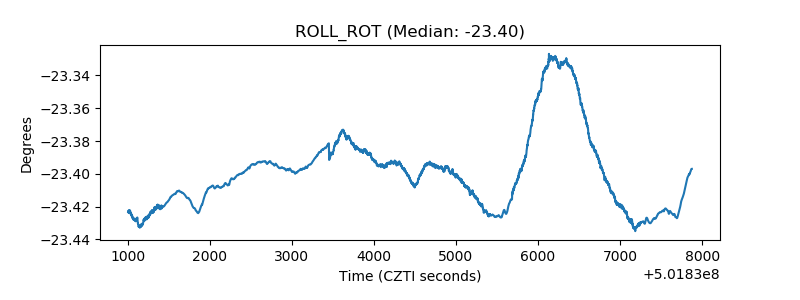 |
| _Roll_DEC | 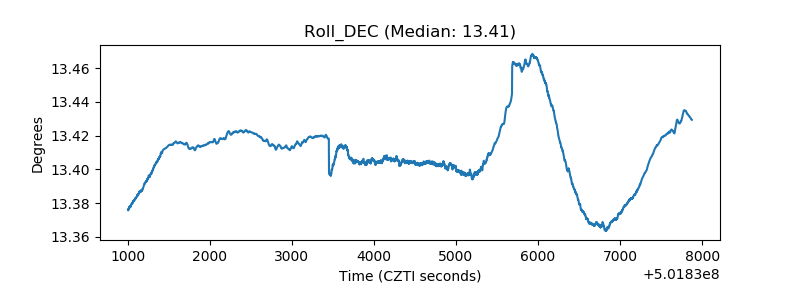 |
| _Roll_RA | 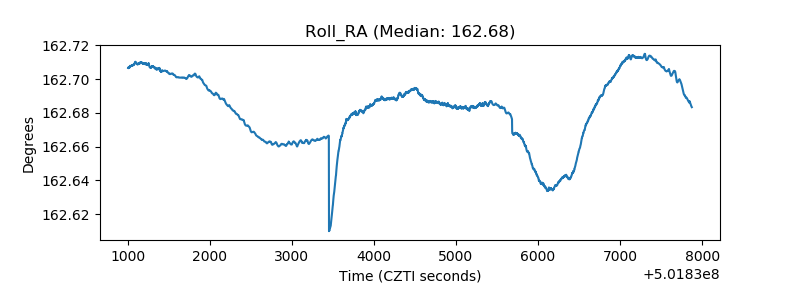 |
| Veto Counter | 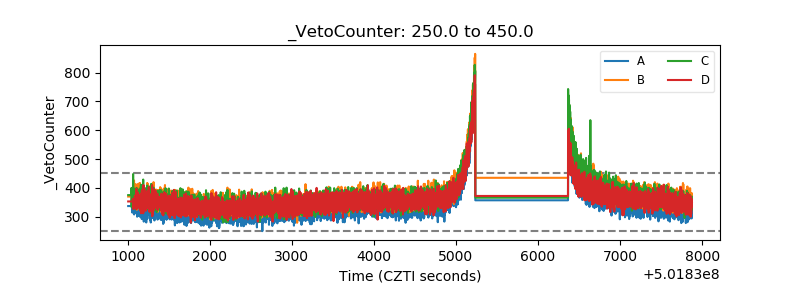 |