| Param | Original file | Final file |
|---|---|---|
| Filename | modeM0/AS1A14_014T01_9000006528_54982cztM0_level2.fits | modeM0/AS1A14_014T01_9000006528_54982cztM0_level2_quad_clean.evt |
| Size (bytes) | 797,906,880 | 75,787,200 |
| Size | 760.9 MB | 72.3 MB |
| Events in quadrant A | 4,006,649 | 595,021 |
| Events in quadrant B | 4,503,284 | 628,837 |
| Events in quadrant C | 3,394,130 | 607,368 |
| Events in quadrant D | 17,123,053 | 7,013 |
| Mode M0 | |||
|---|---|---|---|
| Quadrant | BADHDUFLAG | Total packets | Discarded packets |
| A | 0 | 16768 | 3 |
| B | 0 | 18013 | 3 |
| C | 0 | 14868 | 3 |
| D | 0 | 55354 | 3 |
| Mode SS | |||
|---|---|---|---|
| Quadrant | BADHDUFLAG | Total packets | Discarded packets |
| A | 0 | 134 | 0 |
| B | 0 | 134 | 0 |
| C | 0 | 134 | 0 |
| D | 0 | 134 | 0 |
| Mode M9 | |||
|---|---|---|---|
| Quadrant | BADHDUFLAG | Total packets | Discarded packets |
| A | 0 | 11 | 0 |
| B | 0 | 11 | 0 |
| C | 0 | 12 | 0 |
| D | 0 | 12 | 0 |
| Quadrant | Total seconds | Saturated seconds | Saturation percentage |
|---|---|---|---|
| A | 6542 | 487 | 7.444207% |
| B | 6542 | 635 | 9.706512% |
| C | 6542 | 129 | 1.971874% |
| D | 6542 | 6487 | 99.159279% |
Noise dominated data is calculated using 1-second bins in cleaned event files. If a bin has >2000 counts, and if more than 50% of those come from <1% of pixels, then it is considered to be noise-dominated and hence unusable.
| Quadrant | # 1 sec bins | Bins with >0 counts | Bins with >2000 counts | High rate bins dominated by noise | Noise dominated (total time) | Noise dominated (detector-on time) | Marked lightcurve |
|---|---|---|---|---|---|---|---|
| A | 7602 | 6544 | 277 | 277 | 3.64% | 4.23% | 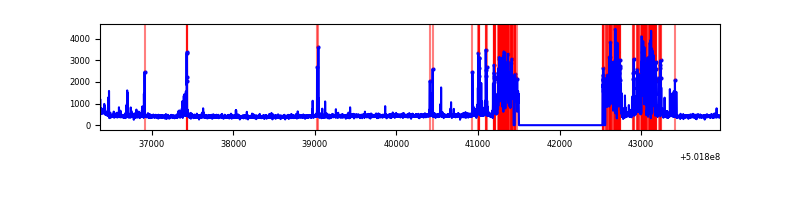 |
| B | 7602 | 6543 | 545 | 545 | 7.17% | 8.33% | 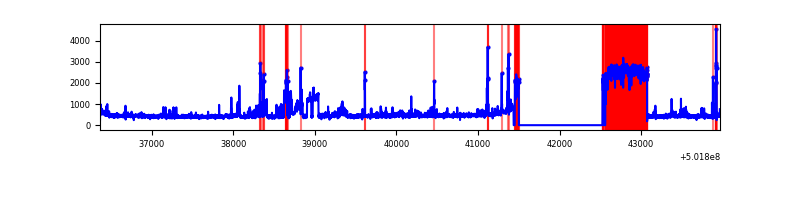 |
| C | 7602 | 6545 | 72 | 72 | 0.95% | 1.10% | 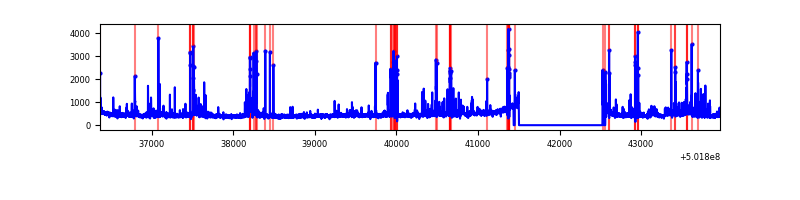 |
| D | 7601 | 6542 | 6359 | 6359 | 83.66% | 97.20% | 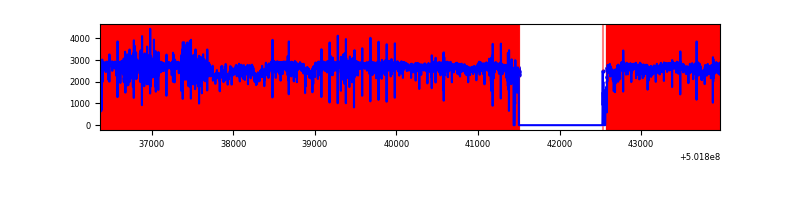 |
Top three noisy pixels from each quadrant. If the there are fewer than three noisy pixels in the level2.evt file, extra rows are filled as -1
| Pixel properties | Quadrant properties | ||||||
|---|---|---|---|---|---|---|---|
| Quadrant | DetID | PixID | Counts | Sigma | Mean | Median | Sigma |
| A | 15 | 32 | 1118537 | 6544.91 | 692 | 676 | 170.8 |
| A | 0 | 8 | 150389 | 876.55 | 692 | 676 | 170.8 |
| A | 4 | 3 | 23391 | 132.99 | 692 | 676 | 170.8 |
| B | 4 | 81 | 1380099 | 9882.35 | 645 | 621 | 139.6 |
| B | 0 | 183 | 267660 | 1913.02 | 645 | 621 | 139.6 |
| B | 5 | 236 | 109669 | 781.2 | 645 | 621 | 139.6 |
| C | 13 | 3 | 153283 | 800.37 | 696 | 690 | 190.7 |
| C | 4 | 5 | 118084 | 615.75 | 696 | 690 | 190.7 |
| C | 1 | 16 | 111750 | 582.53 | 696 | 690 | 190.7 |
| D | 15 | 94 | 16200287 | 333288.23 | 168 | 160 | 48.6 |
| D | 2 | 249 | 74417 | 1527.7 | 168 | 160 | 48.6 |
| D | 11 | 129 | 54350 | 1114.86 | 168 | 160 | 48.6 |
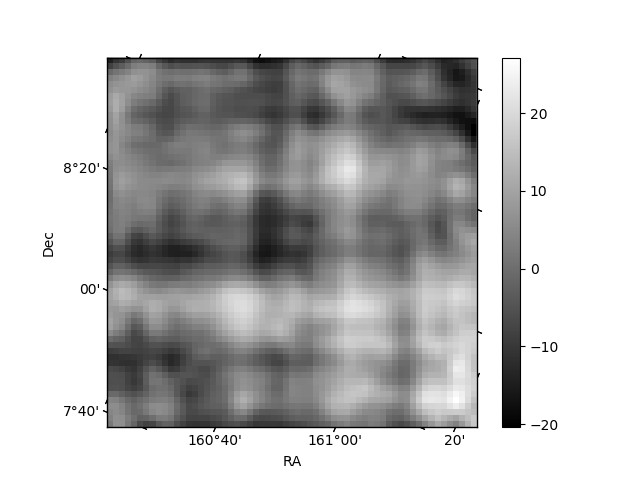
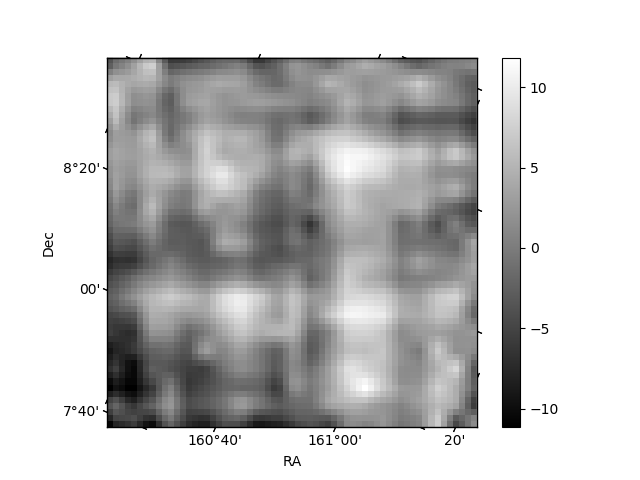
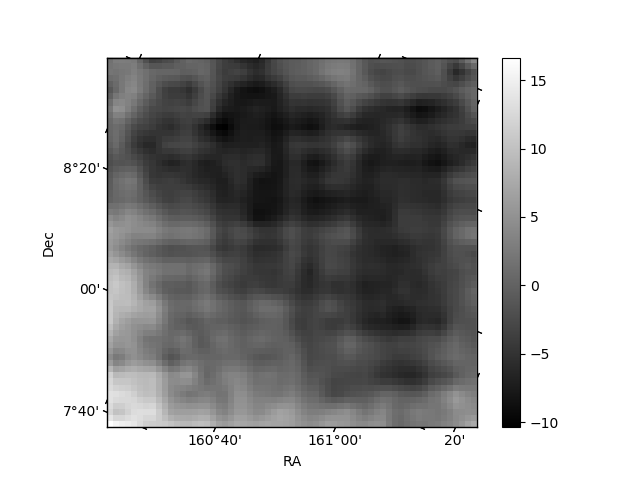
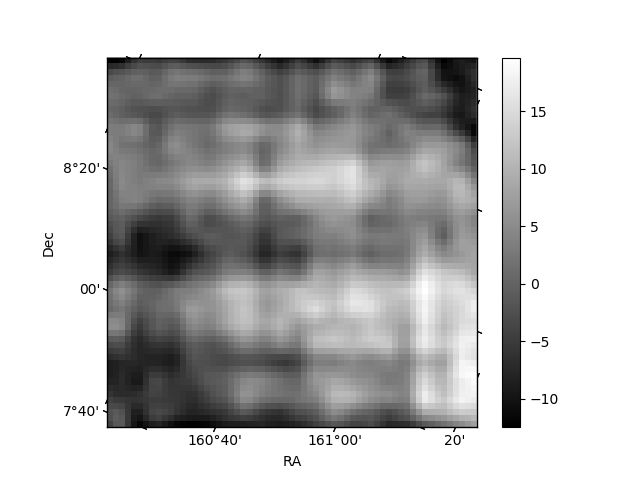
Histogram calculated using DETX and DETY for each event in the final _common_clean file
| Quadrant A | 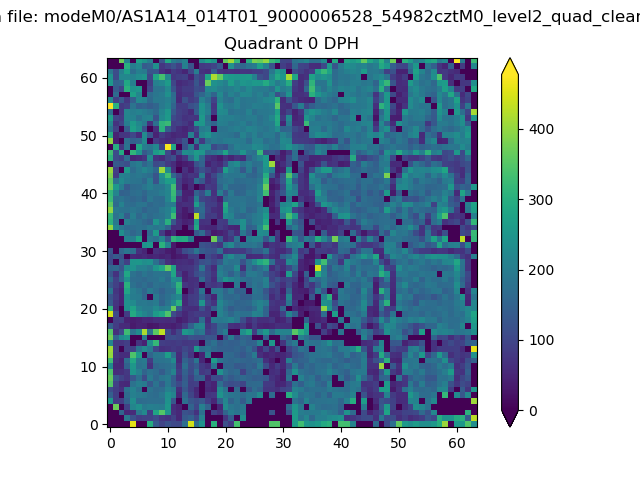 |
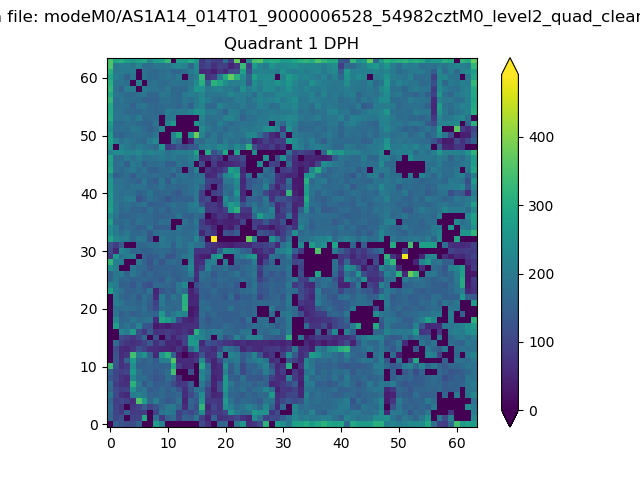 |
Quadrant B |
|---|---|---|---|
| Quadrant D | 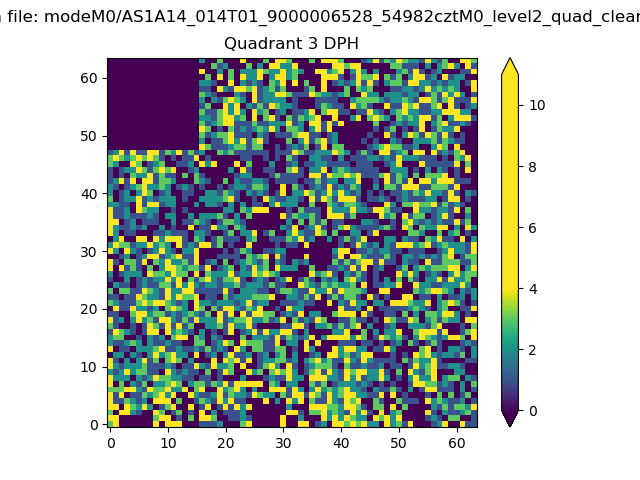 |
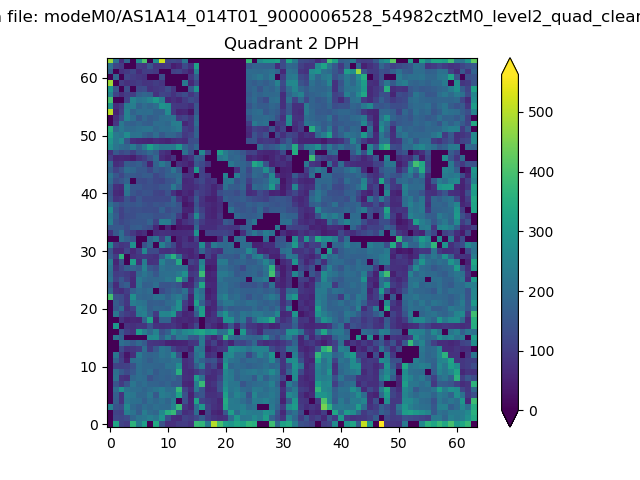 |
Quadrant C |
| Plot type | Count rate plots | Images |
|---|---|---|
| Comparison with Poisson distribution Blue bars denote a histogram of data divided into 1 sec bins. Red curve is a Poisson curve with rate = median count rate of data. |
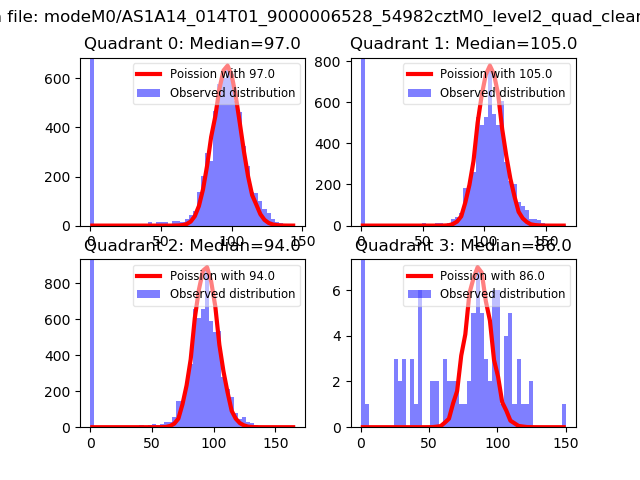 |
 |
| Quadrant-wise count rates Data is divided into 100 sec bins |
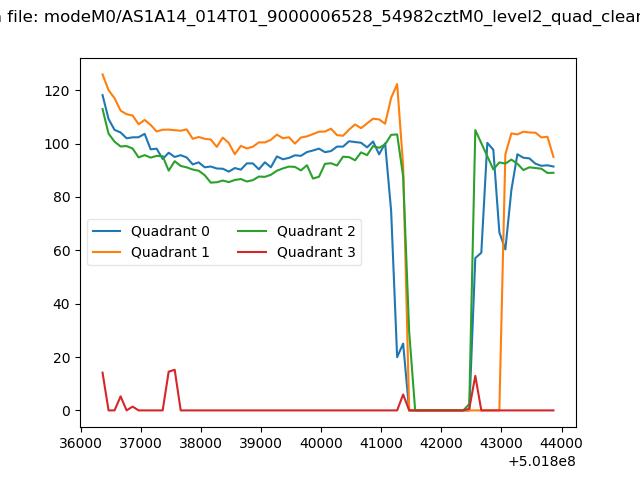 |
|
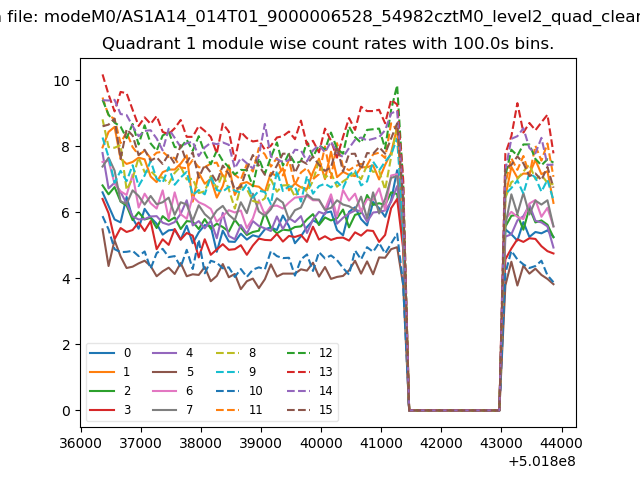
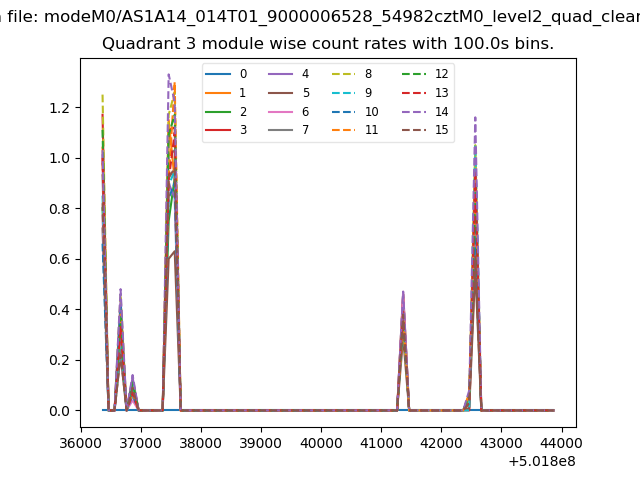
| Module-wise count rates for Quadrant A Data is divided into 100 sec bins |
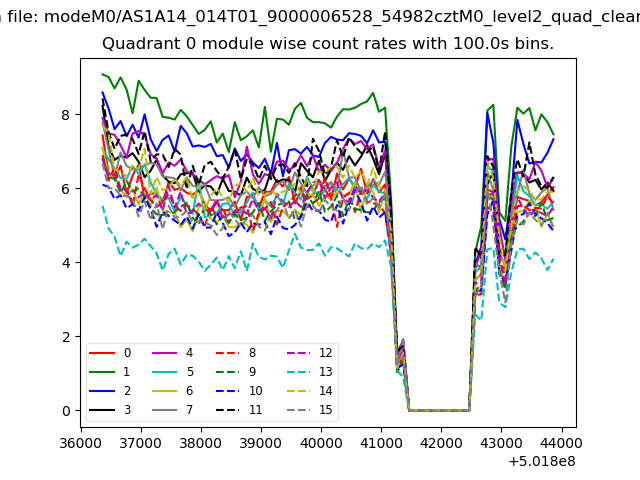 |
 |
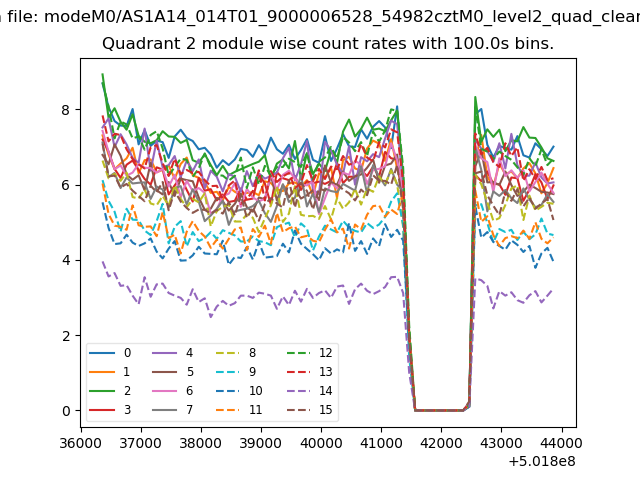
| Module-wise count rates for Quadrant B Data is divided into 100 sec bins |
 |
 |
| Module-wise count rates for Quadrant C Data is divided into 100 sec bins |
 |
 |
| Module-wise count rates for Quadrant D Data is divided into 100 sec bins |
 |
 |
| Parameter | Plot |
|---|---|
| CZT HV Monitor | 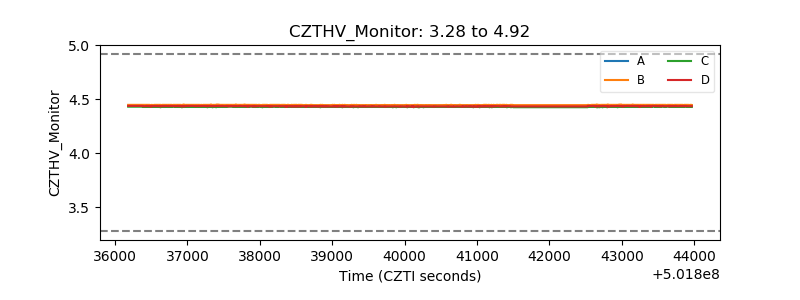 |
| D_VDD | 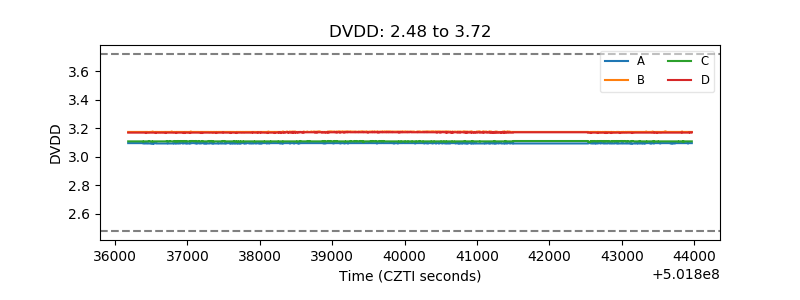 |
| Temperature 1 | 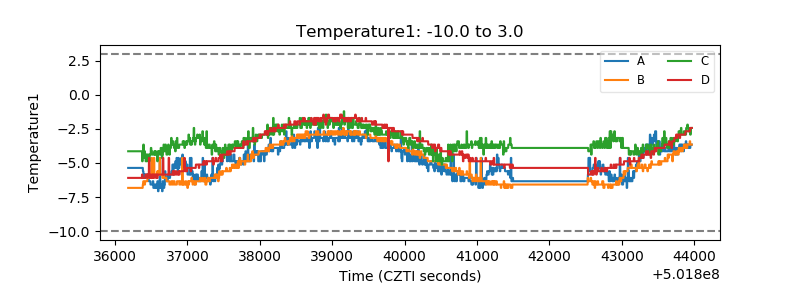 |
| Veto HV Monitor | 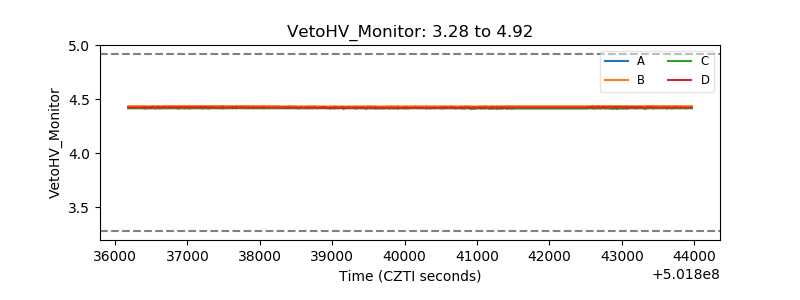 |
| Veto LLD | 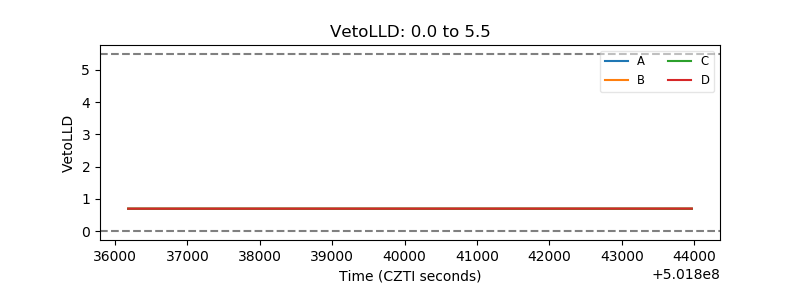 |
| Alpha Counter | 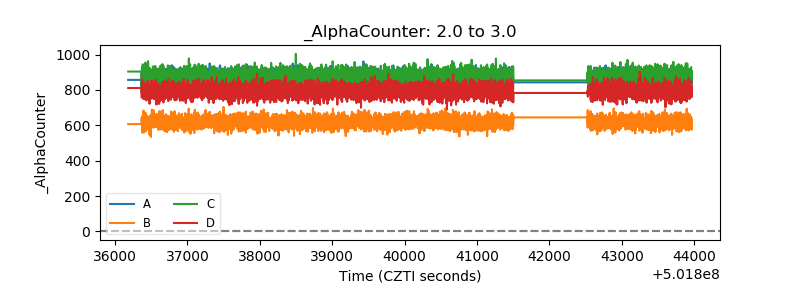 |
| _CPM_Rate | 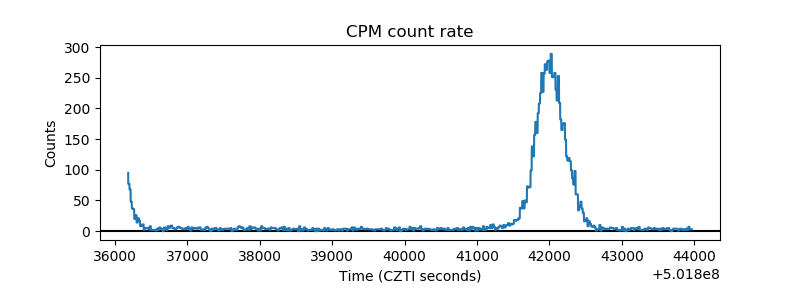 |
| CZT Counter | 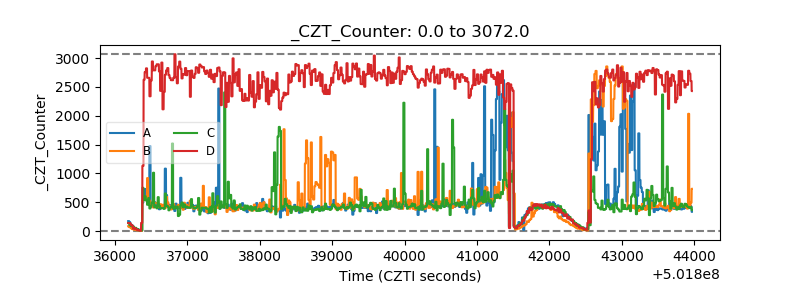 |
| +2.5 Volts monitor |  |
| +5 Volts monitor |  |
| _ROLL_ROT | 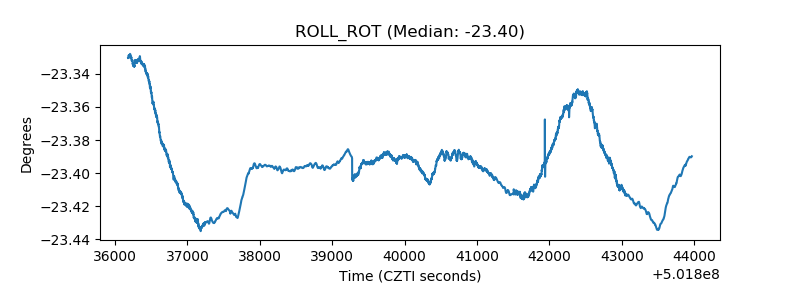 |
| _Roll_DEC | 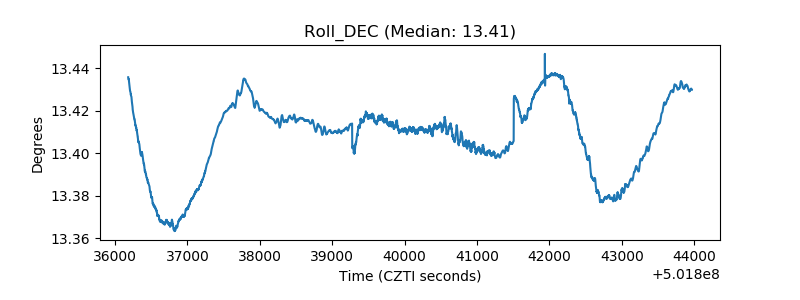 |
| _Roll_RA | 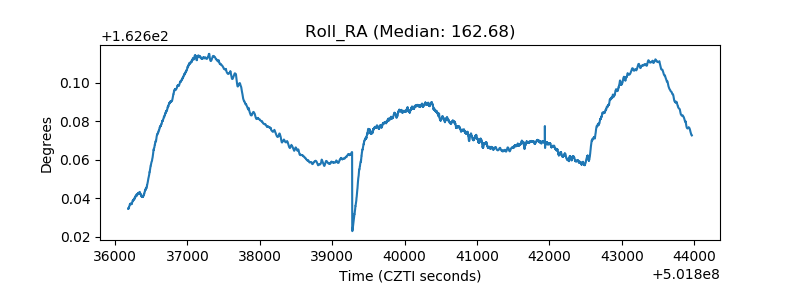 |
| Veto Counter | 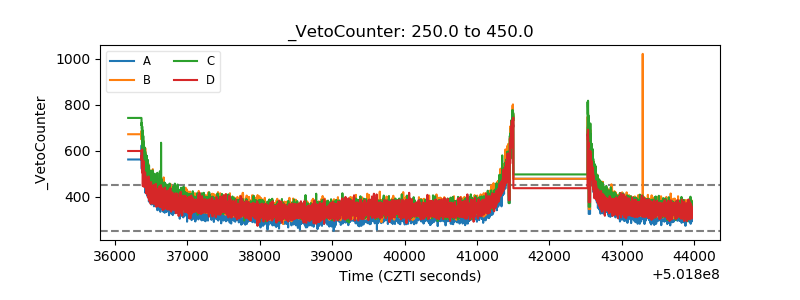 |