| Param | Original file | Final file |
|---|---|---|
| Filename | modeM0/AS1A14_014T01_9000006528_54983cztM0_level2.fits | modeM0/AS1A14_014T01_9000006528_54983cztM0_level2_quad_clean.evt |
| Size (bytes) | 600,992,640 | 64,440,000 |
| Size | 573.2 MB | 61.5 MB |
| Events in quadrant A | 3,898,049 | 453,805 |
| Events in quadrant B | 2,611,117 | 548,834 |
| Events in quadrant C | 2,757,661 | 490,895 |
| Events in quadrant D | 12,558,603 | 78,500 |
| Mode M0 | |||
|---|---|---|---|
| Quadrant | BADHDUFLAG | Total packets | Discarded packets |
| A | 0 | 17252 | 1713 |
| B | 0 | 13543 | 1820 |
| C | 0 | 13105 | 931 |
| D | 0 | 46369 | 5437 |
| Mode SS | |||
|---|---|---|---|
| Quadrant | BADHDUFLAG | Total packets | Discarded packets |
| A | 0 | 122 | 8 |
| B | 0 | 122 | 14 |
| C | 0 | 122 | 8 |
| D | 0 | 122 | 10 |
| Mode M9 | |||
|---|---|---|---|
| Quadrant | BADHDUFLAG | Total packets | Discarded packets |
| A | 0 | 8 | 0 |
| B | 0 | 8 | 0 |
| C | 0 | 8 | 0 |
| D | 0 | 8 | 0 |
| Quadrant | Total seconds | Saturated seconds | Saturation percentage |
|---|---|---|---|
| A | 5462 | 680 | 12.449652% |
| B | 5468 | 174 | 3.182151% |
| C | 5472 | 134 | 2.448830% |
| D | 5232 | 4412 | 84.327217% |
Noise dominated data is calculated using 1-second bins in cleaned event files. If a bin has >2000 counts, and if more than 50% of those come from <1% of pixels, then it is considered to be noise-dominated and hence unusable.
| Quadrant | # 1 sec bins | Bins with >0 counts | Bins with >2000 counts | High rate bins dominated by noise | Noise dominated (total time) | Noise dominated (detector-on time) | Marked lightcurve |
|---|---|---|---|---|---|---|---|
| A | 7289 | 5583 | 412 | 412 | 5.65% | 7.38% | 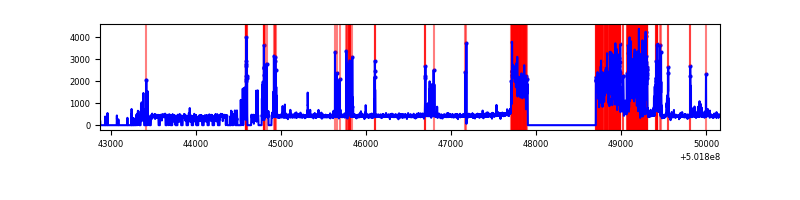 |
| B | 7086 | 5593 | 23 | 23 | 0.32% | 0.41% | 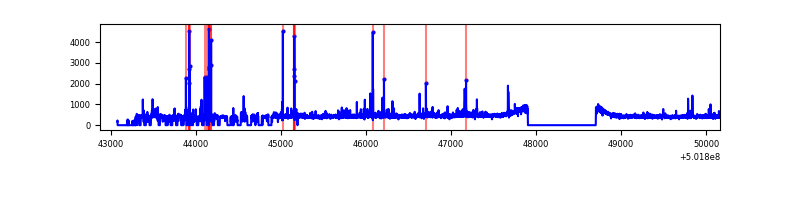 |
| C | 7291 | 5613 | 22 | 22 | 0.30% | 0.39% | 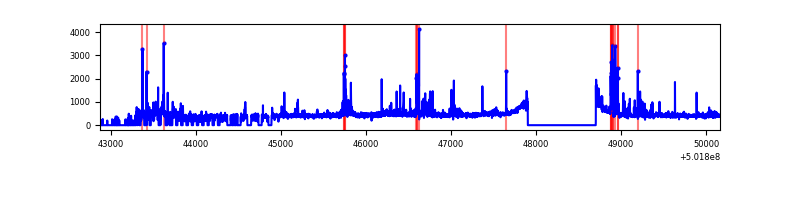 |
| D | 6861 | 5274 | 4239 | 4239 | 61.78% | 80.38% | 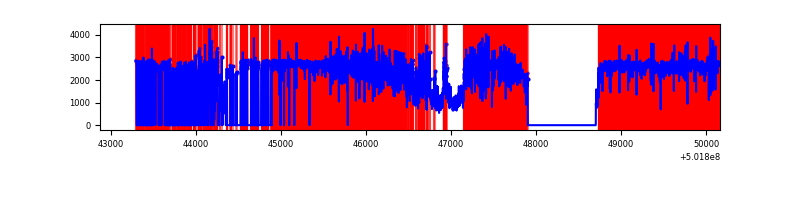 |
Top three noisy pixels from each quadrant. If the there are fewer than three noisy pixels in the level2.evt file, extra rows are filled as -1
| Pixel properties | Quadrant properties | ||||||
|---|---|---|---|---|---|---|---|
| Quadrant | DetID | PixID | Counts | Sigma | Mean | Median | Sigma |
| A | 15 | 32 | 1418493 | 10150.98 | 563 | 549 | 139.7 |
| A | 0 | 8 | 242365 | 1731.15 | 563 | 549 | 139.7 |
| A | 4 | 3 | 20864 | 145.43 | 563 | 549 | 139.7 |
| B | 9 | 251 | 55291 | 420.78 | 598 | 576 | 130.0 |
| B | 10 | 245 | 43615 | 330.98 | 598 | 576 | 130.0 |
| B | 0 | 182 | 38614 | 292.52 | 598 | 576 | 130.0 |
| C | 4 | 5 | 136574 | 835.1 | 594 | 590 | 162.8 |
| C | 6 | 223 | 131200 | 802.1 | 594 | 590 | 162.8 |
| C | 1 | 16 | 43213 | 261.75 | 594 | 590 | 162.8 |
| D | 15 | 94 | 10943381 | 145522.82 | 261 | 249 | 75.2 |
| D | 15 | 46 | 167392 | 2222.68 | 261 | 249 | 75.2 |
| D | 2 | 249 | 128733 | 1708.59 | 261 | 249 | 75.2 |
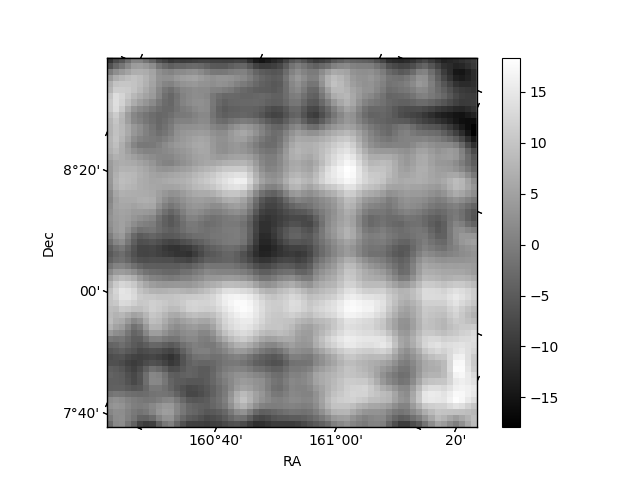
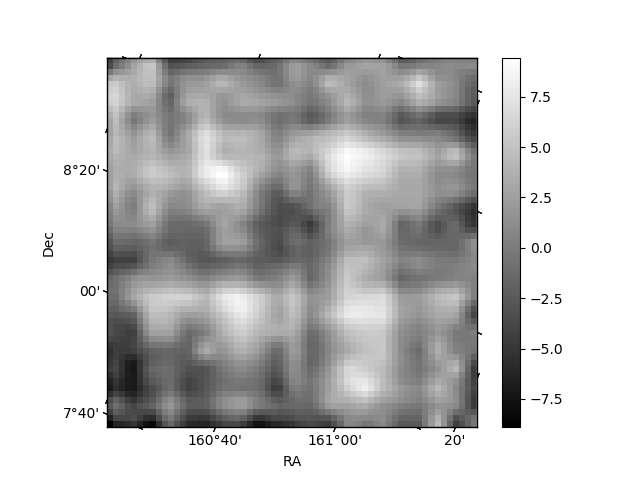
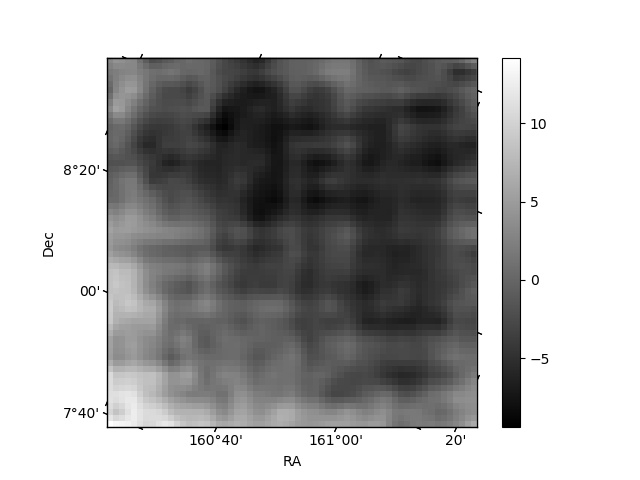
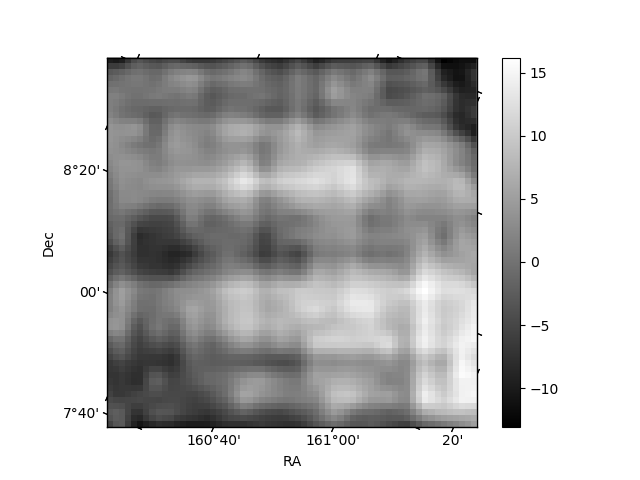
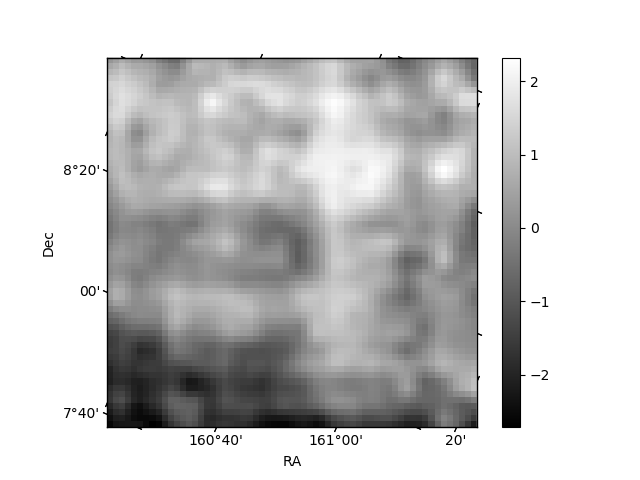
Histogram calculated using DETX and DETY for each event in the final _common_clean file
| Quadrant A | 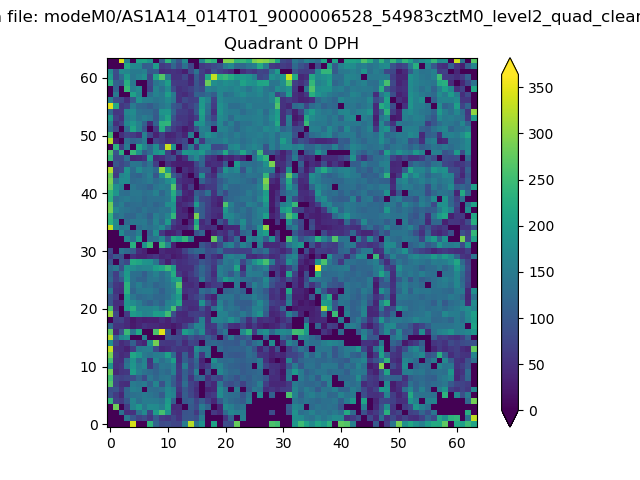 |
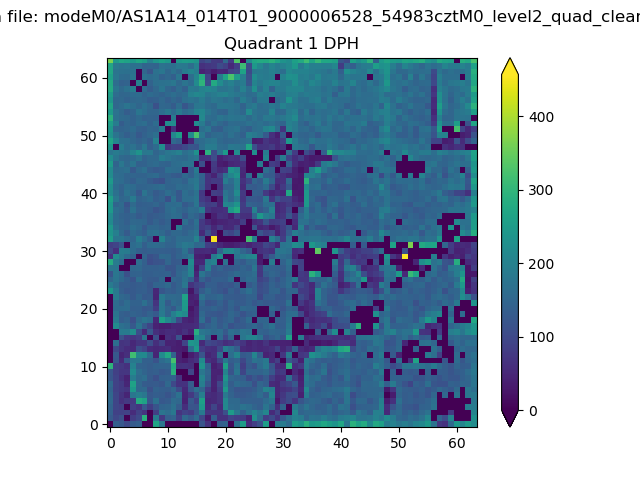 |
Quadrant B |
|---|---|---|---|
| Quadrant D |  |
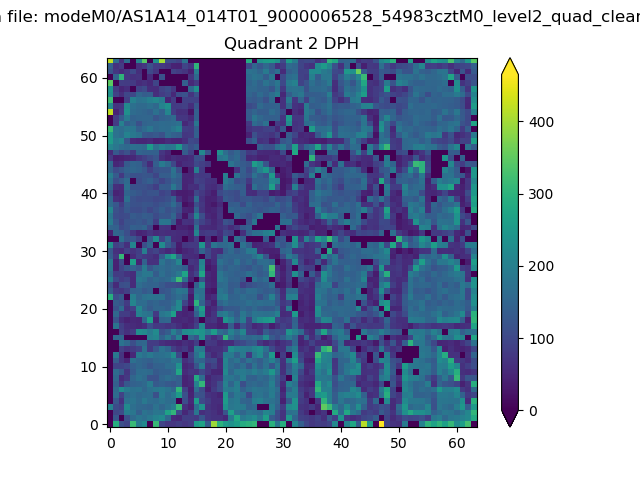 |
Quadrant C |
| Plot type | Count rate plots | Images |
|---|---|---|
| Comparison with Poisson distribution Blue bars denote a histogram of data divided into 1 sec bins. Red curve is a Poisson curve with rate = median count rate of data. |
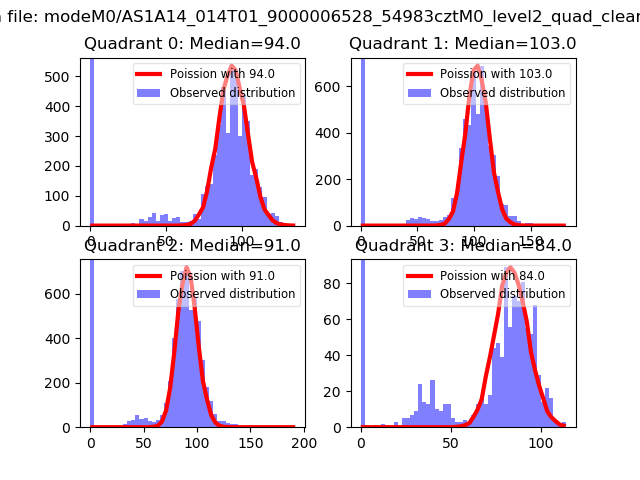 |
 |
| Quadrant-wise count rates Data is divided into 100 sec bins |
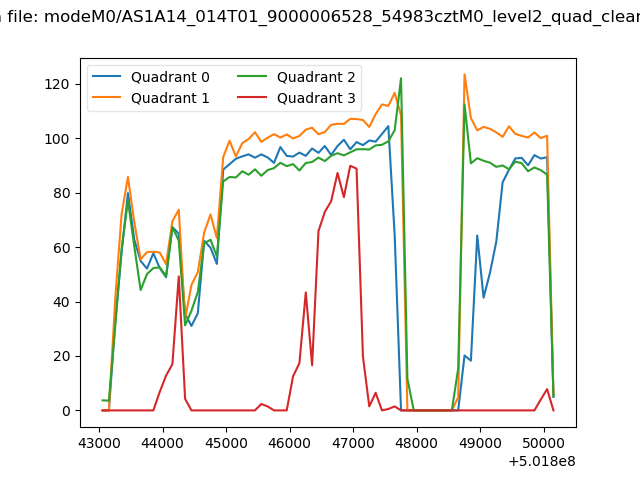 |
|
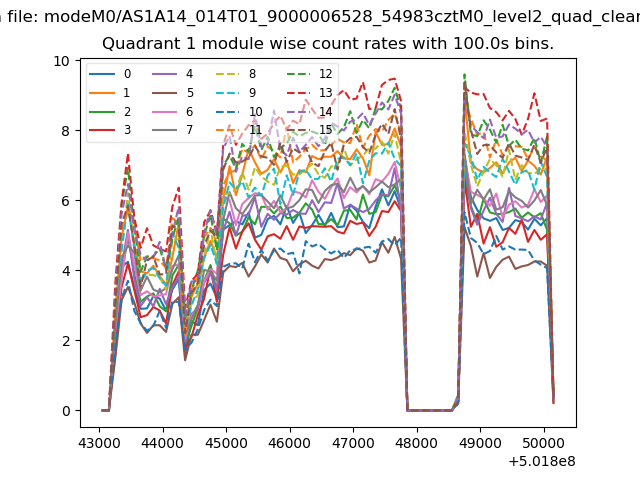
| Module-wise count rates for Quadrant A Data is divided into 100 sec bins |
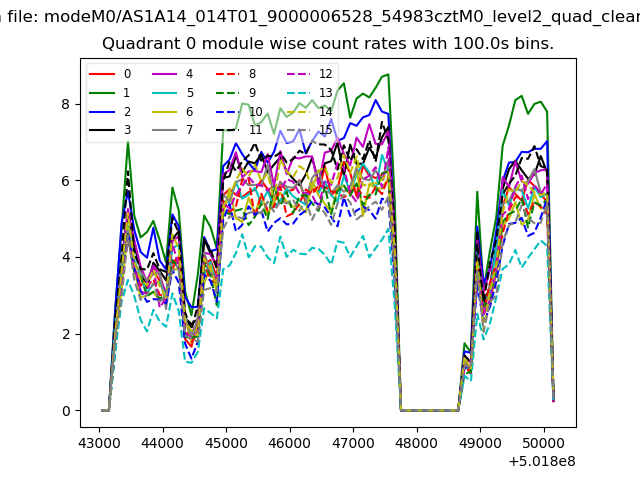 |
 |
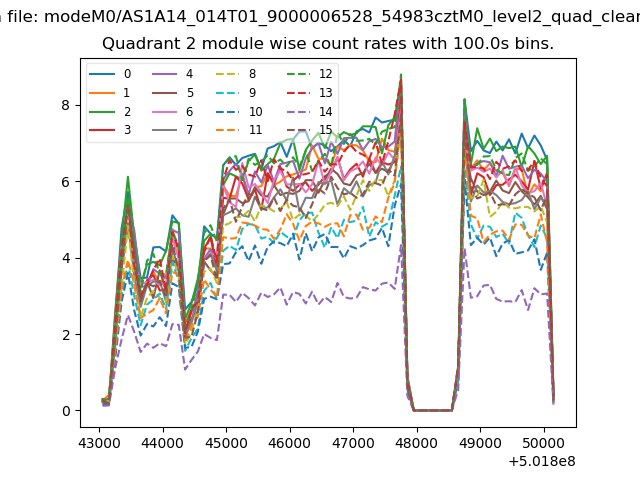
| Module-wise count rates for Quadrant B Data is divided into 100 sec bins |
 |
 |
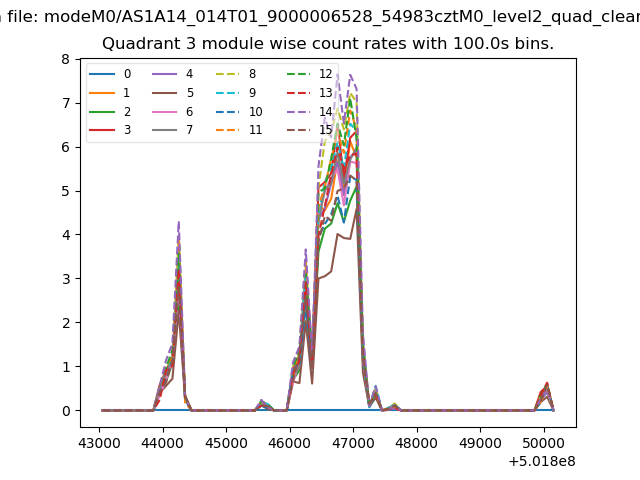
| Module-wise count rates for Quadrant C Data is divided into 100 sec bins |
 |
 |
| Module-wise count rates for Quadrant D Data is divided into 100 sec bins |
 |
 |
| Parameter | Plot |
|---|---|
| CZT HV Monitor |  |
| D_VDD | 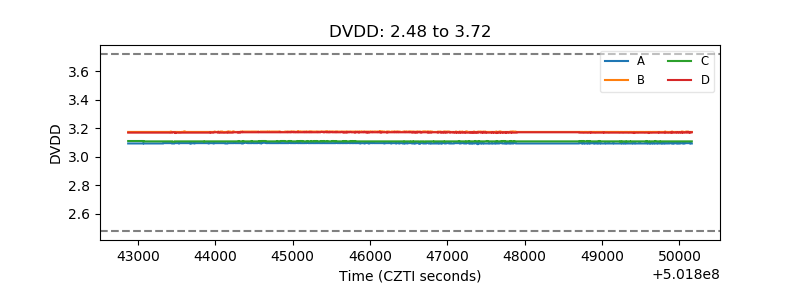 |
| Temperature 1 | 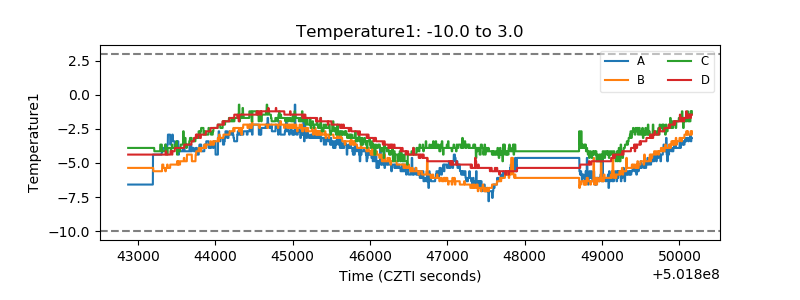 |
| Veto HV Monitor | 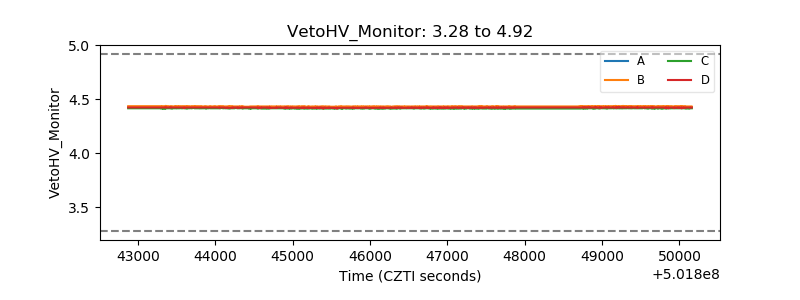 |
| Veto LLD | 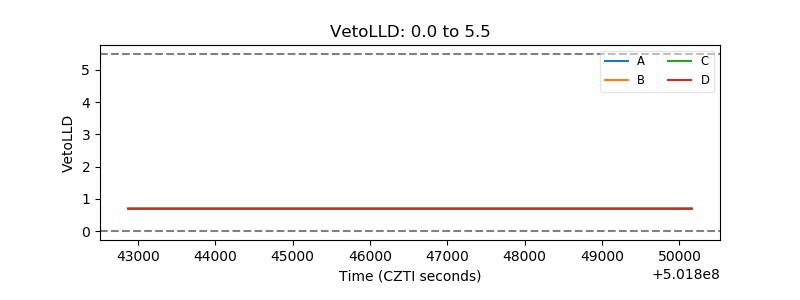 |
| Alpha Counter | 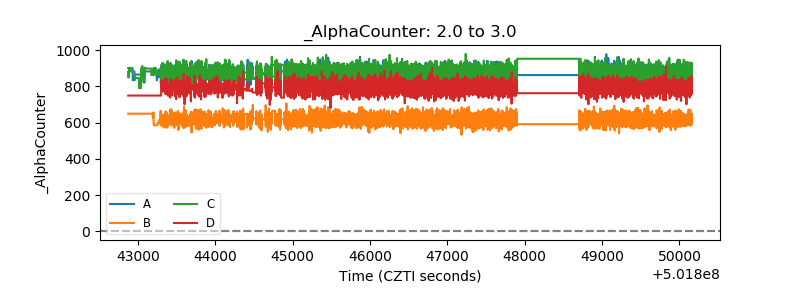 |
| _CPM_Rate | 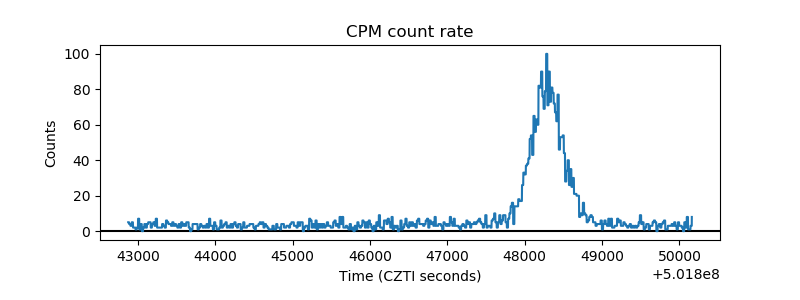 |
| CZT Counter | 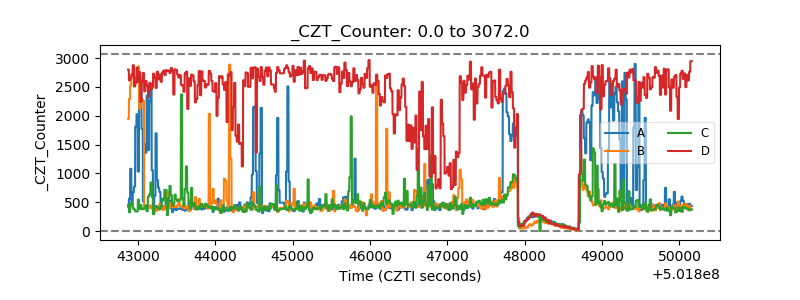 |
| +2.5 Volts monitor |  |
| +5 Volts monitor |  |
| _ROLL_ROT | 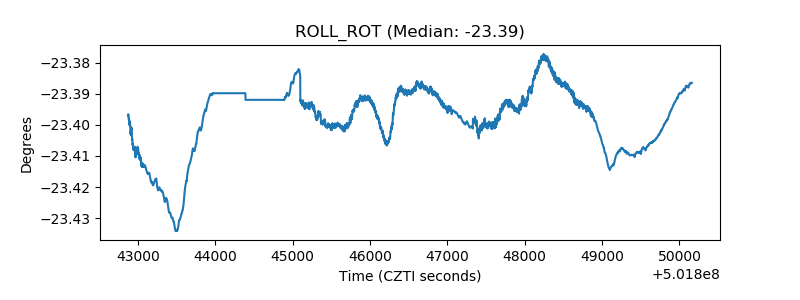 |
| _Roll_DEC | 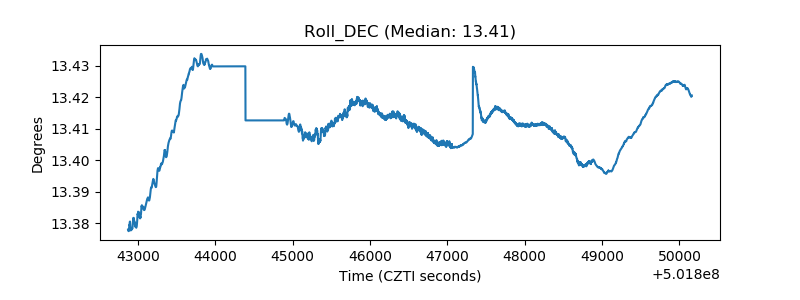 |
| _Roll_RA | 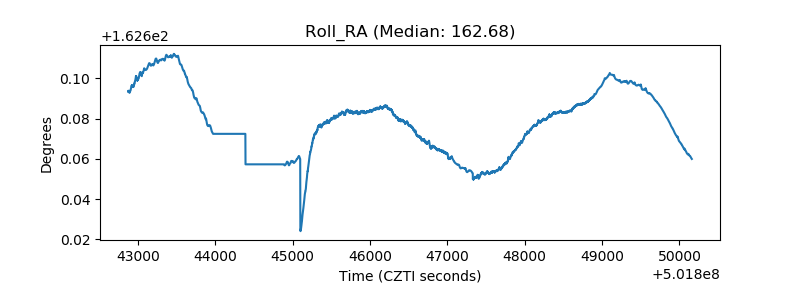 |
| Veto Counter | 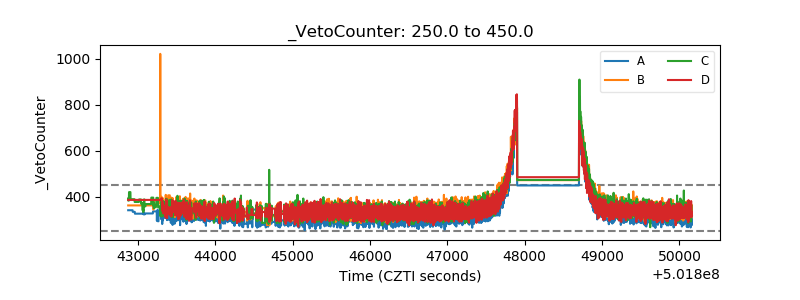 |