| Param | Original file | Final file |
|---|---|---|
| Filename | modeM0/AS1A14_014T01_9000006528_54984cztM0_level2.fits | modeM0/AS1A14_014T01_9000006528_54984cztM0_level2_quad_clean.evt |
| Size (bytes) | 1,895,520,960 | 198,956,160 |
| Size | 1.8 GB | 189.7 MB |
| Events in quadrant A | 11,256,160 | 1,418,317 |
| Events in quadrant B | 9,431,136 | 1,634,232 |
| Events in quadrant C | 8,400,788 | 1,518,243 |
| Events in quadrant D | 39,765,926 | 284,129 |
| Mode M0 | |||
|---|---|---|---|
| Quadrant | BADHDUFLAG | Total packets | Discarded packets |
| A | 0 | 45916 | 4 |
| B | 0 | 40250 | 3 |
| C | 0 | 37492 | 3 |
| D | 0 | 129813 | 11 |
| Mode SS | |||
|---|---|---|---|
| Quadrant | BADHDUFLAG | Total packets | Discarded packets |
| A | 0 | 346 | 0 |
| B | 0 | 346 | 0 |
| C | 0 | 346 | 0 |
| D | 0 | 346 | 0 |
| Mode M9 | |||
|---|---|---|---|
| Quadrant | BADHDUFLAG | Total packets | Discarded packets |
| A | 0 | 23 | 0 |
| B | 0 | 23 | 0 |
| C | 0 | 23 | 0 |
| D | 0 | 23 | 0 |
| Quadrant | Total seconds | Saturated seconds | Saturation percentage |
|---|---|---|---|
| A | 16947 | 1629 | 9.612321% |
| B | 16948 | 953 | 5.623082% |
| C | 16948 | 360 | 2.124144% |
| D | 16947 | 13957 | 82.356759% |
Noise dominated data is calculated using 1-second bins in cleaned event files. If a bin has >2000 counts, and if more than 50% of those come from <1% of pixels, then it is considered to be noise-dominated and hence unusable.
| Quadrant | # 1 sec bins | Bins with >0 counts | Bins with >2000 counts | High rate bins dominated by noise | Noise dominated (total time) | Noise dominated (detector-on time) | Marked lightcurve |
|---|---|---|---|---|---|---|---|
| A | 19257 | 16950 | 1013 | 1013 | 5.26% | 5.98% | 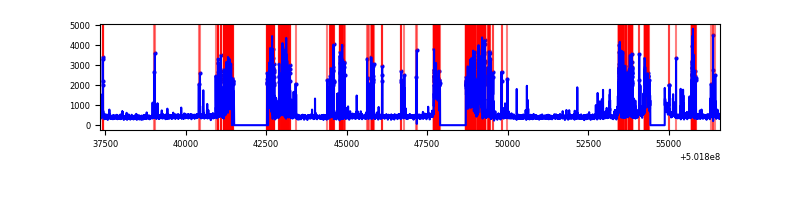 |
| B | 19258 | 16951 | 576 | 576 | 2.99% | 3.40% | 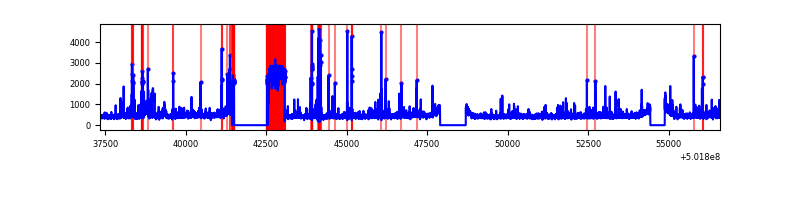 |
| C | 19258 | 16953 | 97 | 97 | 0.50% | 0.57% | 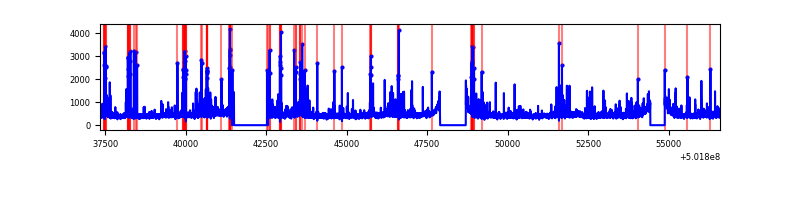 |
| D | 19257 | 16947 | 13553 | 13553 | 70.38% | 79.97% | 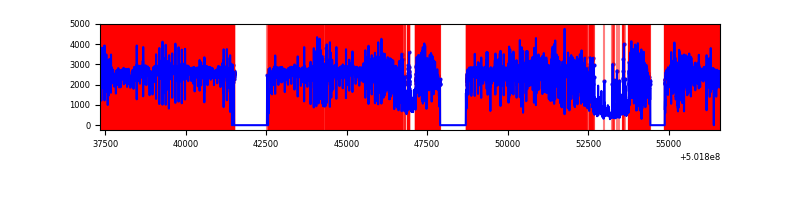 |
Top three noisy pixels from each quadrant. If the there are fewer than three noisy pixels in the level2.evt file, extra rows are filled as -1
| Pixel properties | Quadrant properties | ||||||
|---|---|---|---|---|---|---|---|
| Quadrant | DetID | PixID | Counts | Sigma | Mean | Median | Sigma |
| A | 15 | 32 | 3395618 | 7784.88 | 1776 | 1732 | 436.0 |
| A | 0 | 8 | 804536 | 1841.47 | 1776 | 1732 | 436.0 |
| A | 4 | 3 | 55510 | 123.36 | 1776 | 1732 | 436.0 |
| B | 4 | 81 | 1383169 | 3637.47 | 1779 | 1712 | 379.8 |
| B | 0 | 183 | 279075 | 730.32 | 1779 | 1712 | 379.8 |
| B | 5 | 236 | 158714 | 413.4 | 1779 | 1712 | 379.8 |
| C | 4 | 5 | 264810 | 528.08 | 1827 | 1812 | 498.0 |
| C | 6 | 223 | 247328 | 492.97 | 1827 | 1812 | 498.0 |
| C | 13 | 3 | 165135 | 327.94 | 1827 | 1812 | 498.0 |
| D | 15 | 94 | 34945434 | 151963.34 | 801 | 765 | 230.0 |
| D | 2 | 249 | 560302 | 2433.25 | 801 | 765 | 230.0 |
| D | 11 | 129 | 211856 | 917.97 | 801 | 765 | 230.0 |
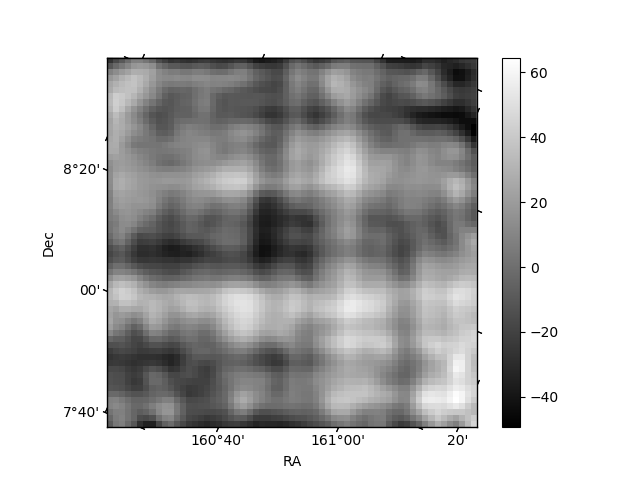
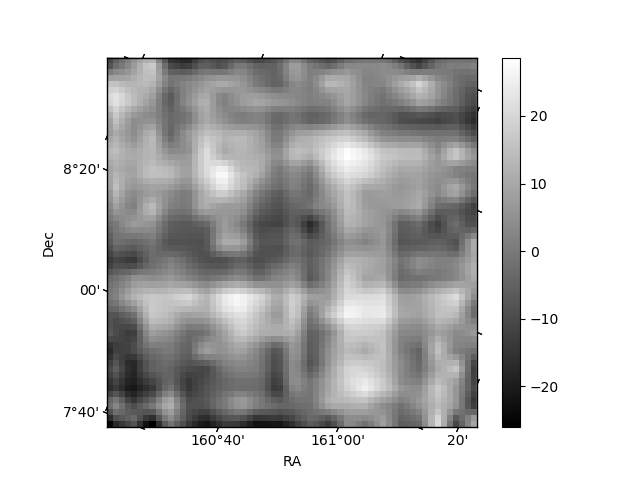
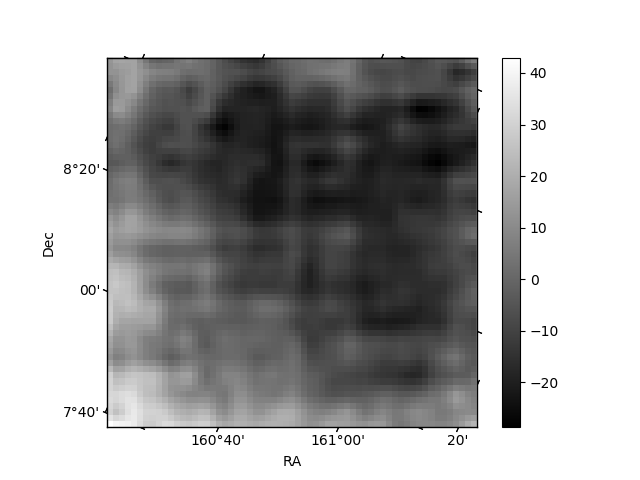
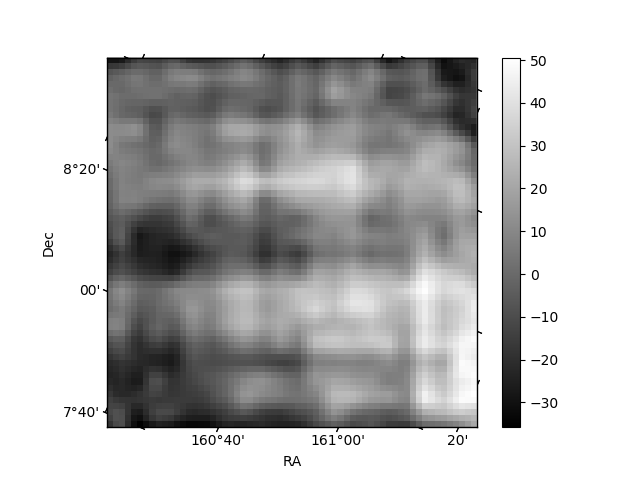
Histogram calculated using DETX and DETY for each event in the final _common_clean file
| Quadrant A | 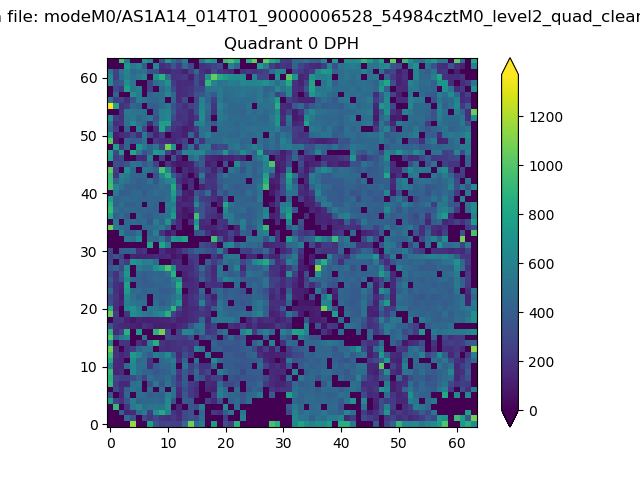 |
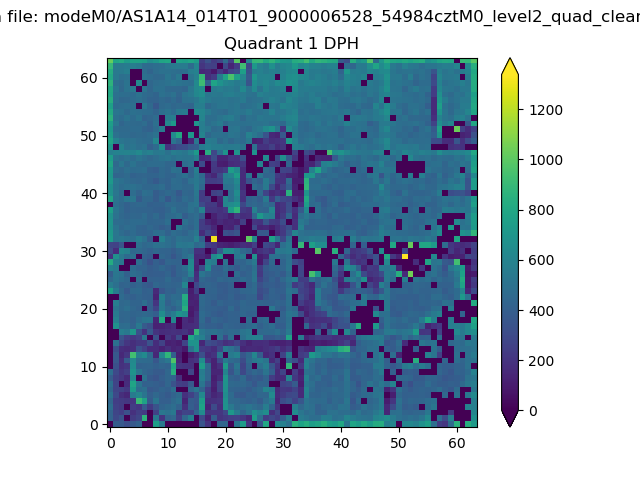 |
Quadrant B |
|---|---|---|---|
| Quadrant D | 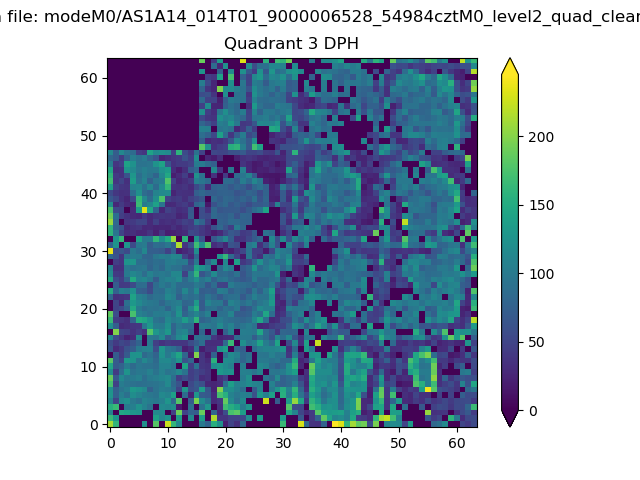 |
 |
Quadrant C |
| Plot type | Count rate plots | Images |
|---|---|---|
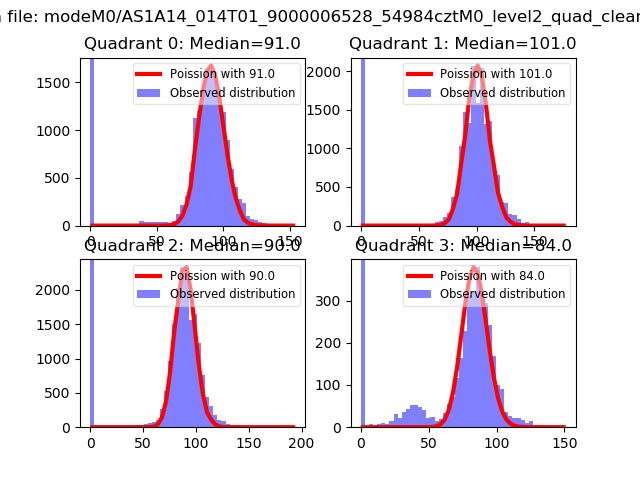
| Comparison with Poisson distribution Blue bars denote a histogram of data divided into 1 sec bins. Red curve is a Poisson curve with rate = median count rate of data. |
 |
 |
| Quadrant-wise count rates Data is divided into 100 sec bins |
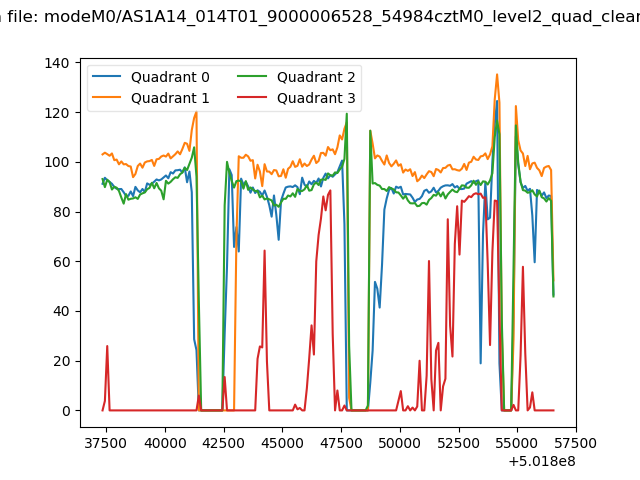 |
|
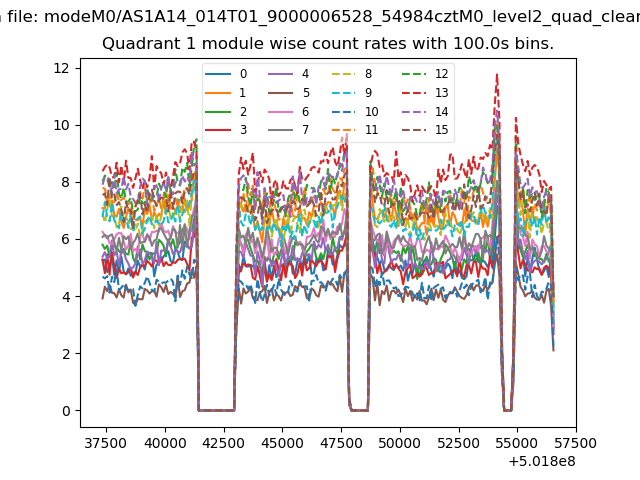
| Module-wise count rates for Quadrant A Data is divided into 100 sec bins |
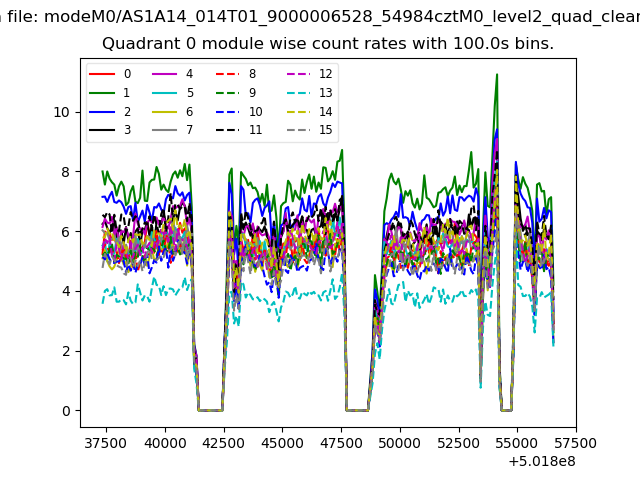 |
 |
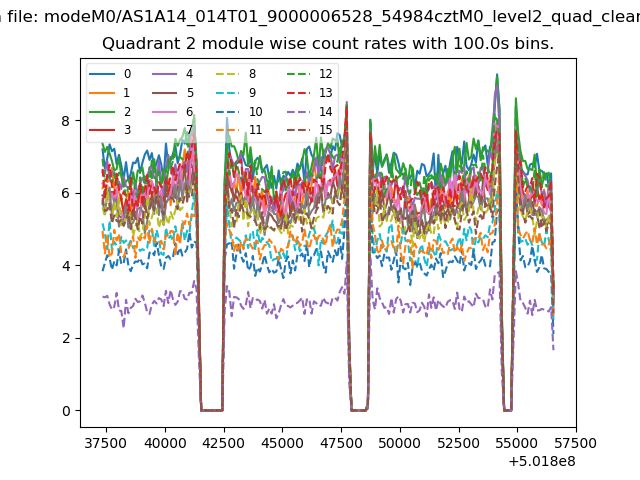
| Module-wise count rates for Quadrant B Data is divided into 100 sec bins |
 |
 |
| Module-wise count rates for Quadrant C Data is divided into 100 sec bins |
 |
 |
| Module-wise count rates for Quadrant D Data is divided into 100 sec bins |
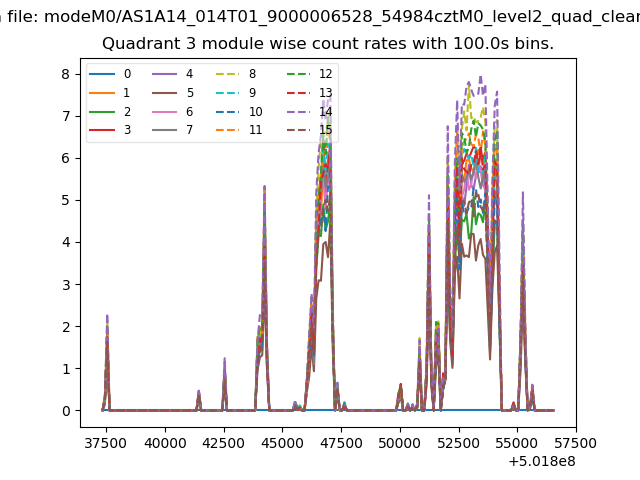 |
 |
| Parameter | Plot |
|---|---|
| CZT HV Monitor | 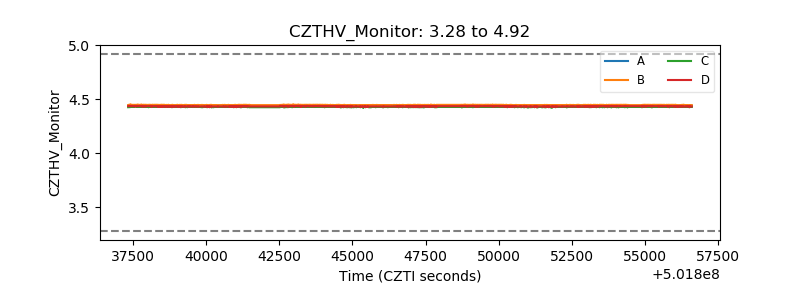 |
| D_VDD | 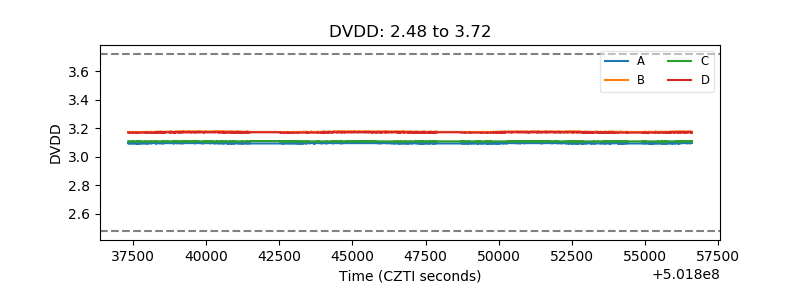 |
| Temperature 1 | 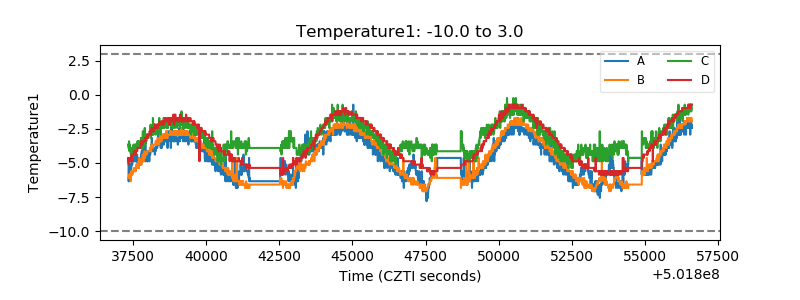 |
| Veto HV Monitor | 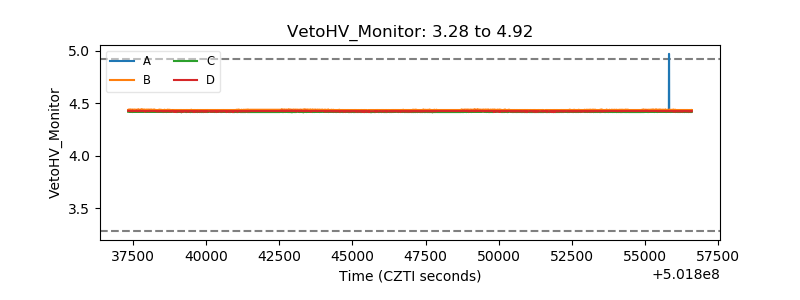 |
| Veto LLD | 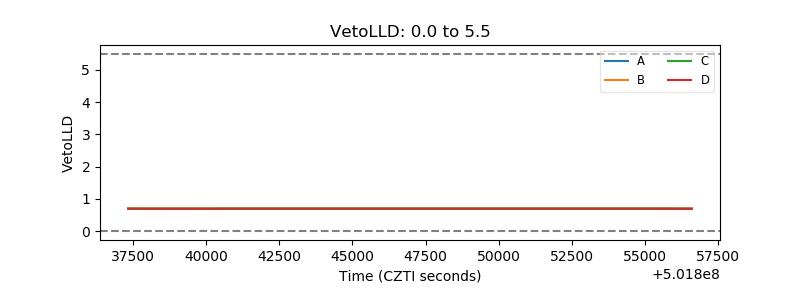 |
| Alpha Counter | 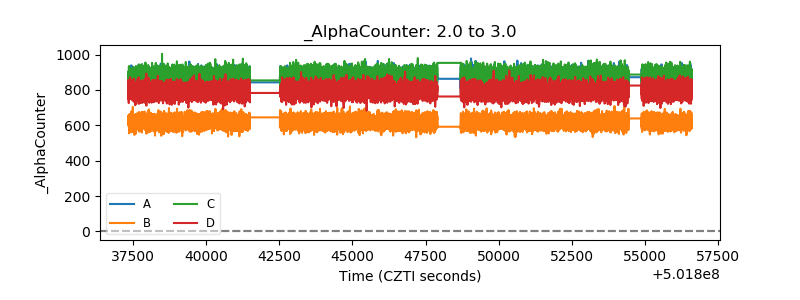 |
| _CPM_Rate | 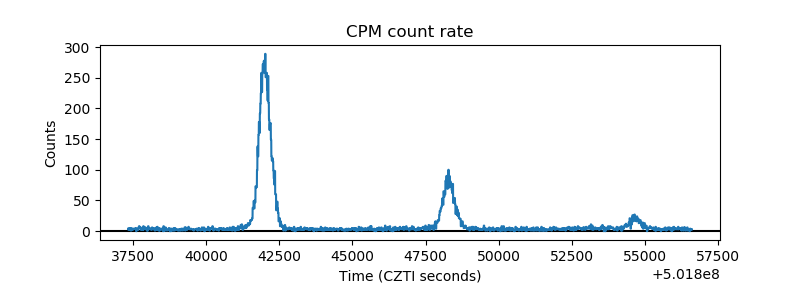 |
| CZT Counter |  |
| +2.5 Volts monitor | 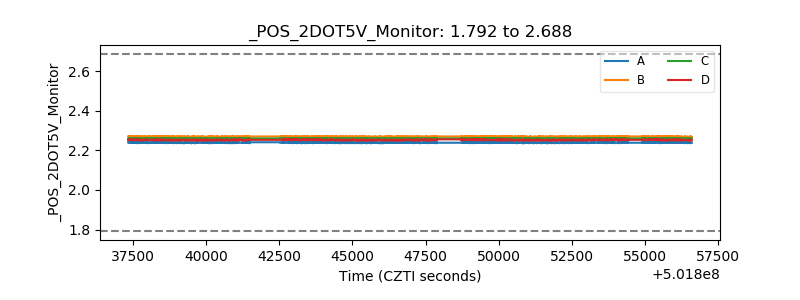 |
| +5 Volts monitor | 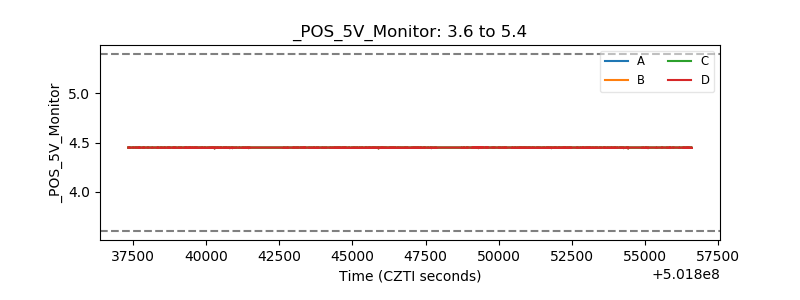 |
| _ROLL_ROT | 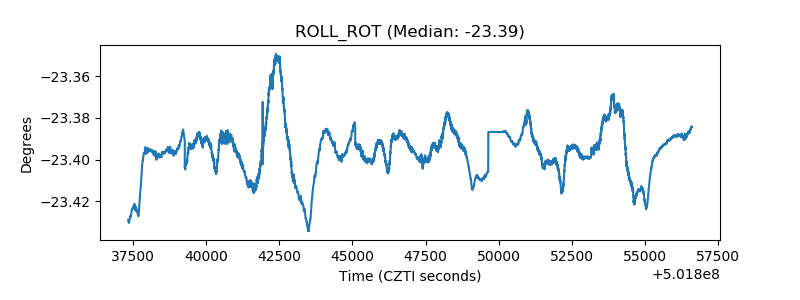 |
| _Roll_DEC | 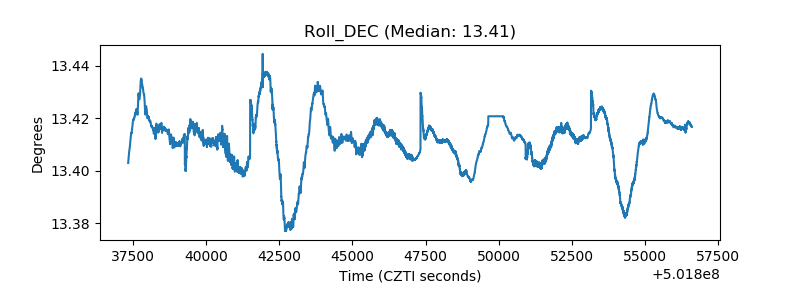 |
| _Roll_RA | 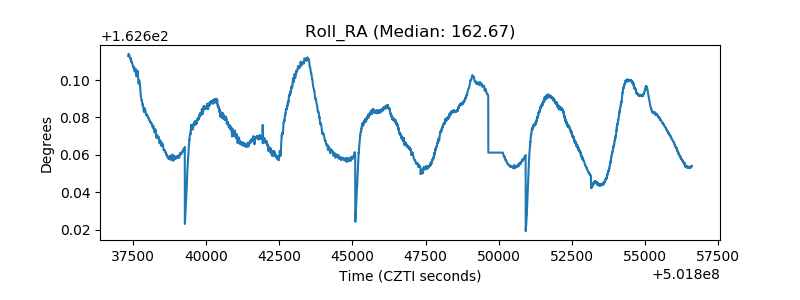 |
| Veto Counter | 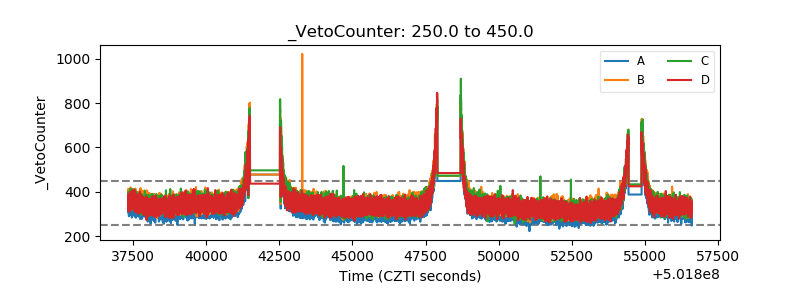 |