| Param | Original file | Final file |
|---|---|---|
| Filename | modeM0/AS1A14_014T01_9000006528_54985cztM0_level2.fits | modeM0/AS1A14_014T01_9000006528_54985cztM0_level2_quad_clean.evt |
| Size (bytes) | 868,504,320 | 91,166,400 |
| Size | 828.3 MB | 86.9 MB |
| Events in quadrant A | 5,512,674 | 689,913 |
| Events in quadrant B | 3,812,437 | 800,049 |
| Events in quadrant C | 3,948,710 | 710,382 |
| Events in quadrant D | 18,262,145 | 12,017 |
| Mode M0 | |||
|---|---|---|---|
| Quadrant | BADHDUFLAG | Total packets | Discarded packets |
| A | 0 | 22106 | 0 |
| B | 0 | 17100 | 0 |
| C | 0 | 17470 | 0 |
| D | 0 | 59681 | 0 |
| Mode SS | |||
|---|---|---|---|
| Quadrant | BADHDUFLAG | Total packets | Discarded packets |
| A | 0 | 158 | 0 |
| B | 0 | 158 | 0 |
| C | 0 | 158 | 0 |
| D | 0 | 158 | 0 |
| Quadrant | Total seconds | Saturated seconds | Saturation percentage |
|---|---|---|---|
| A | 7878 | 628 | 7.971566% |
| B | 7879 | 125 | 1.586496% |
| C | 7879 | 51 | 0.647290% |
| D | 7879 | 7762 | 98.515040% |
Noise dominated data is calculated using 1-second bins in cleaned event files. If a bin has >2000 counts, and if more than 50% of those come from <1% of pixels, then it is considered to be noise-dominated and hence unusable.
| Quadrant | # 1 sec bins | Bins with >0 counts | Bins with >2000 counts | High rate bins dominated by noise | Noise dominated (total time) | Noise dominated (detector-on time) | Marked lightcurve |
|---|---|---|---|---|---|---|---|
| A | 7878 | 7878 | 453 | 453 | 5.75% | 5.75% | 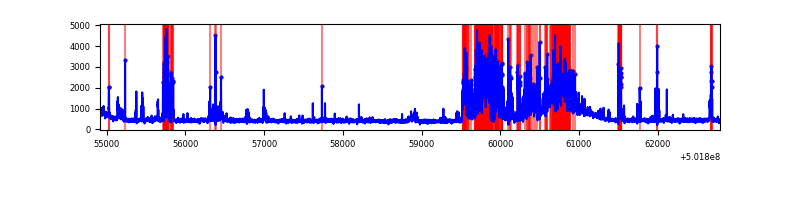 |
| B | 7879 | 7879 | 39 | 39 | 0.49% | 0.49% | 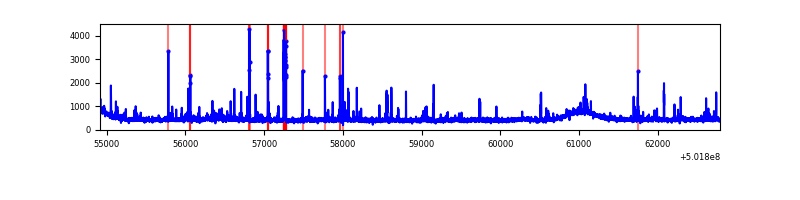 |
| C | 7879 | 7879 | 38 | 38 | 0.48% | 0.48% | 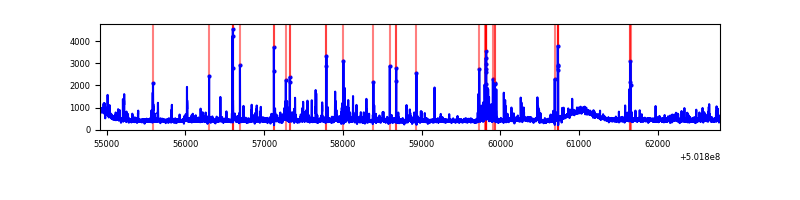 |
| D | 7878 | 7878 | 6562 | 6562 | 83.30% | 83.30% | 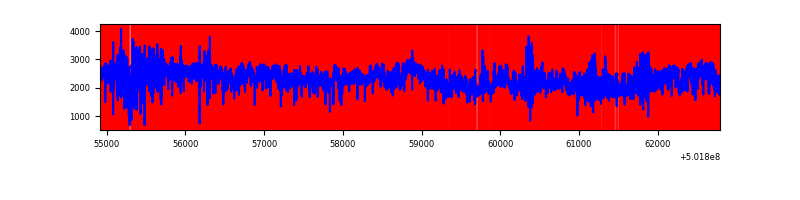 |
Top three noisy pixels from each quadrant. If the there are fewer than three noisy pixels in the level2.evt file, extra rows are filled as -1
| Pixel properties | Quadrant properties | ||||||
|---|---|---|---|---|---|---|---|
| Quadrant | DetID | PixID | Counts | Sigma | Mean | Median | Sigma |
| A | 15 | 32 | 1856484 | 8813.58 | 854 | 832 | 210.5 |
| A | 0 | 8 | 225570 | 1067.41 | 854 | 832 | 210.5 |
| A | 5 | 241 | 36779 | 170.73 | 854 | 832 | 210.5 |
| B | 5 | 236 | 110007 | 585.52 | 863 | 827 | 186.5 |
| B | 5 | 185 | 54751 | 289.19 | 863 | 827 | 186.5 |
| B | 7 | 252 | 42010 | 220.86 | 863 | 827 | 186.5 |
| C | 6 | 223 | 167913 | 710.63 | 858 | 849 | 235.1 |
| C | 5 | 250 | 95474 | 402.5 | 858 | 849 | 235.1 |
| C | 12 | 252 | 81157 | 341.6 | 858 | 849 | 235.1 |
| D | 15 | 94 | 17184283 | 397211.08 | 146 | 139 | 43.3 |
| D | 2 | 249 | 97587 | 2252.51 | 146 | 139 | 43.3 |
| D | 6 | 46 | 82559 | 1905.14 | 146 | 139 | 43.3 |
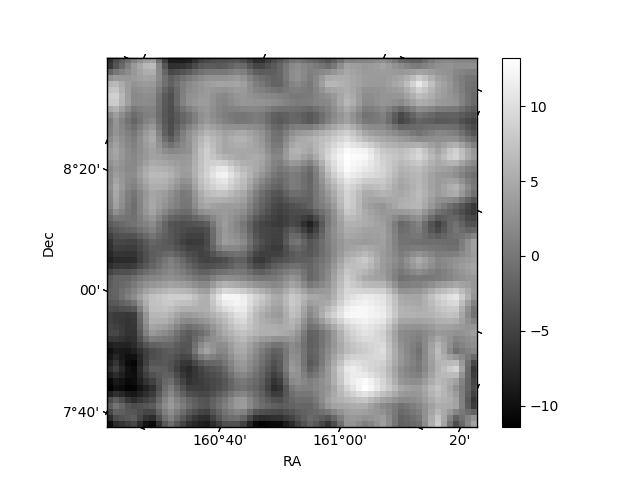
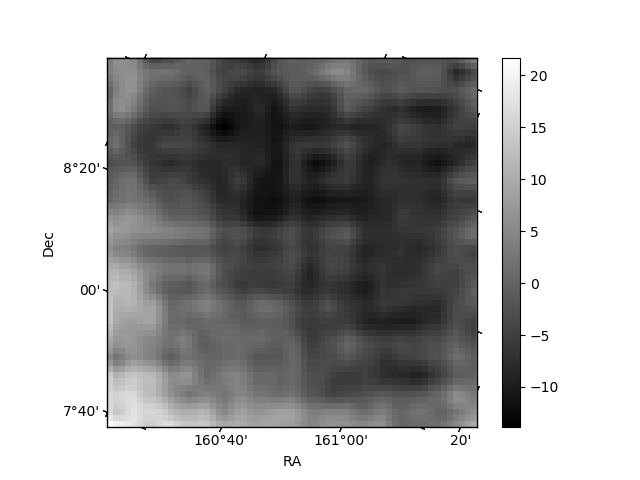
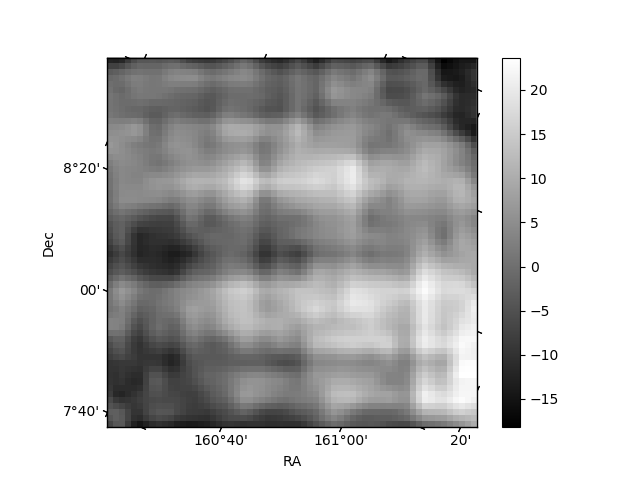
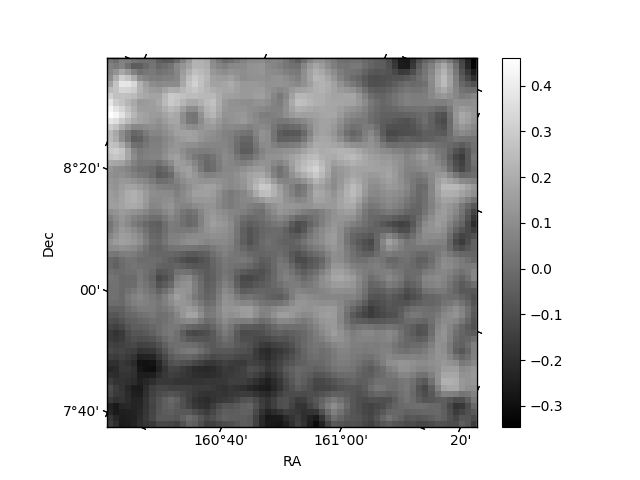
Histogram calculated using DETX and DETY for each event in the final _common_clean file
| Quadrant A | 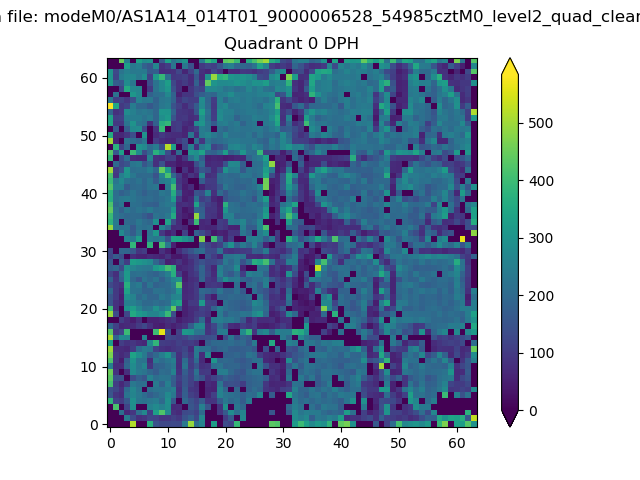 |
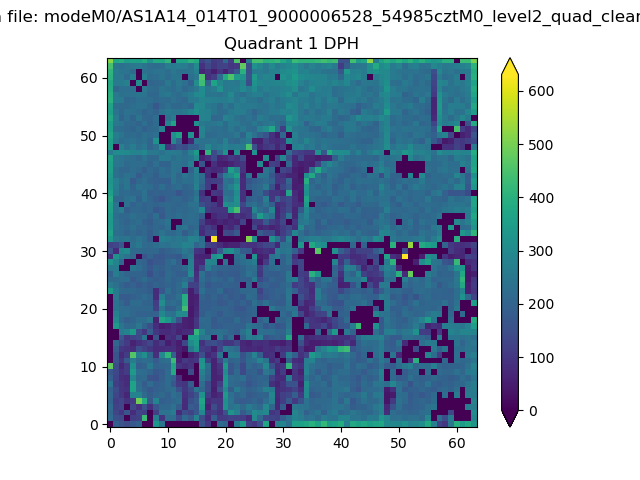 |
Quadrant B |
|---|---|---|---|
| Quadrant D | 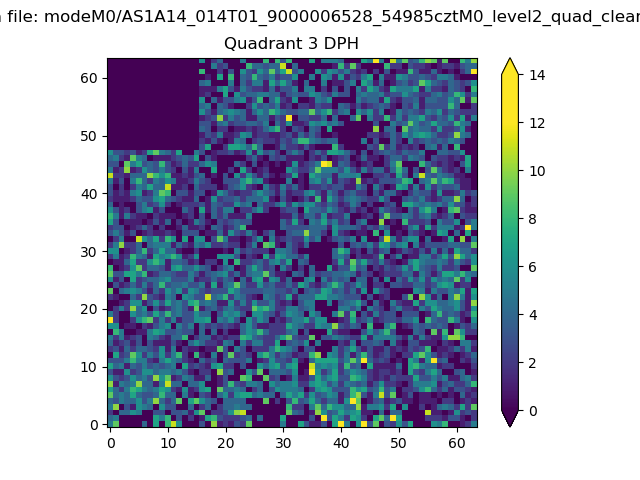 |
 |
Quadrant C |
| Plot type | Count rate plots | Images |
|---|---|---|
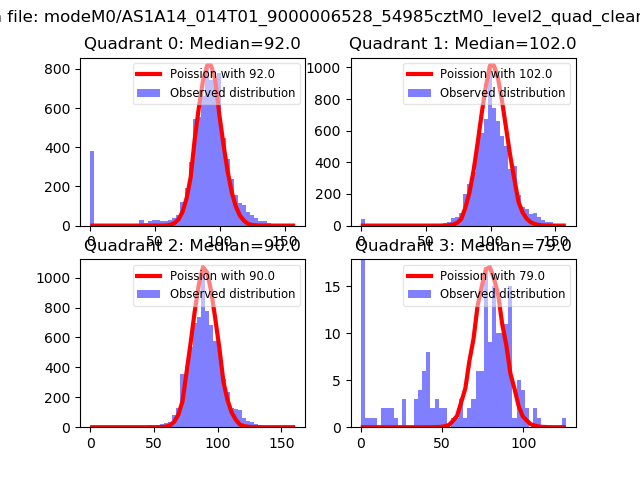
| Comparison with Poisson distribution Blue bars denote a histogram of data divided into 1 sec bins. Red curve is a Poisson curve with rate = median count rate of data. |
 |
 |
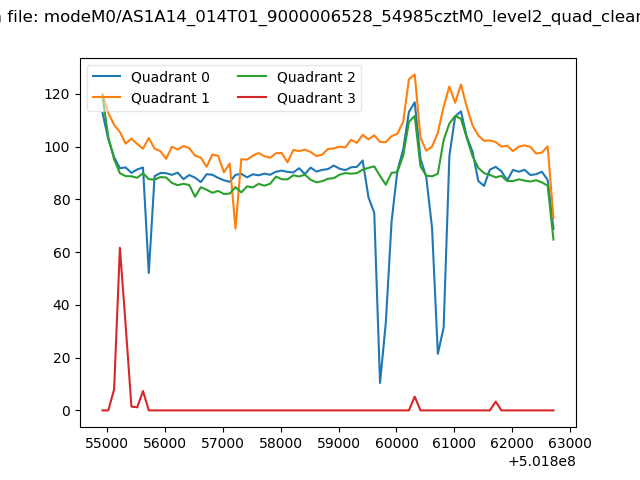
| Quadrant-wise count rates Data is divided into 100 sec bins |
 |
|
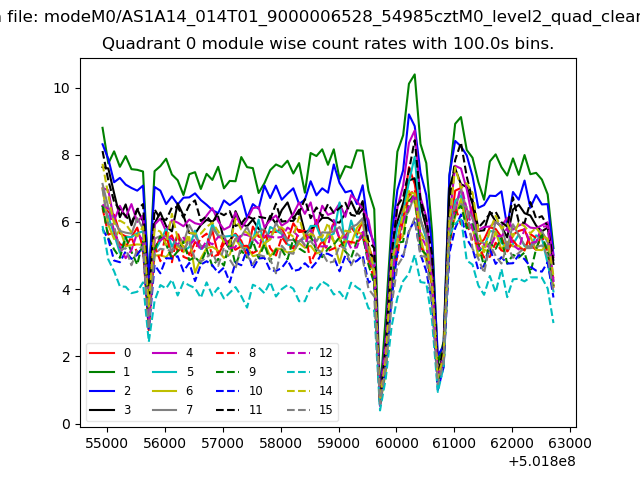
| Module-wise count rates for Quadrant A Data is divided into 100 sec bins |
 |
 |
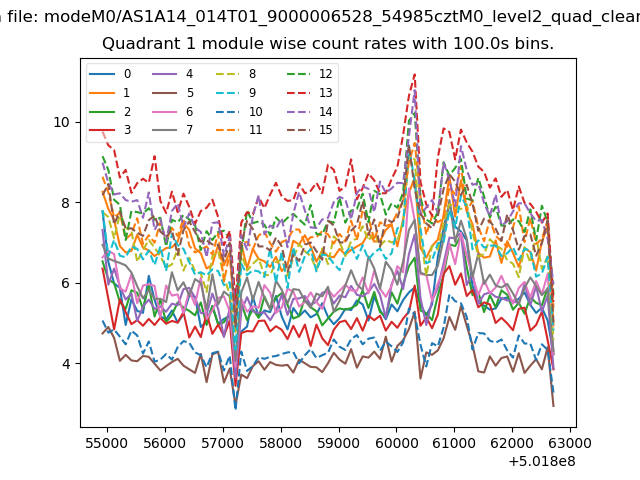
| Module-wise count rates for Quadrant B Data is divided into 100 sec bins |
 |
 |
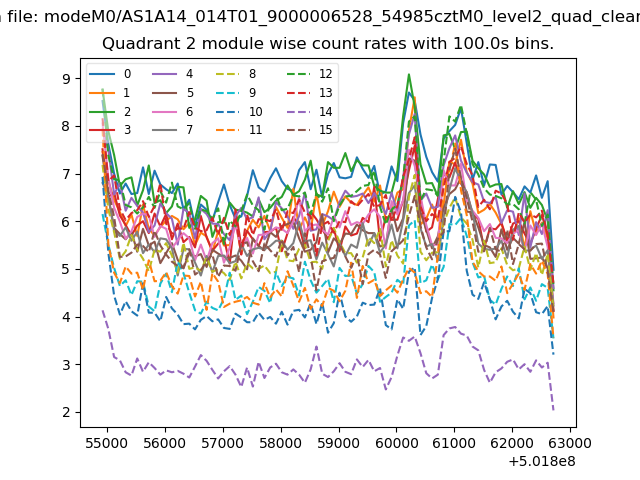
| Module-wise count rates for Quadrant C Data is divided into 100 sec bins |
 |
 |
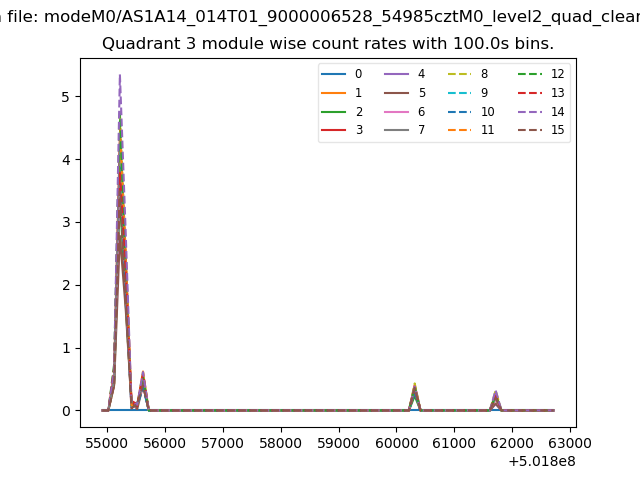
| Module-wise count rates for Quadrant D Data is divided into 100 sec bins |
 |
 |
| Parameter | Plot |
|---|---|
| CZT HV Monitor | 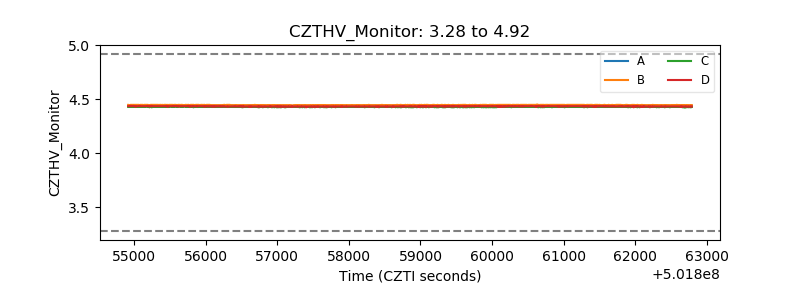 |
| D_VDD | 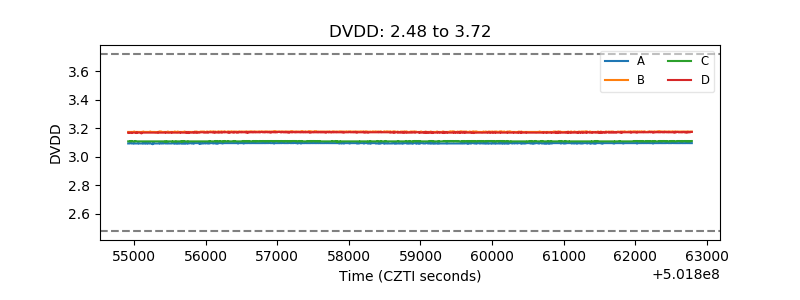 |
| Temperature 1 | 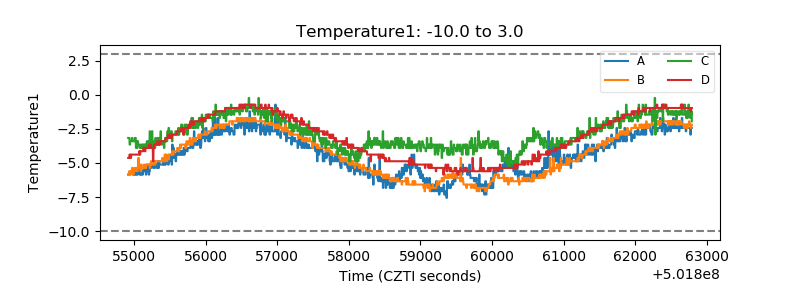 |
| Veto HV Monitor | 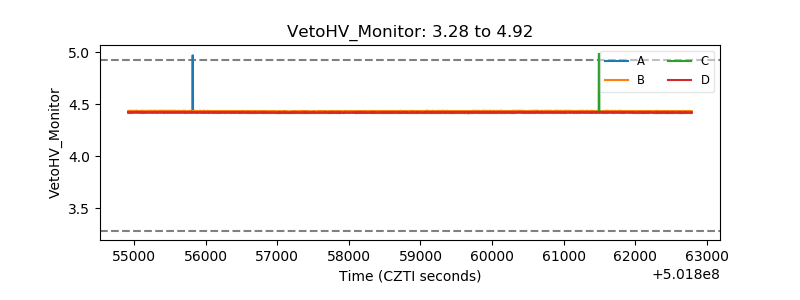 |
| Veto LLD | 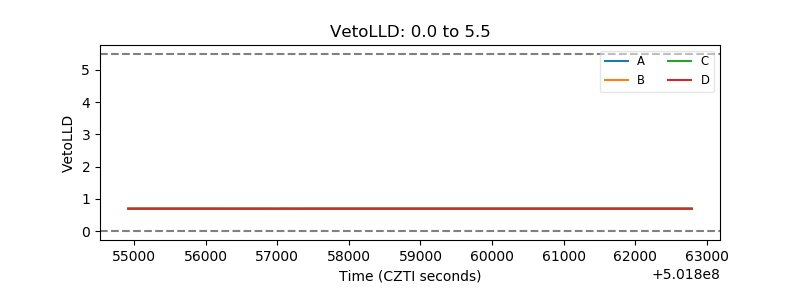 |
| Alpha Counter | 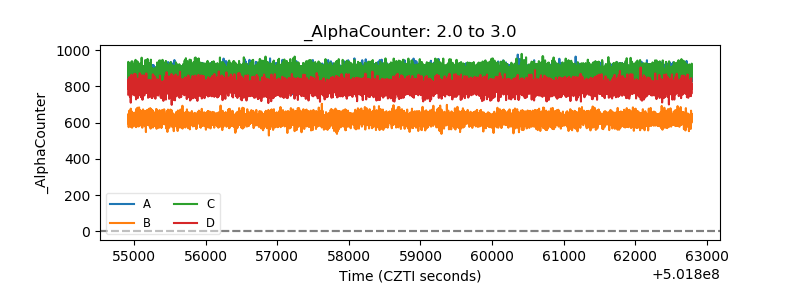 |
| _CPM_Rate | 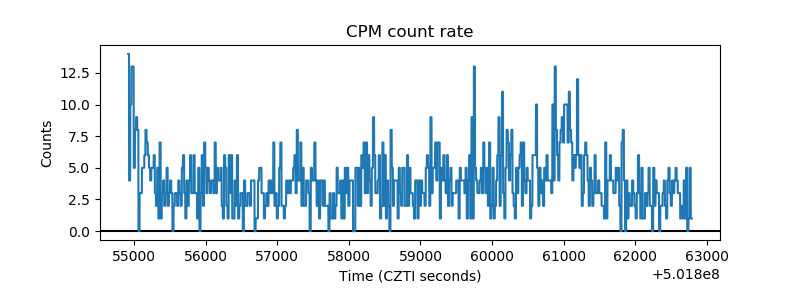 |
| CZT Counter |  |
| +2.5 Volts monitor |  |
| +5 Volts monitor | 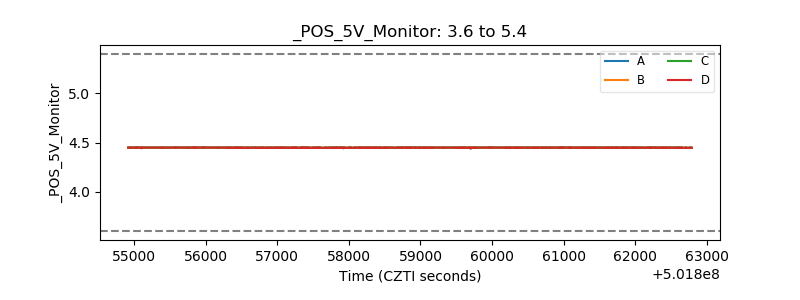 |
| _ROLL_ROT | 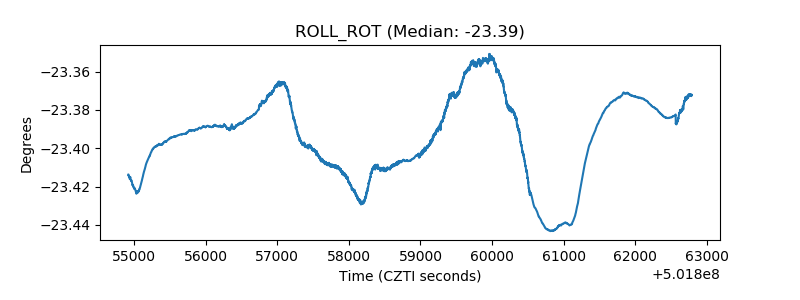 |
| _Roll_DEC | 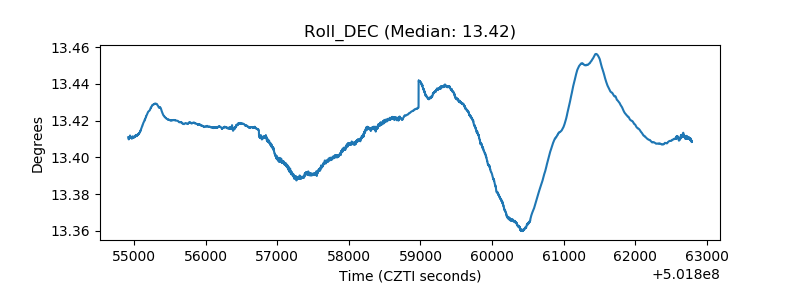 |
| _Roll_RA | 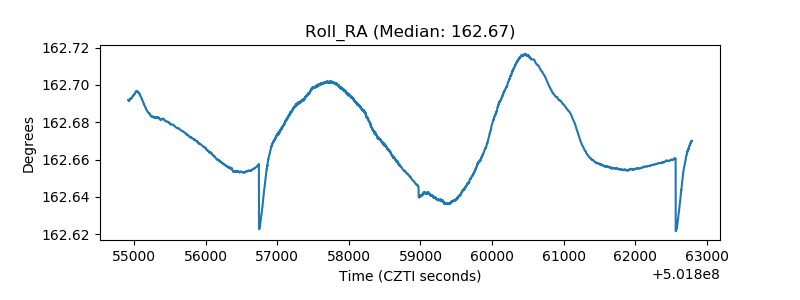 |
| Veto Counter | 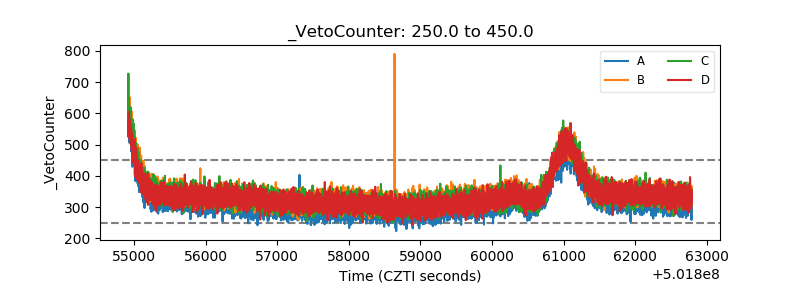 |