| Param | Original file | Final file |
|---|---|---|
| Filename | modeM0/AS1A14_014T01_9000006528_54986cztM0_level2.fits | modeM0/AS1A14_014T01_9000006528_54986cztM0_level2_quad_clean.evt |
| Size (bytes) | 873,069,120 | 92,505,600 |
| Size | 832.6 MB | 88.2 MB |
| Events in quadrant A | 4,199,010 | 728,899 |
| Events in quadrant B | 3,751,026 | 804,314 |
| Events in quadrant C | 3,822,728 | 710,653 |
| Events in quadrant D | 19,922,876 | 1,202 |
| Mode M0 | |||
|---|---|---|---|
| Quadrant | BADHDUFLAG | Total packets | Discarded packets |
| A | 0 | 18702 | 281 |
| B | 0 | 17295 | 286 |
| C | 0 | 17582 | 279 |
| D | 0 | 65311 | 727 |
| Mode SS | |||
|---|---|---|---|
| Quadrant | BADHDUFLAG | Total packets | Discarded packets |
| A | 0 | 162 | 2 |
| B | 0 | 162 | 2 |
| C | 0 | 162 | 4 |
| D | 0 | 162 | 2 |
| Quadrant | Total seconds | Saturated seconds | Saturation percentage |
|---|---|---|---|
| A | 8001 | 221 | 2.762155% |
| B | 8005 | 44 | 0.549656% |
| C | 8001 | 33 | 0.412448% |
| D | 7988 | 7979 | 99.887331% |
Noise dominated data is calculated using 1-second bins in cleaned event files. If a bin has >2000 counts, and if more than 50% of those come from <1% of pixels, then it is considered to be noise-dominated and hence unusable.
| Quadrant | # 1 sec bins | Bins with >0 counts | Bins with >2000 counts | High rate bins dominated by noise | Noise dominated (total time) | Noise dominated (detector-on time) | Marked lightcurve |
|---|---|---|---|---|---|---|---|
| A | 8056 | 8021 | 176 | 176 | 2.18% | 2.19% | 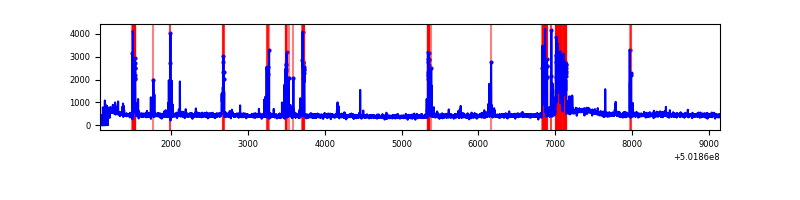 |
| B | 8056 | 8024 | 24 | 24 | 0.30% | 0.30% | 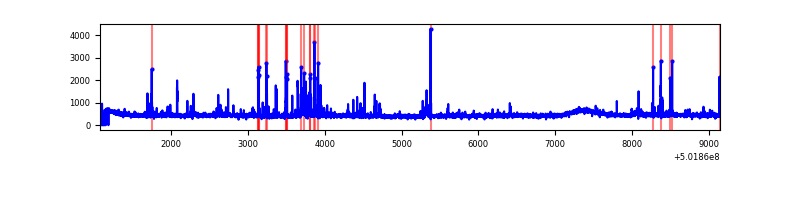 |
| C | 8066 | 8023 | 32 | 32 | 0.40% | 0.40% | 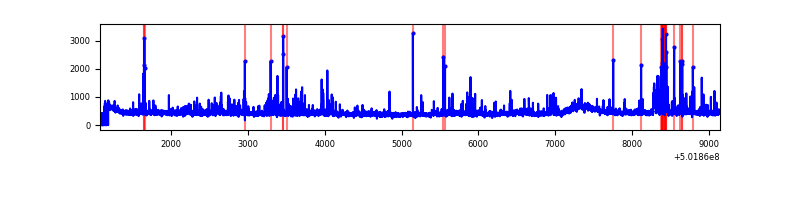 |
| D | 8045 | 7991 | 7268 | 7268 | 90.34% | 90.95% | 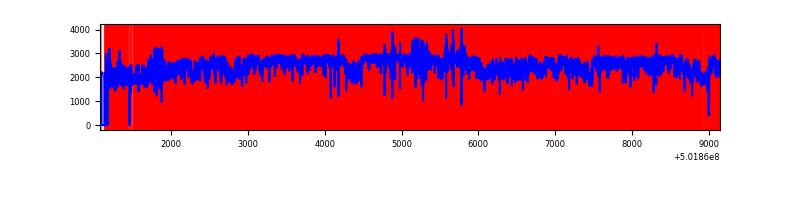 |
Top three noisy pixels from each quadrant. If the there are fewer than three noisy pixels in the level2.evt file, extra rows are filled as -1
| Pixel properties | Quadrant properties | ||||||
|---|---|---|---|---|---|---|---|
| Quadrant | DetID | PixID | Counts | Sigma | Mean | Median | Sigma |
| A | 15 | 32 | 391466 | 1833.94 | 866 | 841 | 213.0 |
| A | 0 | 8 | 366229 | 1715.45 | 866 | 841 | 213.0 |
| A | 13 | 254 | 25520 | 115.86 | 866 | 841 | 213.0 |
| B | 5 | 236 | 112421 | 595.89 | 863 | 832 | 187.3 |
| B | 7 | 252 | 64747 | 341.31 | 863 | 832 | 187.3 |
| B | 10 | 245 | 45364 | 237.8 | 863 | 832 | 187.3 |
| C | 13 | 3 | 130119 | 559.64 | 847 | 842 | 231.0 |
| C | 6 | 223 | 126783 | 545.2 | 847 | 842 | 231.0 |
| C | 12 | 252 | 111904 | 480.79 | 847 | 842 | 231.0 |
| D | 15 | 94 | 18836385 | 465061.73 | 135 | 128 | 40.5 |
| D | 2 | 249 | 169071 | 4171.15 | 135 | 128 | 40.5 |
| D | 11 | 129 | 117135 | 2888.87 | 135 | 128 | 40.5 |
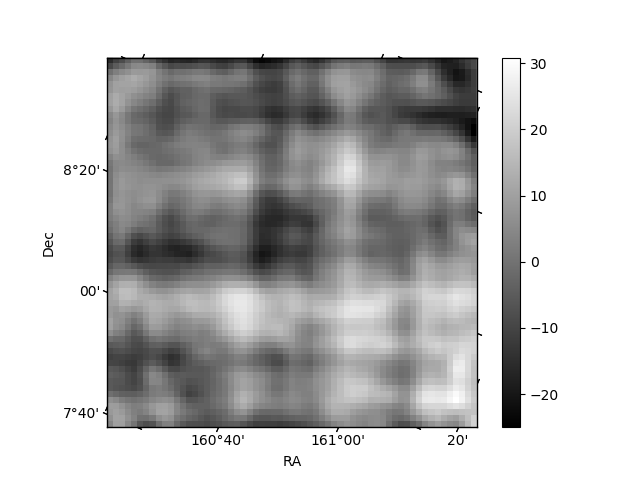
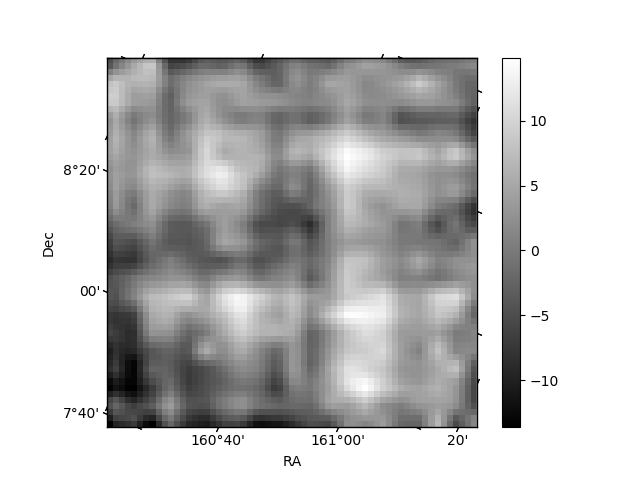
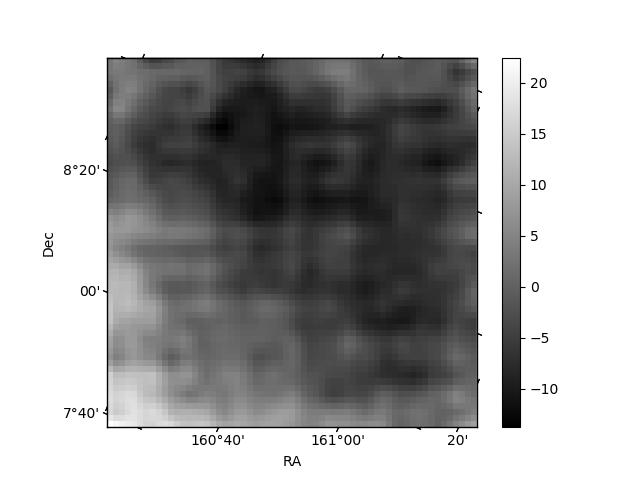
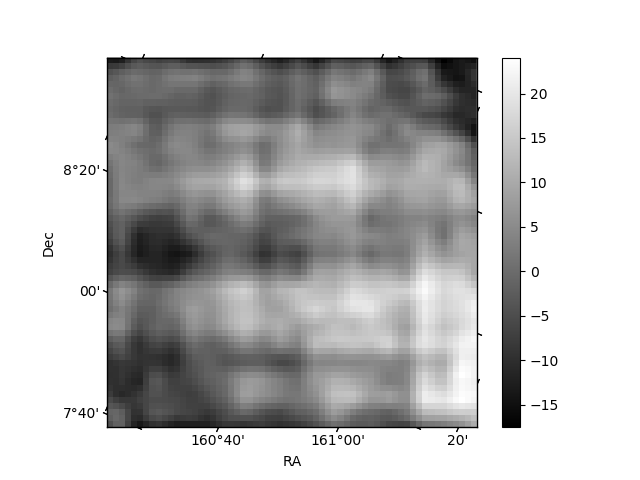
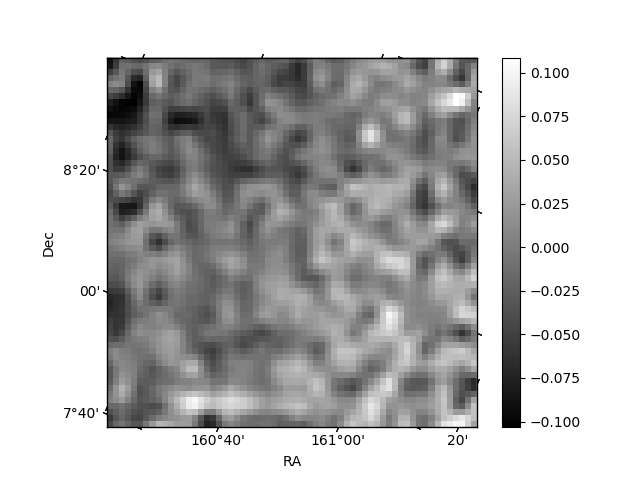
Histogram calculated using DETX and DETY for each event in the final _common_clean file
| Quadrant A | 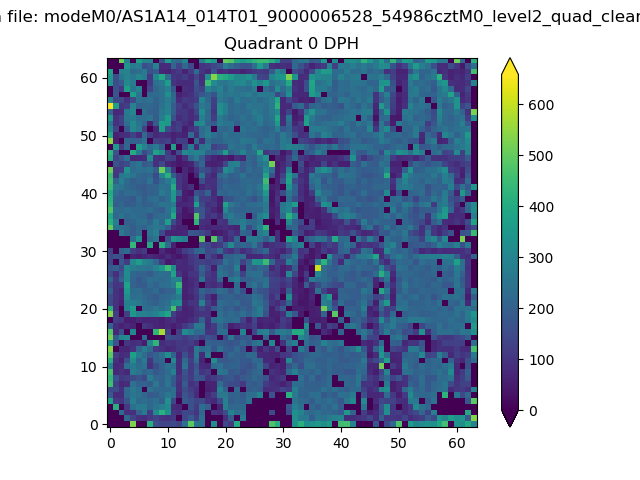 |
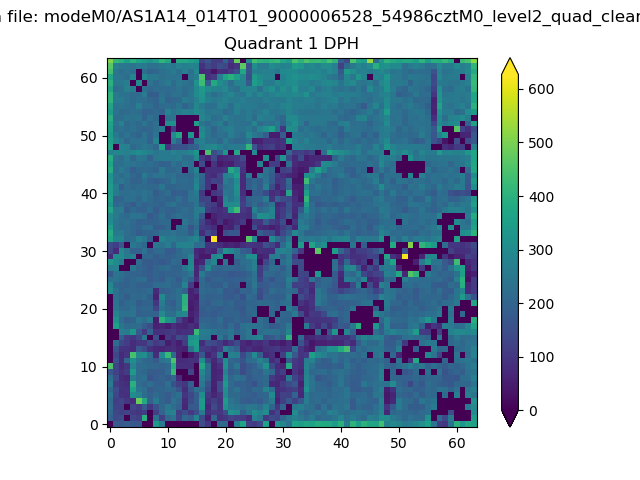 |
Quadrant B |
|---|---|---|---|
| Quadrant D | 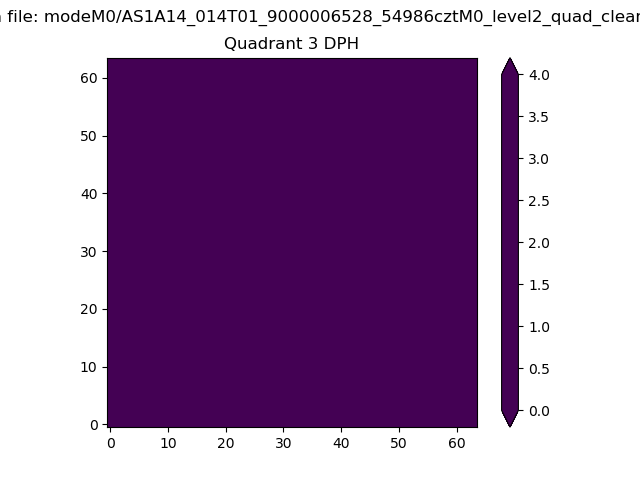 |
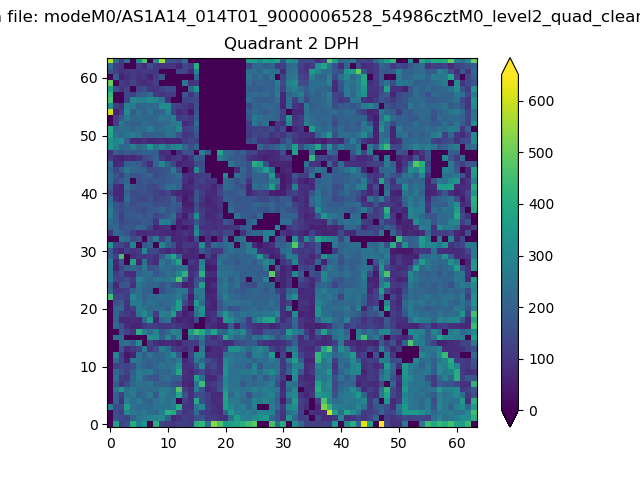 |
Quadrant C |
| Plot type | Count rate plots | Images |
|---|---|---|
| Comparison with Poisson distribution Blue bars denote a histogram of data divided into 1 sec bins. Red curve is a Poisson curve with rate = median count rate of data. |
 |
 |
| Quadrant-wise count rates Data is divided into 100 sec bins |
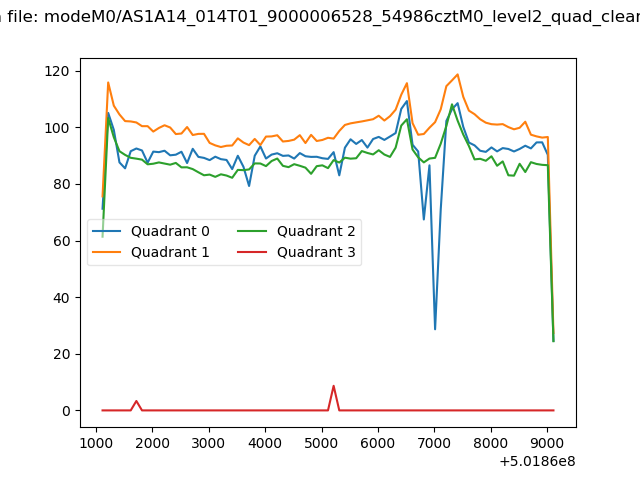 |
|
| Module-wise count rates for Quadrant A Data is divided into 100 sec bins |
 |
 |
| Module-wise count rates for Quadrant B Data is divided into 100 sec bins |
 |
 |
| Module-wise count rates for Quadrant C Data is divided into 100 sec bins |
 |
 |
| Module-wise count rates for Quadrant D Data is divided into 100 sec bins |
 |
 |
| Parameter | Plot |
|---|---|
| CZT HV Monitor |  |
| D_VDD | 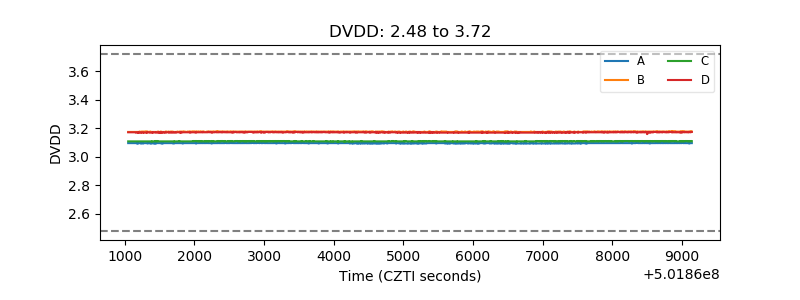 |
| Temperature 1 | 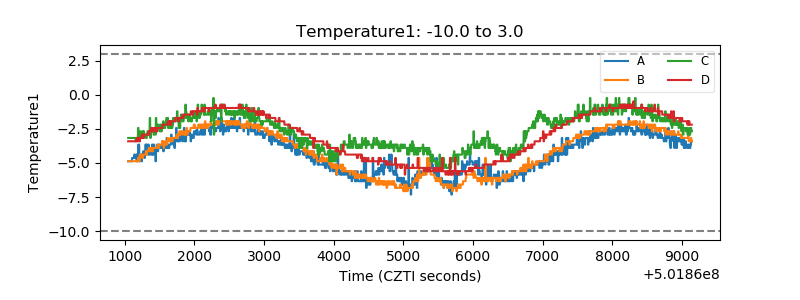 |
| Veto HV Monitor | 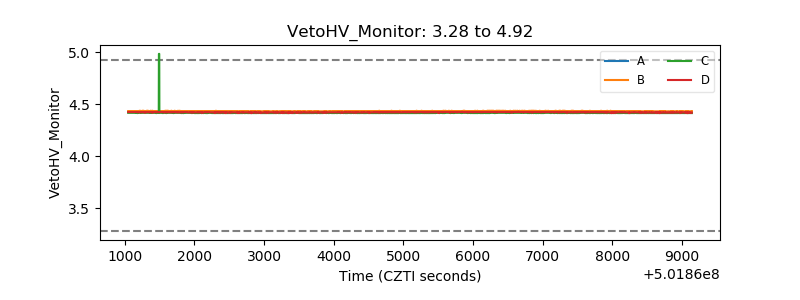 |
| Veto LLD |  |
| Alpha Counter | 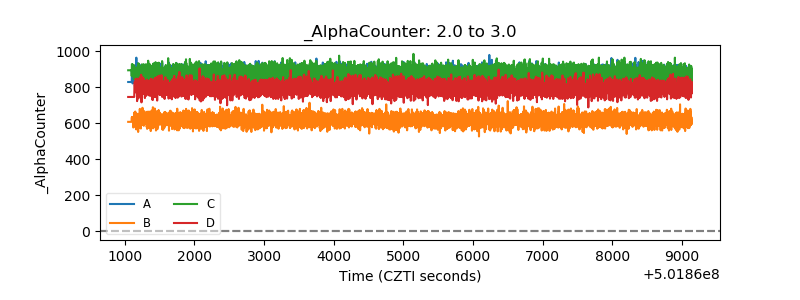 |
| _CPM_Rate | 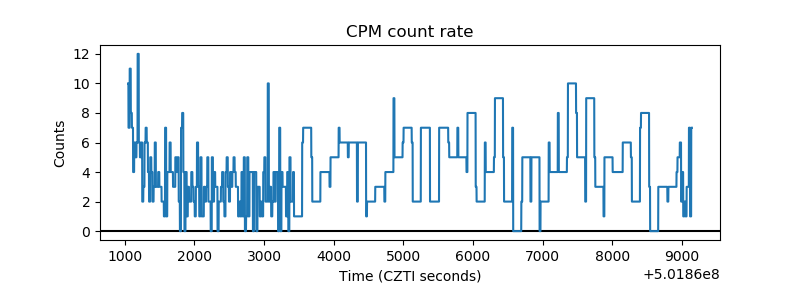 |
| CZT Counter | 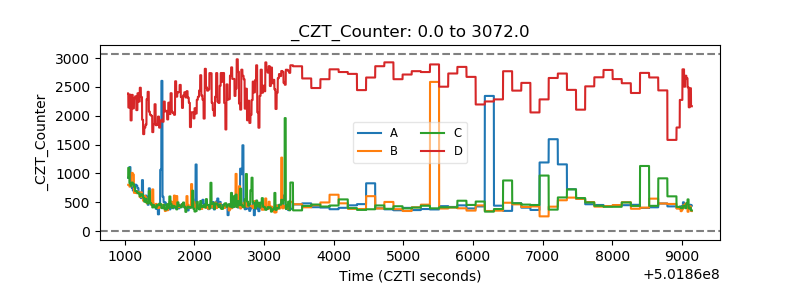 |
| +2.5 Volts monitor |  |
| +5 Volts monitor | 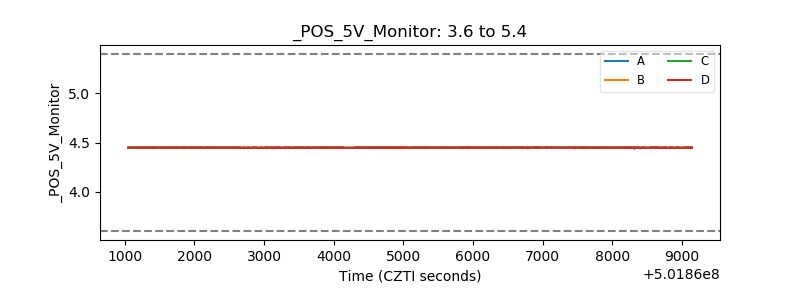 |
| _ROLL_ROT |  |
| _Roll_DEC |  |
| _Roll_RA | 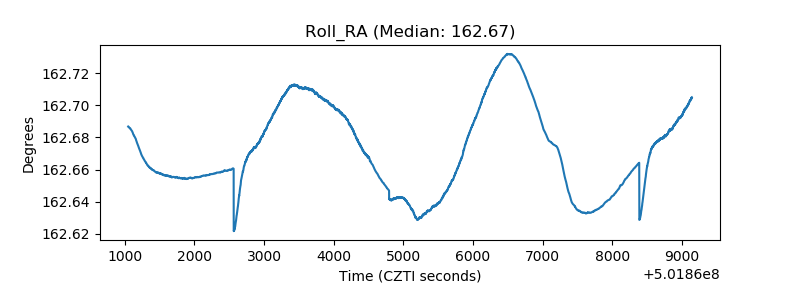 |
| Veto Counter |  |