| Param | Original file | Final file |
|---|---|---|
| Filename | modeM0/AS1A14_014T01_9000006528_54987cztM0_level2.fits | modeM0/AS1A14_014T01_9000006528_54987cztM0_level2_quad_clean.evt |
| Size (bytes) | 402,719,040 | 30,035,520 |
| Size | 384.1 MB | 28.6 MB |
| Events in quadrant A | 1,800,677 | 229,343 |
| Events in quadrant B | 1,763,452 | 248,329 |
| Events in quadrant C | 3,392,995 | 178,106 |
| Events in quadrant D | 7,687,176 | 14,056 |
| Mode M0 | |||
|---|---|---|---|
| Quadrant | BADHDUFLAG | Total packets | Discarded packets |
| A | 0 | 8153 | 406 |
| B | 0 | 8094 | 415 |
| C | 0 | 13888 | 1487 |
| D | 0 | 29066 | 4096 |
| Mode SS | |||
|---|---|---|---|
| Quadrant | BADHDUFLAG | Total packets | Discarded packets |
| A | 0 | 74 | 3 |
| B | 0 | 75 | 1 |
| C | 0 | 79 | 5 |
| D | 0 | 73 | 1 |
| Mode M9 | |||
|---|---|---|---|
| Quadrant | BADHDUFLAG | Total packets | Discarded packets |
| A | 0 | 2 | 2 |
| B | 0 | 1 | 1 |
| C | 1 | 1 | 1 |
| D | 1 | -1 | -1 |
| Quadrant | Total seconds | Saturated seconds | Saturation percentage |
|---|---|---|---|
| A | 3470 | 55 | 1.585014% |
| B | 3447 | 86 | 2.494923% |
| C | 3372 | 866 | 25.682088% |
| D | 3146 | 3033 | 96.408137% |
Noise dominated data is calculated using 1-second bins in cleaned event files. If a bin has >2000 counts, and if more than 50% of those come from <1% of pixels, then it is considered to be noise-dominated and hence unusable.
| Quadrant | # 1 sec bins | Bins with >0 counts | Bins with >2000 counts | High rate bins dominated by noise | Noise dominated (total time) | Noise dominated (detector-on time) | Marked lightcurve |
|---|---|---|---|---|---|---|---|
| A | 3685 | 3627 | 19 | 19 | 0.52% | 0.52% | 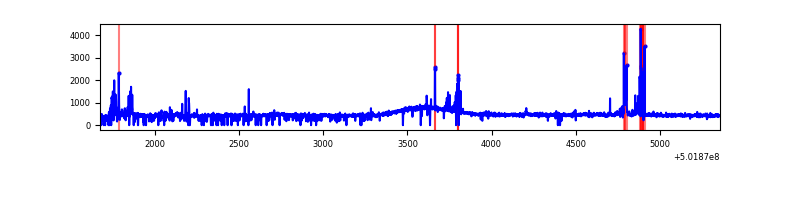 |
| B | 3685 | 3620 | 18 | 18 | 0.49% | 0.50% | 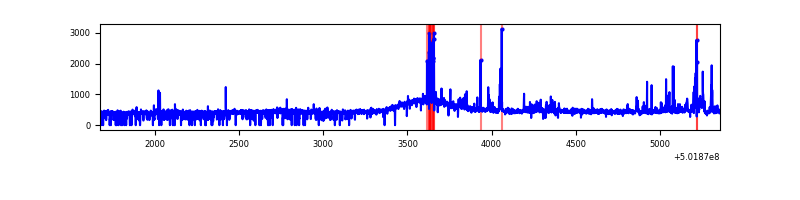 |
| C | 3685 | 3495 | 539 | 539 | 14.63% | 15.42% | 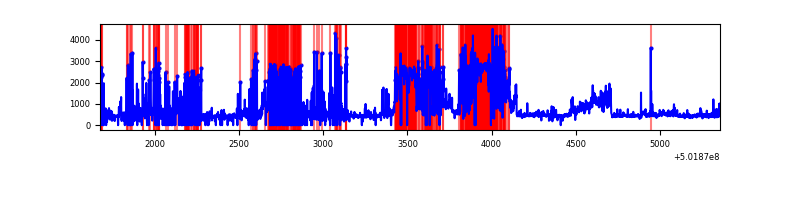 |
| D | 3684 | 3185 | 2747 | 2747 | 74.57% | 86.25% | 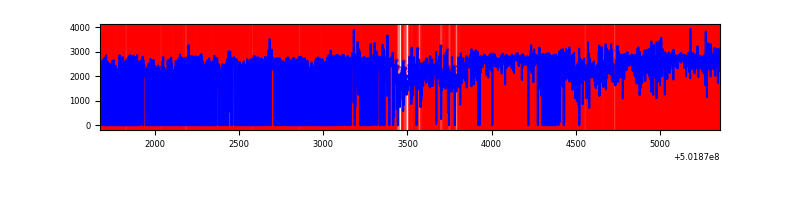 |
Top three noisy pixels from each quadrant. If the there are fewer than three noisy pixels in the level2.evt file, extra rows are filled as -1
| Pixel properties | Quadrant properties | ||||||
|---|---|---|---|---|---|---|---|
| Quadrant | DetID | PixID | Counts | Sigma | Mean | Median | Sigma |
| A | 0 | 8 | 151311 | 1462.48 | 410 | 399 | 103.2 |
| A | 15 | 32 | 18894 | 179.23 | 410 | 399 | 103.2 |
| A | 4 | 3 | 14819 | 139.74 | 410 | 399 | 103.2 |
| B | 0 | 182 | 61101 | 687.96 | 400 | 384 | 88.3 |
| B | 5 | 185 | 50002 | 562.2 | 400 | 384 | 88.3 |
| B | 9 | 251 | 12745 | 140.06 | 400 | 384 | 88.3 |
| C | 13 | 3 | 1958035 | 22911.5 | 310 | 307 | 85.4 |
| C | 6 | 223 | 102038 | 1190.57 | 310 | 307 | 85.4 |
| C | 14 | 254 | 32294 | 374.35 | 310 | 307 | 85.4 |
| D | 15 | 94 | 6547470 | 142506.83 | 158 | 151 | 45.9 |
| D | 2 | 249 | 146300 | 3181.03 | 158 | 151 | 45.9 |
| D | 11 | 129 | 118855 | 2583.67 | 158 | 151 | 45.9 |
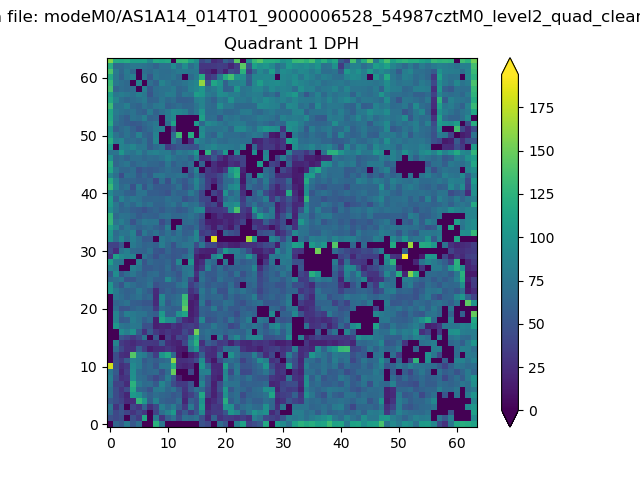
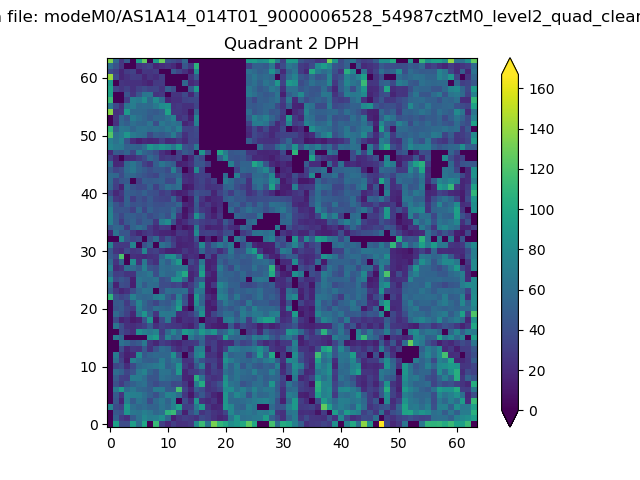
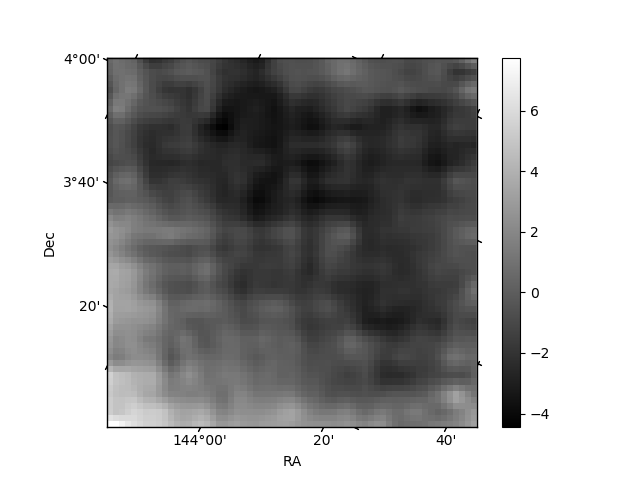
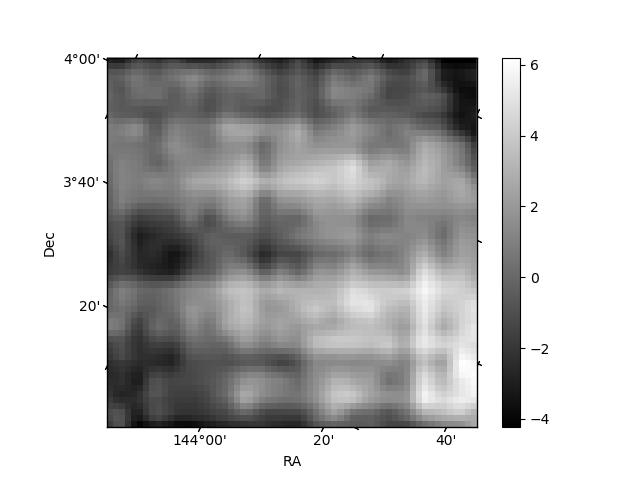
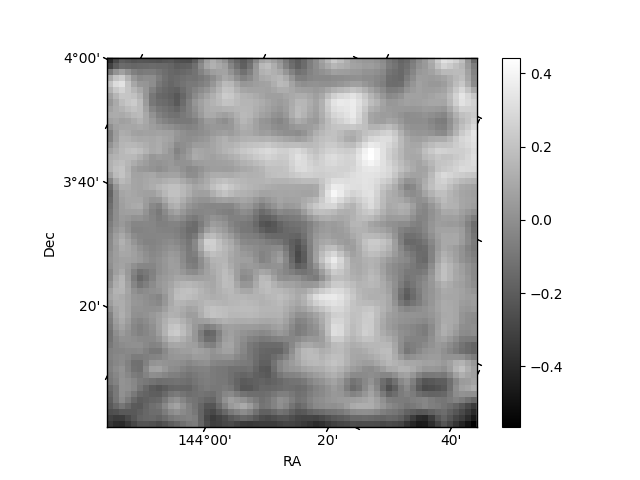
Histogram calculated using DETX and DETY for each event in the final _common_clean file
| Quadrant A |  |
 |
Quadrant B |
|---|---|---|---|
| Quadrant D | 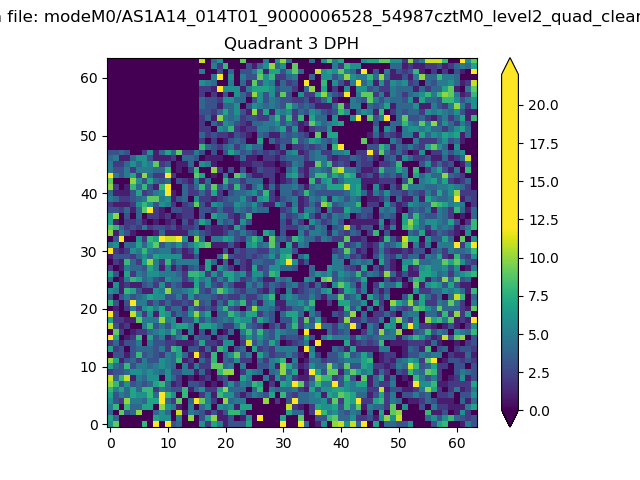 |
 |
Quadrant C |
| Plot type | Count rate plots | Images |
|---|---|---|
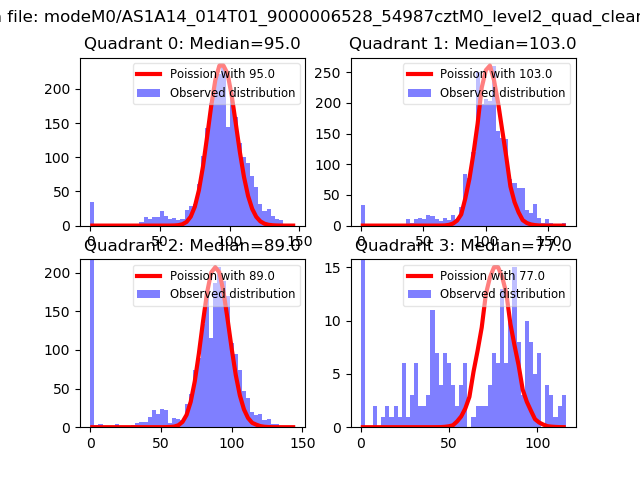
| Comparison with Poisson distribution Blue bars denote a histogram of data divided into 1 sec bins. Red curve is a Poisson curve with rate = median count rate of data. |
 |
 |
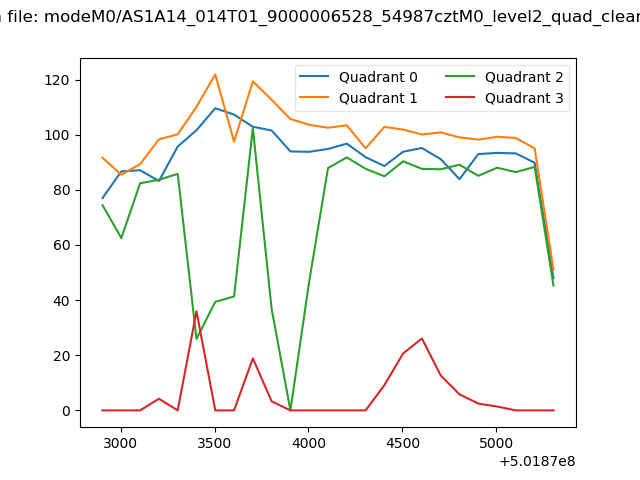
| Quadrant-wise count rates Data is divided into 100 sec bins |
 |
|
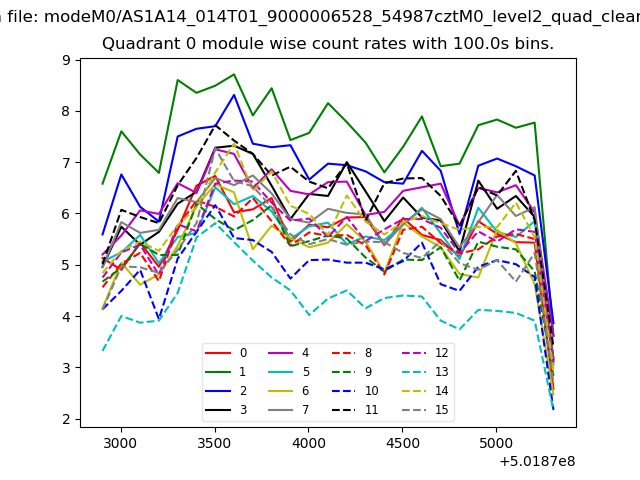
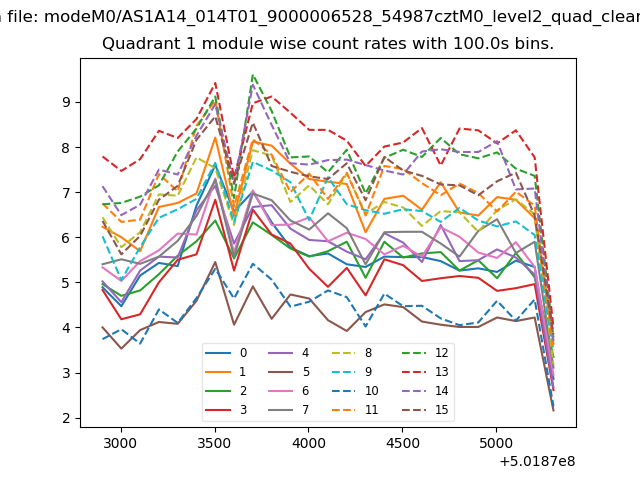
| Module-wise count rates for Quadrant A Data is divided into 100 sec bins |
 |
 |
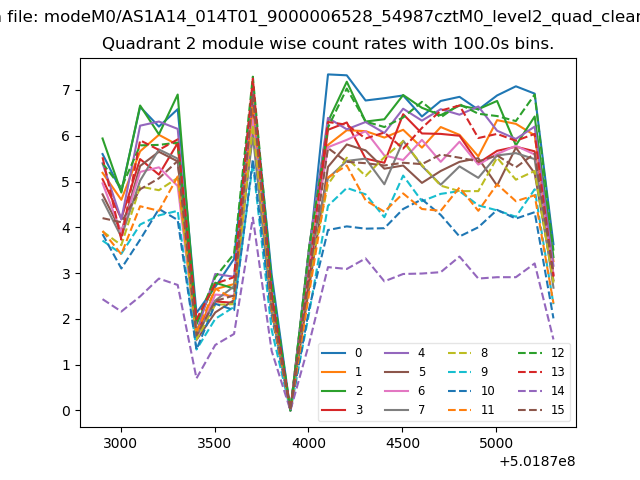
| Module-wise count rates for Quadrant B Data is divided into 100 sec bins |
 |
 |
| Module-wise count rates for Quadrant C Data is divided into 100 sec bins |
 |
 |
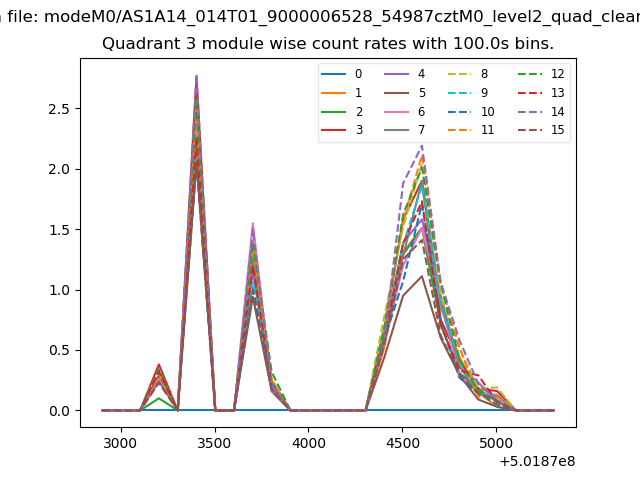
| Module-wise count rates for Quadrant D Data is divided into 100 sec bins |
 |
 |
| Parameter | Plot |
|---|---|
| CZT HV Monitor | 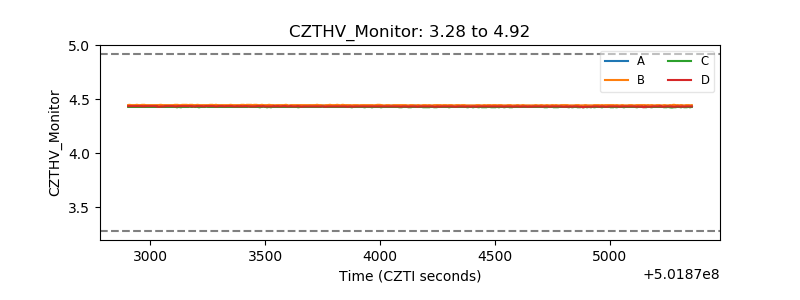 |
| D_VDD | 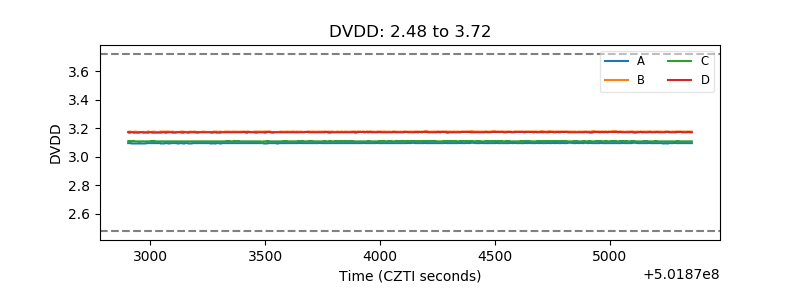 |
| Temperature 1 | 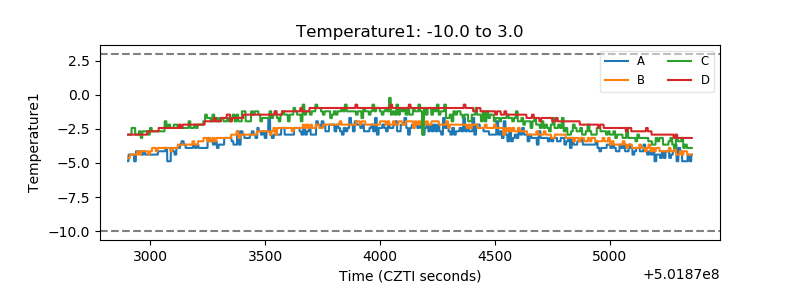 |
| Veto HV Monitor | 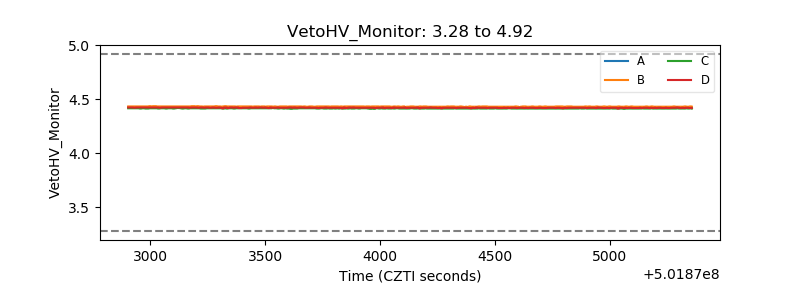 |
| Veto LLD |  |
| Alpha Counter |  |
| _CPM_Rate | 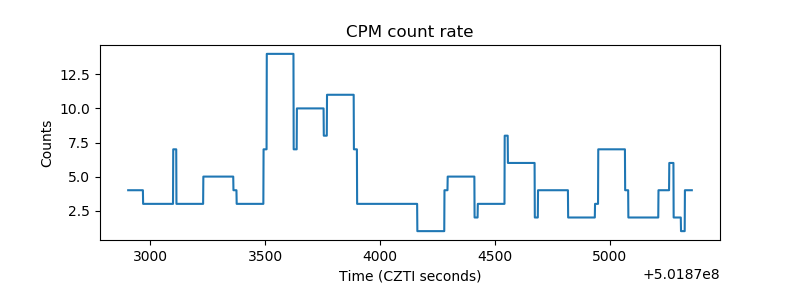 |
| CZT Counter | 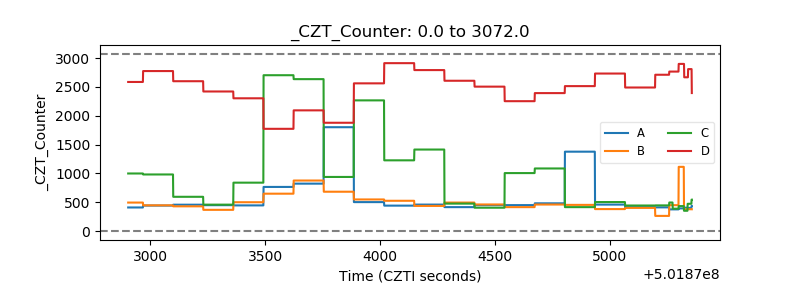 |
| +2.5 Volts monitor |  |
| +5 Volts monitor |  |
| _ROLL_ROT | 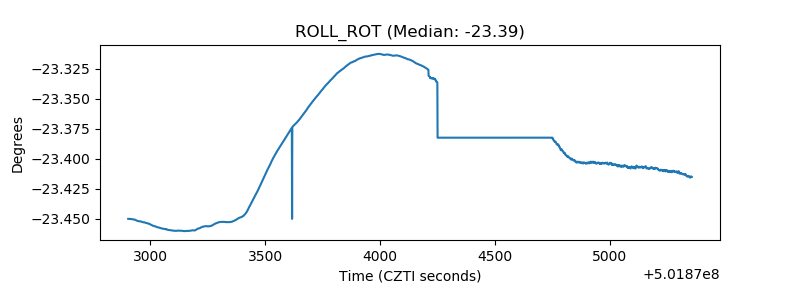 |
| _Roll_DEC | 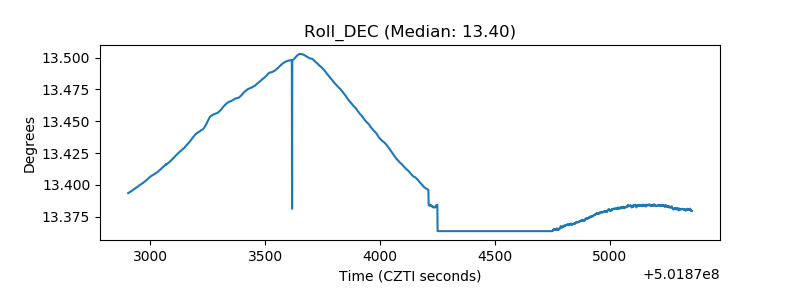 |
| _Roll_RA |  |
| Veto Counter | 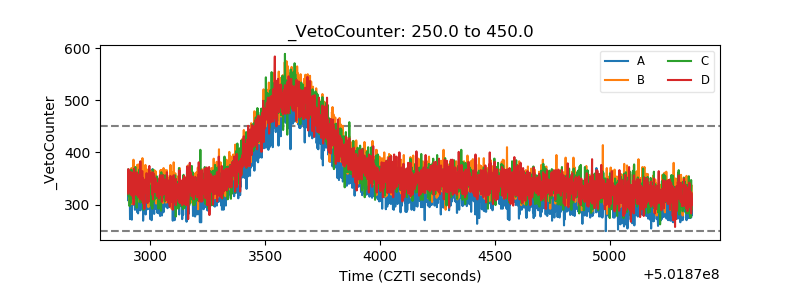 |