| Param | Original file | Final file |
|---|---|---|
| Filename | modeM0/AS1A14_014T01_9000006528_54993cztM0_level2.fits | modeM0/AS1A14_014T01_9000006528_54993cztM0_level2_quad_clean.evt |
| Size (bytes) | 1,435,072,320 | 120,193,920 |
| Size | 1.3 GB | 114.6 MB |
| Events in quadrant A | 12,348,623 | 760,087 |
| Events in quadrant B | 6,803,228 | 1,090,939 |
| Events in quadrant C | 5,866,599 | 968,013 |
| Events in quadrant D | 27,264,300 | 69,802 |
| Mode M0 | |||
|---|---|---|---|
| Quadrant | BADHDUFLAG | Total packets | Discarded packets |
| A | 0 | 44211 | 11 |
| B | 0 | 27947 | 8 |
| C | 0 | 25437 | 2 |
| D | 0 | 88430 | 9 |
| Mode SS | |||
|---|---|---|---|
| Quadrant | BADHDUFLAG | Total packets | Discarded packets |
| A | 0 | 218 | 0 |
| B | 0 | 218 | 0 |
| C | 0 | 218 | 0 |
| D | 0 | 218 | 0 |
| Mode M9 | |||
|---|---|---|---|
| Quadrant | BADHDUFLAG | Total packets | Discarded packets |
| A | 0 | 21 | 0 |
| B | 0 | 21 | 0 |
| C | 0 | 21 | 0 |
| D | 0 | 21 | 0 |
| Quadrant | Total seconds | Saturated seconds | Saturation percentage |
|---|---|---|---|
| A | 10844 | 3105 | 28.633346% |
| B | 10844 | 335 | 3.089266% |
| C | 10845 | 234 | 2.157676% |
| D | 10844 | 10209 | 94.144227% |
Noise dominated data is calculated using 1-second bins in cleaned event files. If a bin has >2000 counts, and if more than 50% of those come from <1% of pixels, then it is considered to be noise-dominated and hence unusable.
| Quadrant | # 1 sec bins | Bins with >0 counts | Bins with >2000 counts | High rate bins dominated by noise | Noise dominated (total time) | Noise dominated (detector-on time) | Marked lightcurve |
|---|---|---|---|---|---|---|---|
| A | 12810 | 10847 | 2847 | 2847 | 22.22% | 26.25% | 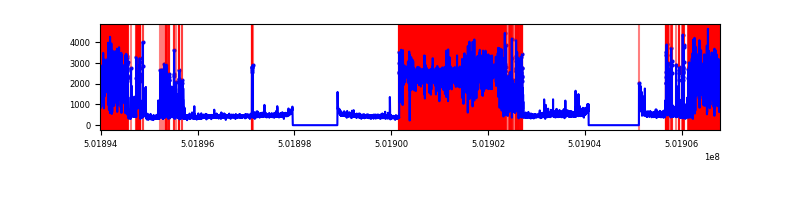 |
| B | 12810 | 10847 | 333 | 333 | 2.60% | 3.07% | 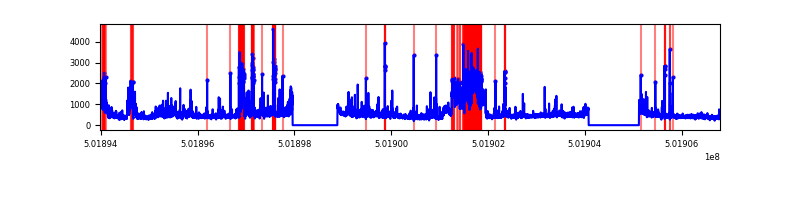 |
| C | 12810 | 10847 | 197 | 197 | 1.54% | 1.82% | 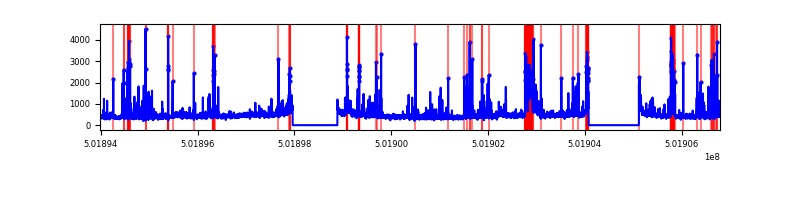 |
| D | 12809 | 10844 | 9678 | 9678 | 75.56% | 89.25% | 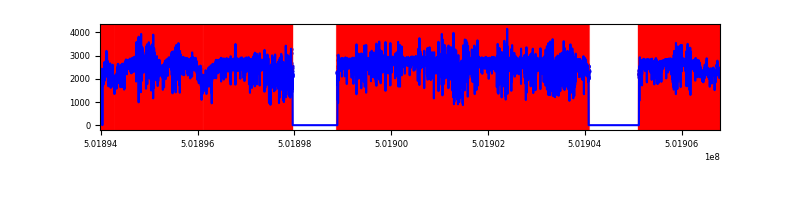 |
Top three noisy pixels from each quadrant. If the there are fewer than three noisy pixels in the level2.evt file, extra rows are filled as -1
| Pixel properties | Quadrant properties | ||||||
|---|---|---|---|---|---|---|---|
| Quadrant | DetID | PixID | Counts | Sigma | Mean | Median | Sigma |
| A | 15 | 32 | 7606862 | 31950.08 | 965 | 943 | 238.1 |
| A | 0 | 8 | 721217 | 3025.65 | 965 | 943 | 238.1 |
| A | 3 | 14 | 151526 | 632.55 | 965 | 943 | 238.1 |
| B | 5 | 236 | 1790335 | 7505.93 | 1119 | 1079 | 238.4 |
| B | 10 | 247 | 146003 | 607.95 | 1119 | 1079 | 238.4 |
| B | 10 | 245 | 141567 | 589.35 | 1119 | 1079 | 238.4 |
| C | 13 | 3 | 656933 | 2157.44 | 1101 | 1092 | 304.0 |
| C | 6 | 223 | 285140 | 934.4 | 1101 | 1092 | 304.0 |
| C | 14 | 254 | 169420 | 553.73 | 1101 | 1092 | 304.0 |
| D | 15 | 94 | 23984660 | 187812.37 | 445 | 426 | 127.7 |
| D | 11 | 129 | 300365 | 2348.72 | 445 | 426 | 127.7 |
| D | 2 | 249 | 283256 | 2214.75 | 445 | 426 | 127.7 |
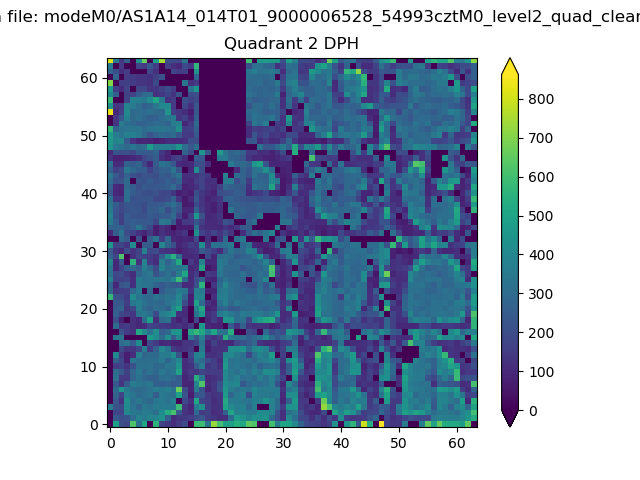
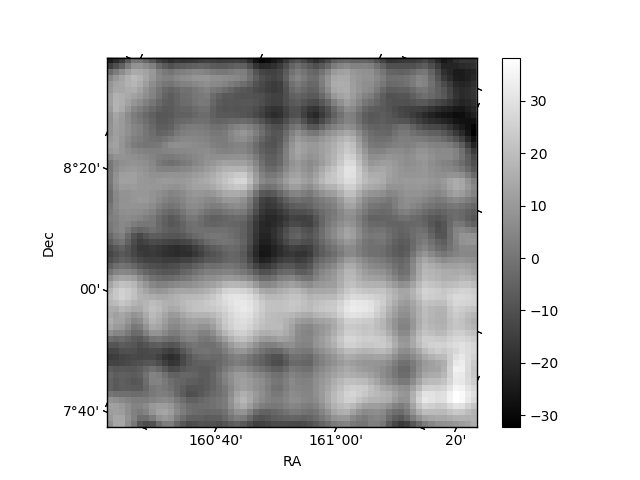
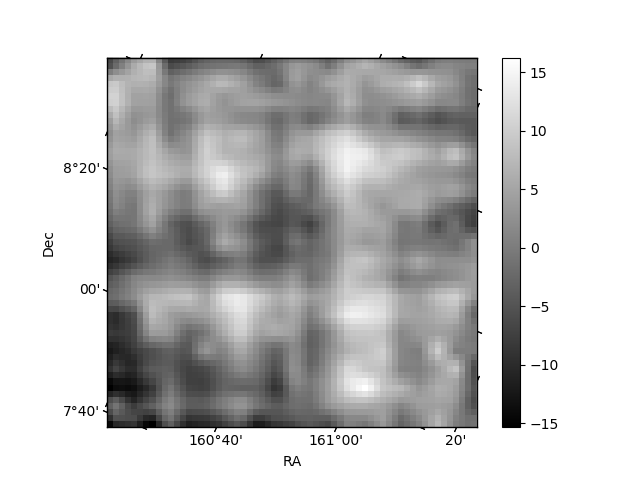
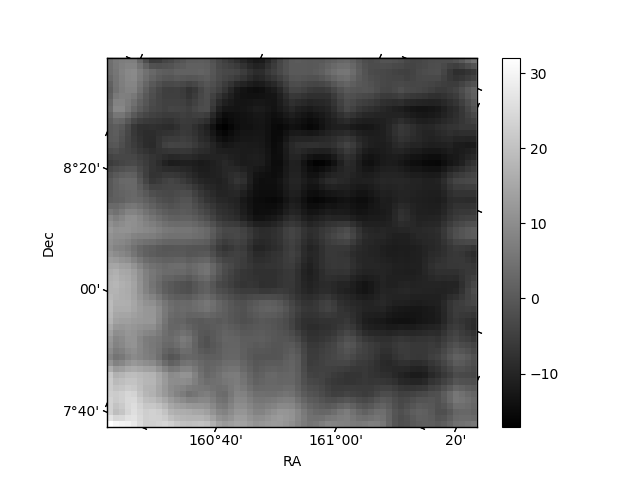
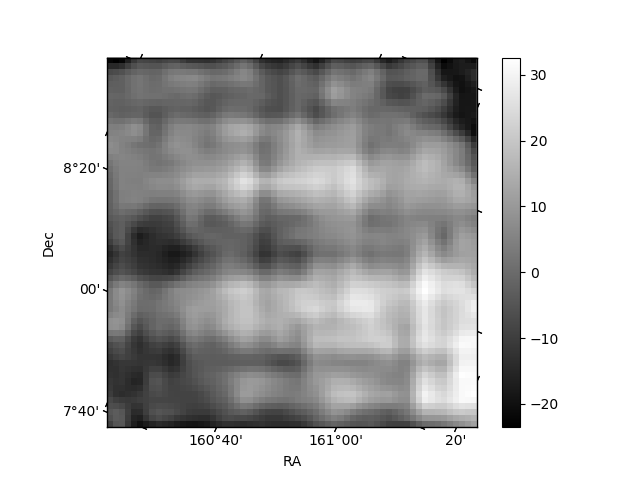
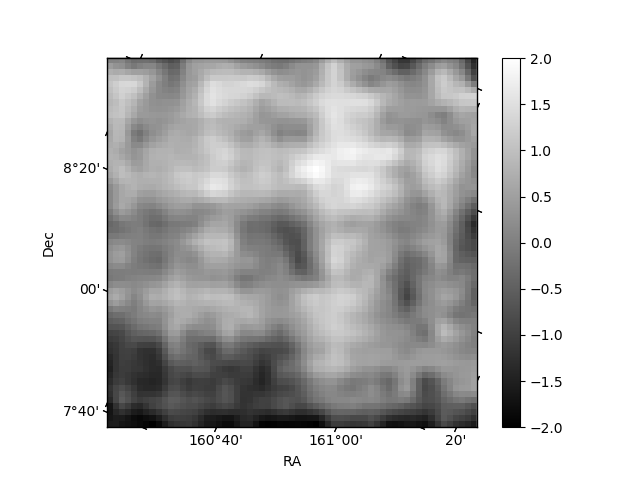
Histogram calculated using DETX and DETY for each event in the final _common_clean file
| Quadrant A | 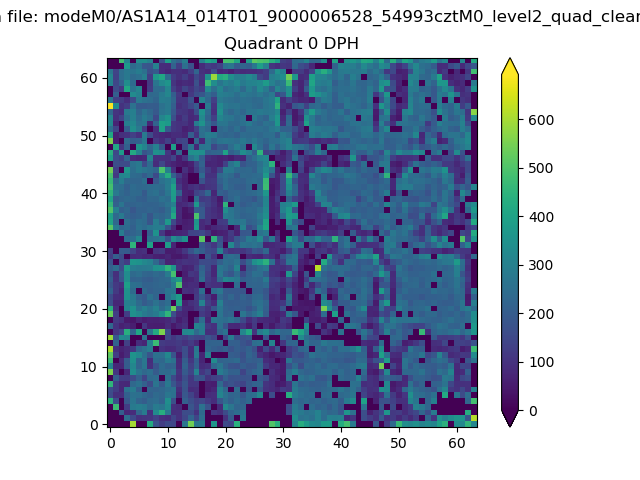 |
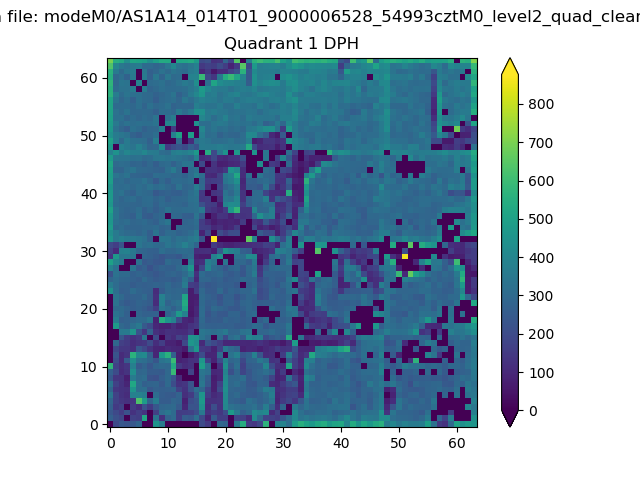 |
Quadrant B |
|---|---|---|---|
| Quadrant D | 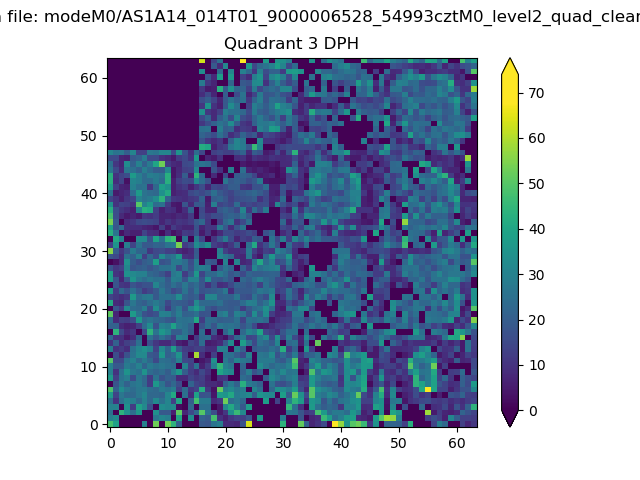 |
 |
Quadrant C |
| Plot type | Count rate plots | Images |
|---|---|---|
| Comparison with Poisson distribution Blue bars denote a histogram of data divided into 1 sec bins. Red curve is a Poisson curve with rate = median count rate of data. |
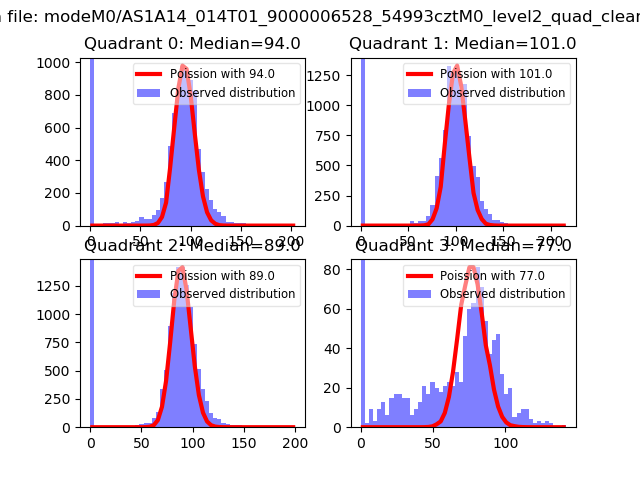 |
 |
| Quadrant-wise count rates Data is divided into 100 sec bins |
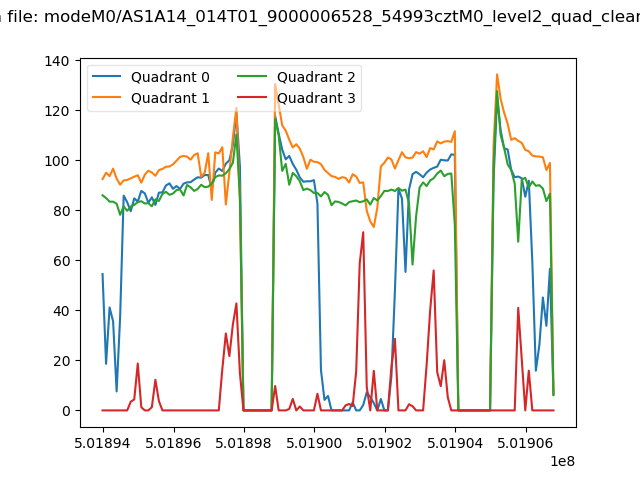 |
|
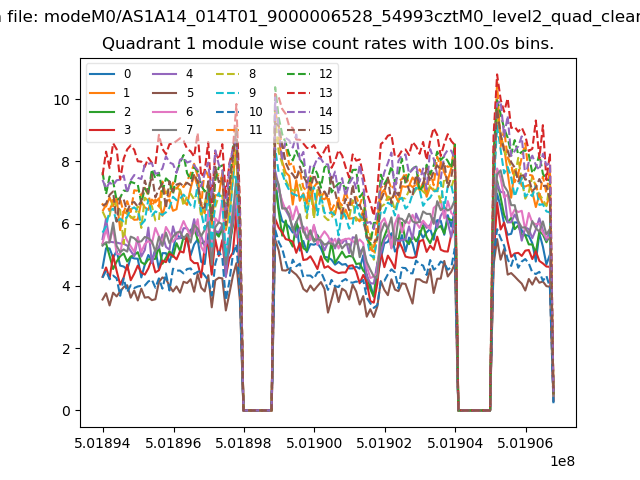
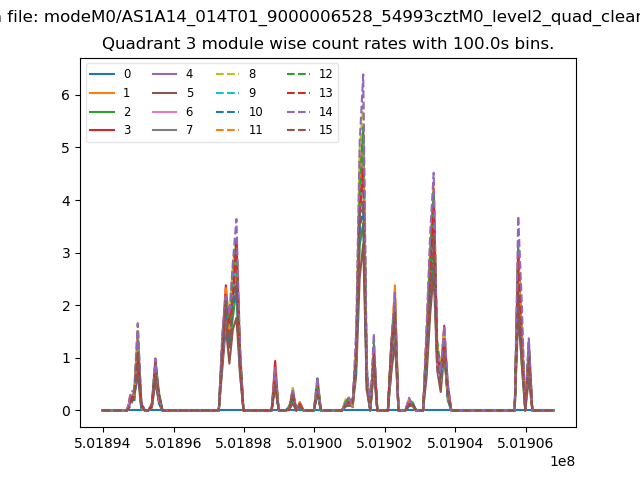
| Module-wise count rates for Quadrant A Data is divided into 100 sec bins |
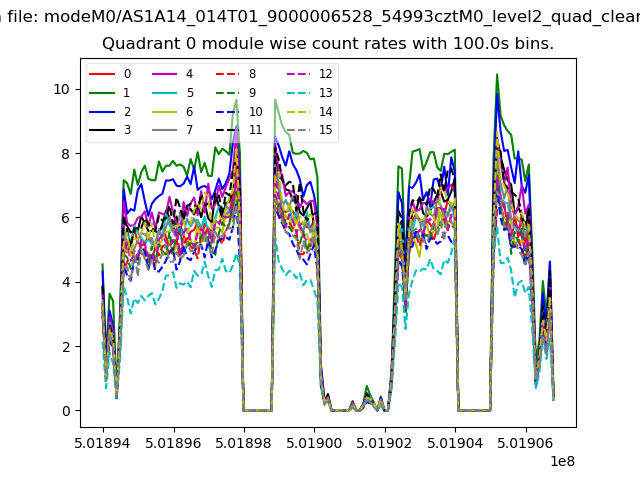 |
 |
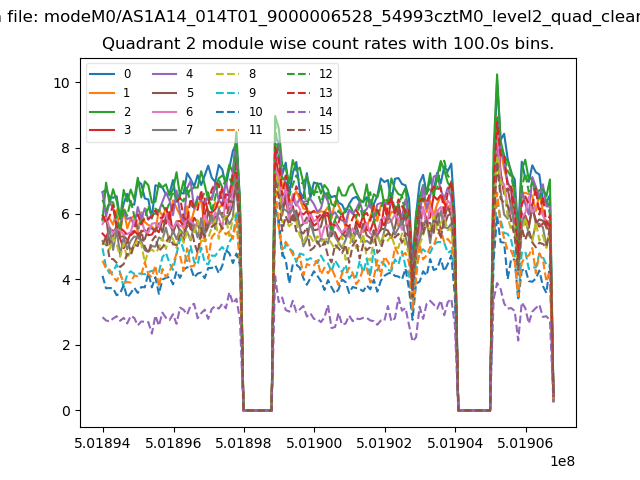
| Module-wise count rates for Quadrant B Data is divided into 100 sec bins |
 |
 |
| Module-wise count rates for Quadrant C Data is divided into 100 sec bins |
 |
 |
| Module-wise count rates for Quadrant D Data is divided into 100 sec bins |
 |
 |
| Parameter | Plot |
|---|---|
| CZT HV Monitor | 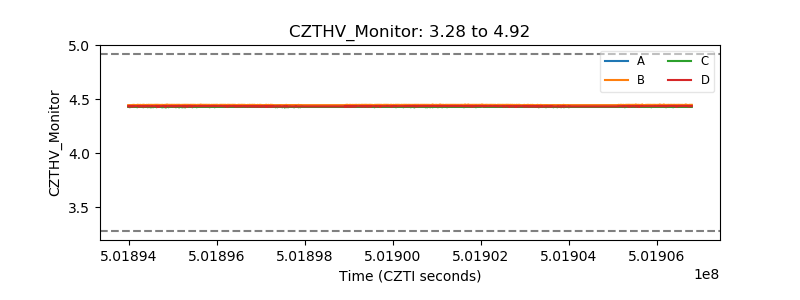 |
| D_VDD | 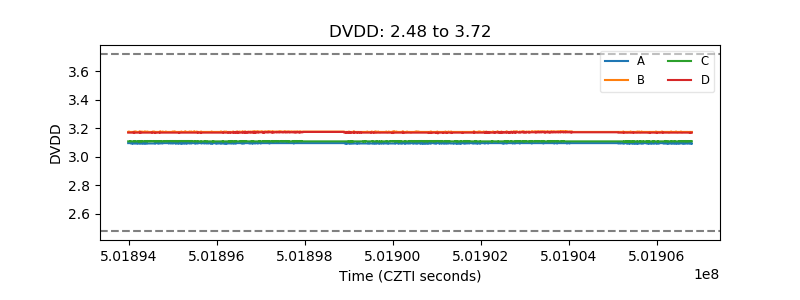 |
| Temperature 1 | 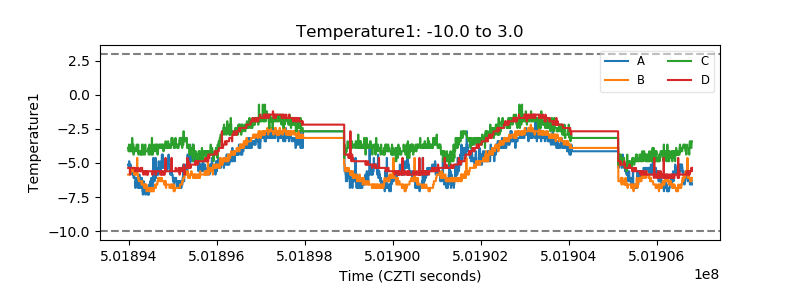 |
| Veto HV Monitor | 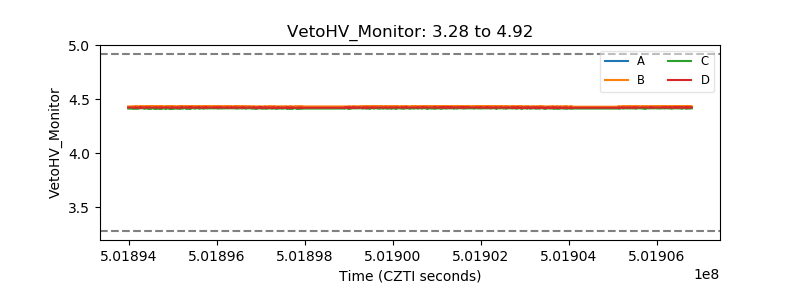 |
| Veto LLD | 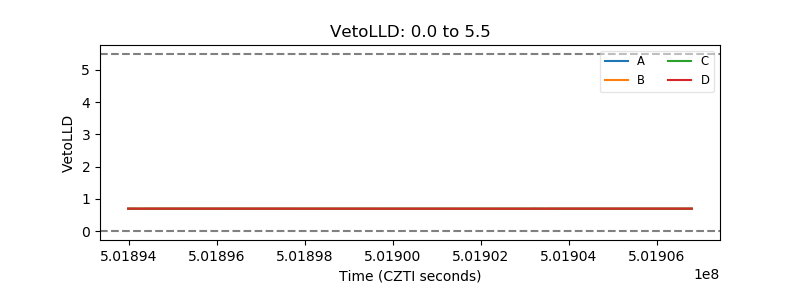 |
| Alpha Counter | 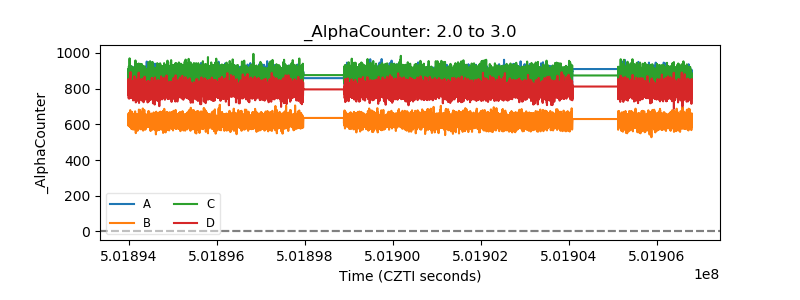 |
| _CPM_Rate | 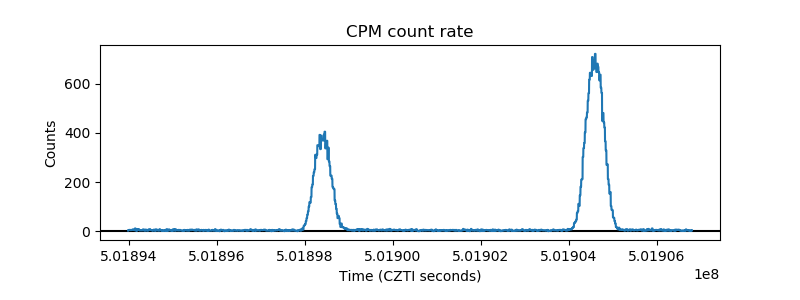 |
| CZT Counter |  |
| +2.5 Volts monitor |  |
| +5 Volts monitor |  |
| _ROLL_ROT | 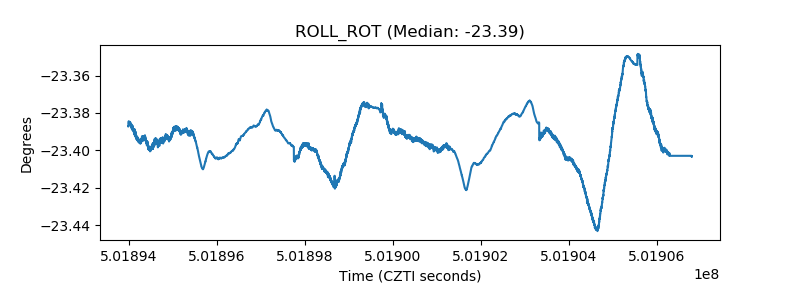 |
| _Roll_DEC | 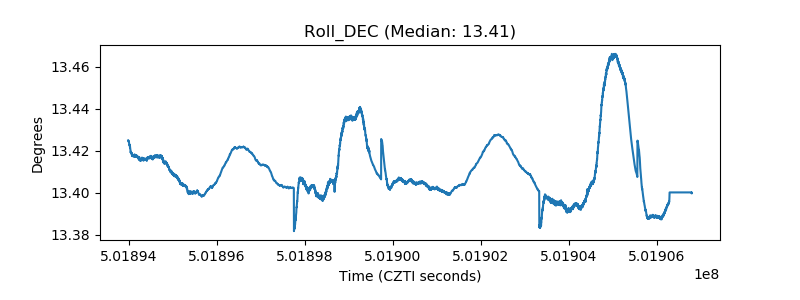 |
| _Roll_RA | 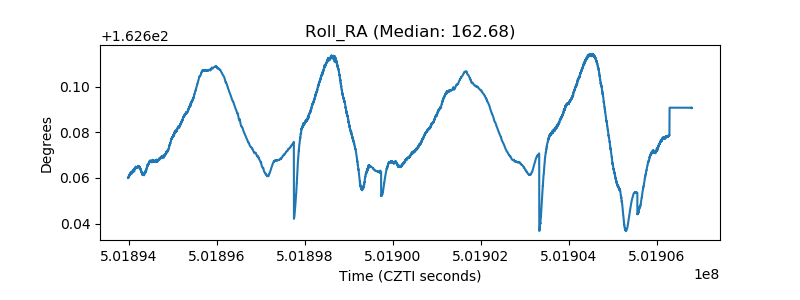 |
| Veto Counter | 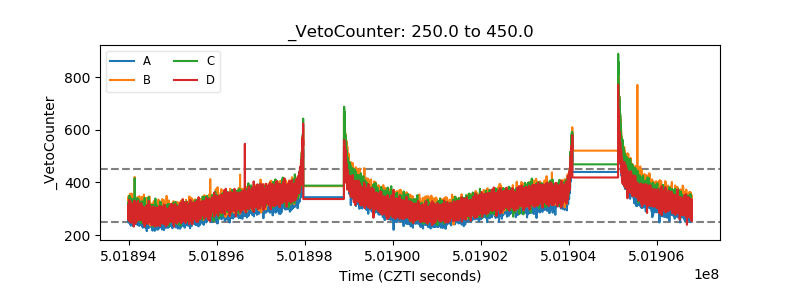 |