| Param | Original file | Final file |
|---|---|---|
| Filename | modeM0/AS1A14_014T01_9000006528_54995cztM0_level2.fits | modeM0/AS1A14_014T01_9000006528_54995cztM0_level2_quad_clean.evt |
| Size (bytes) | 736,761,600 | 75,648,960 |
| Size | 702.6 MB | 72.1 MB |
| Events in quadrant A | 4,338,429 | 564,791 |
| Events in quadrant B | 3,256,276 | 664,531 |
| Events in quadrant C | 3,178,672 | 592,354 |
| Events in quadrant D | 16,008,787 | 28,750 |
| Mode M0 | |||
|---|---|---|---|
| Quadrant | BADHDUFLAG | Total packets | Discarded packets |
| A | 0 | 17249 | 1 |
| B | 0 | 14256 | 1 |
| C | 0 | 14071 | 1 |
| D | 0 | 51826 | 3 |
| Mode SS | |||
|---|---|---|---|
| Quadrant | BADHDUFLAG | Total packets | Discarded packets |
| A | 0 | 130 | 0 |
| B | 0 | 130 | 0 |
| C | 0 | 130 | 0 |
| D | 0 | 130 | 0 |
| Mode M9 | |||
|---|---|---|---|
| Quadrant | BADHDUFLAG | Total packets | Discarded packets |
| A | 0 | 11 | 0 |
| B | 0 | 11 | 0 |
| C | 0 | 11 | 0 |
| D | 0 | 11 | 0 |
| Quadrant | Total seconds | Saturated seconds | Saturation percentage |
|---|---|---|---|
| A | 6301 | 579 | 9.189018% |
| B | 6302 | 160 | 2.538877% |
| C | 6302 | 54 | 0.856871% |
| D | 6301 | 6040 | 95.857800% |
Noise dominated data is calculated using 1-second bins in cleaned event files. If a bin has >2000 counts, and if more than 50% of those come from <1% of pixels, then it is considered to be noise-dominated and hence unusable.
| Quadrant | # 1 sec bins | Bins with >0 counts | Bins with >2000 counts | High rate bins dominated by noise | Noise dominated (total time) | Noise dominated (detector-on time) | Marked lightcurve |
|---|---|---|---|---|---|---|---|
| A | 7451 | 6302 | 474 | 474 | 6.36% | 7.52% | 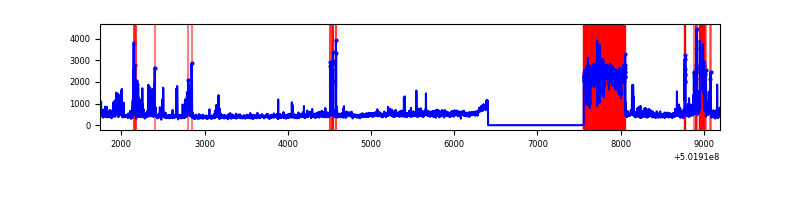 |
| B | 7452 | 6303 | 91 | 91 | 1.22% | 1.44% |  |
| C | 7452 | 6303 | 38 | 38 | 0.51% | 0.60% | 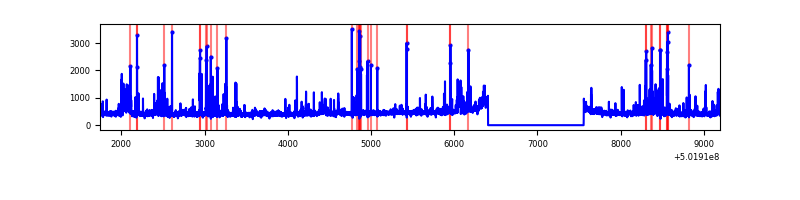 |
| D | 7450 | 6300 | 5799 | 5799 | 77.84% | 92.05% | 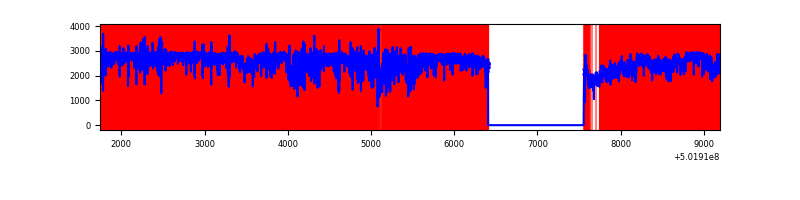 |
Top three noisy pixels from each quadrant. If the there are fewer than three noisy pixels in the level2.evt file, extra rows are filled as -1
| Pixel properties | Quadrant properties | ||||||
|---|---|---|---|---|---|---|---|
| Quadrant | DetID | PixID | Counts | Sigma | Mean | Median | Sigma |
| A | 15 | 32 | 1341730 | 8514.92 | 638 | 622 | 157.5 |
| A | 3 | 14 | 262635 | 1663.56 | 638 | 622 | 157.5 |
| A | 0 | 8 | 118525 | 748.59 | 638 | 622 | 157.5 |
| B | 10 | 245 | 414040 | 2855.47 | 673 | 651 | 144.8 |
| B | 5 | 236 | 132427 | 910.24 | 673 | 651 | 144.8 |
| B | 12 | 111 | 17608 | 117.13 | 673 | 651 | 144.8 |
| C | 13 | 3 | 175126 | 952.33 | 663 | 657 | 183.2 |
| C | 6 | 223 | 103429 | 560.98 | 663 | 657 | 183.2 |
| C | 14 | 96 | 96738 | 524.45 | 663 | 657 | 183.2 |
| D | 15 | 94 | 14690916 | 228741.7 | 219 | 208 | 64.2 |
| D | 3 | 12 | 157200 | 2444.44 | 219 | 208 | 64.2 |
| D | 2 | 62 | 91101 | 1415.25 | 219 | 208 | 64.2 |
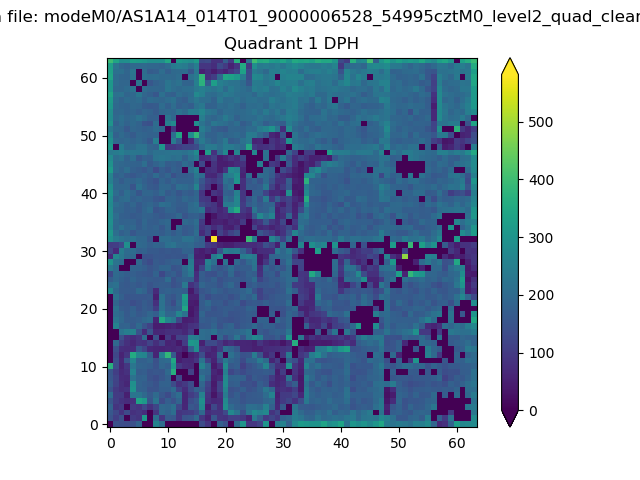
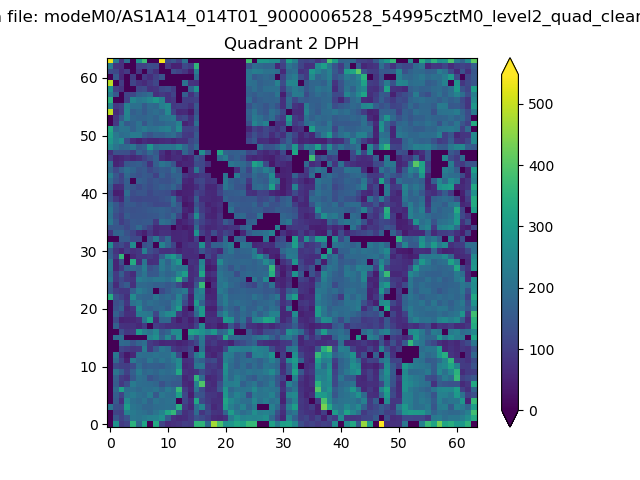
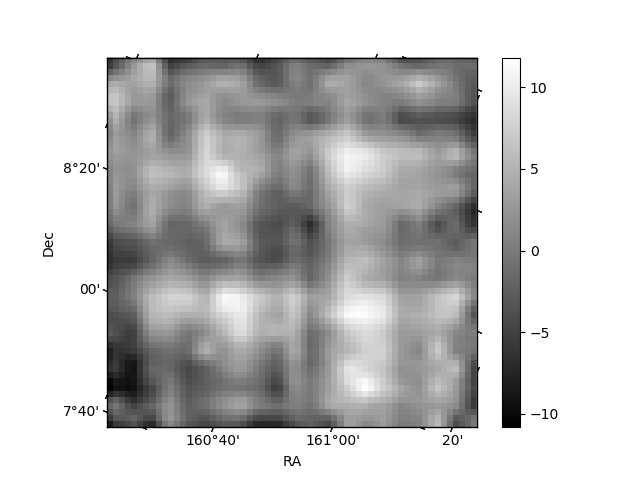
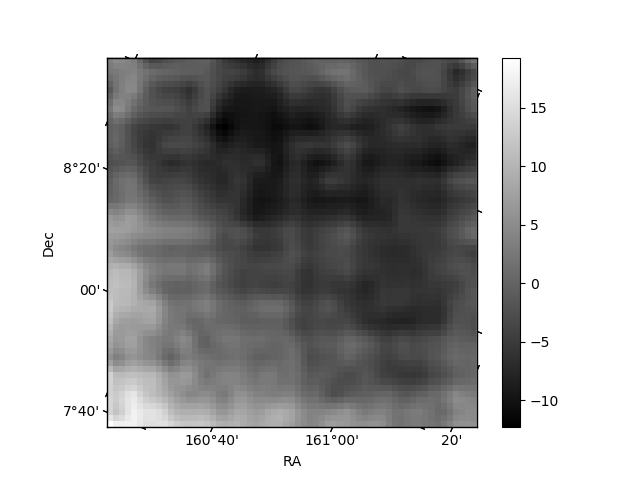
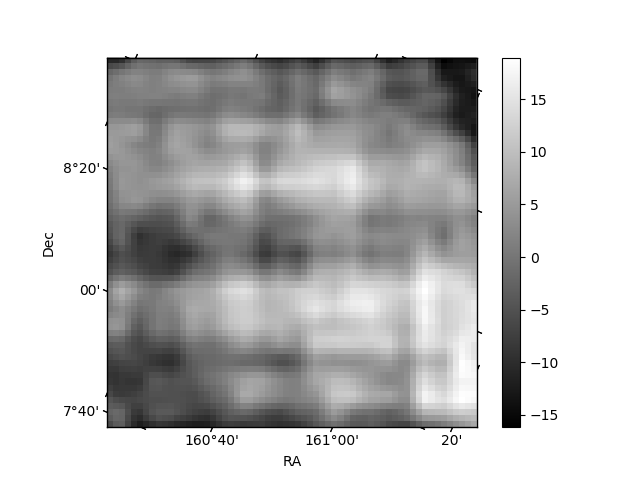
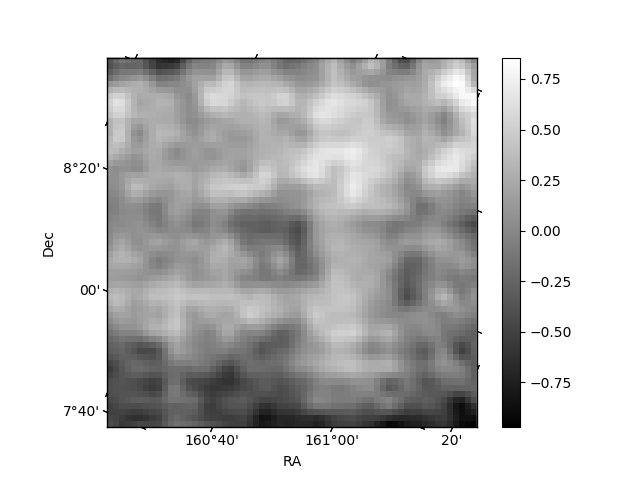
Histogram calculated using DETX and DETY for each event in the final _common_clean file
| Quadrant A | 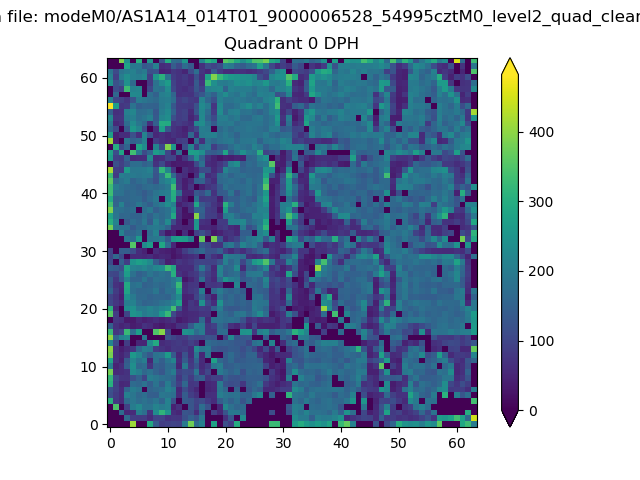 |
 |
Quadrant B |
|---|---|---|---|
| Quadrant D | 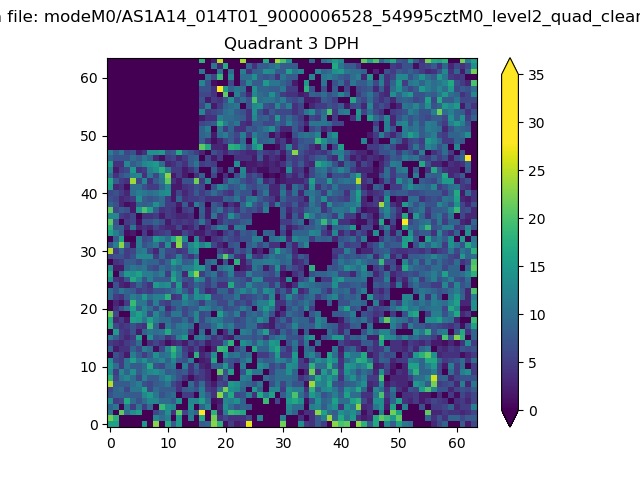 |
 |
Quadrant C |
| Plot type | Count rate plots | Images |
|---|---|---|
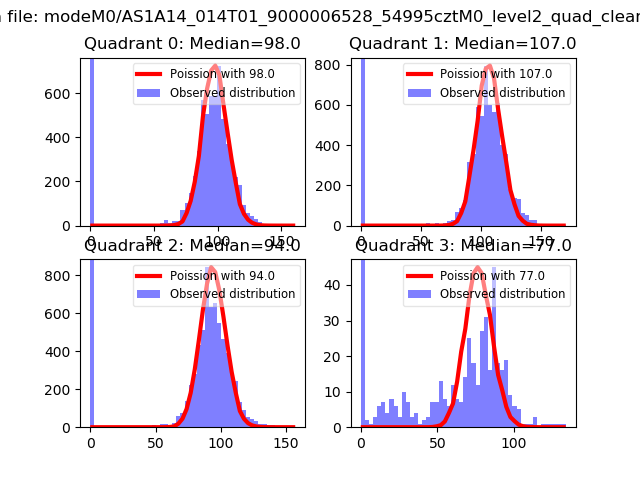
| Comparison with Poisson distribution Blue bars denote a histogram of data divided into 1 sec bins. Red curve is a Poisson curve with rate = median count rate of data. |
 |
 |
| Quadrant-wise count rates Data is divided into 100 sec bins |
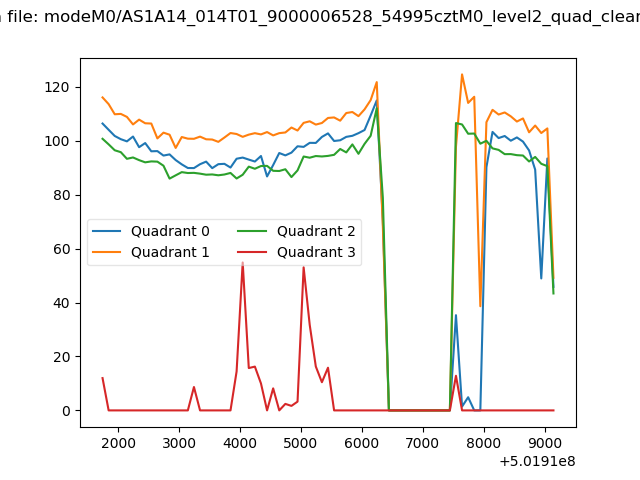 |
|
| Module-wise count rates for Quadrant A Data is divided into 100 sec bins |
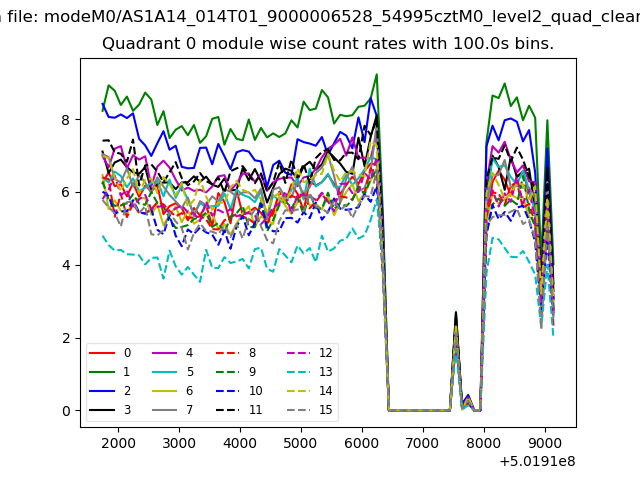 |
 |
| Module-wise count rates for Quadrant B Data is divided into 100 sec bins |
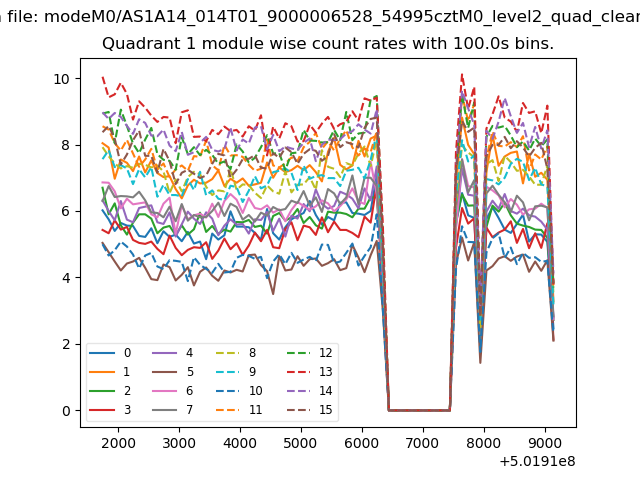 |
 |
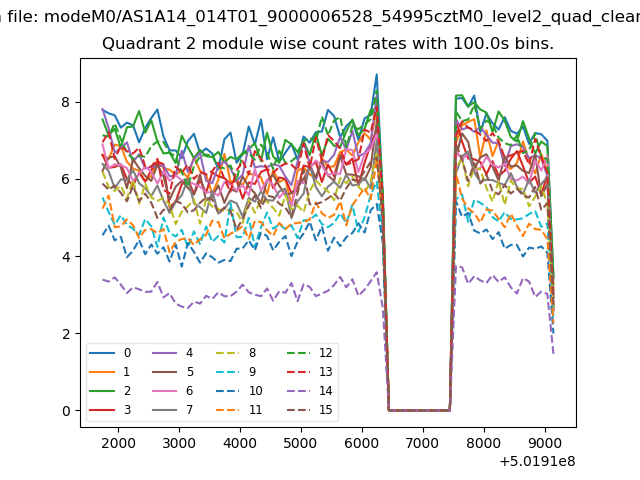
| Module-wise count rates for Quadrant C Data is divided into 100 sec bins |
 |
 |
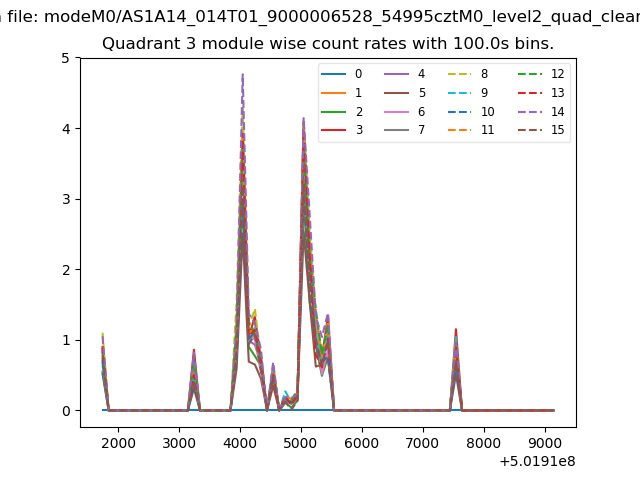
| Module-wise count rates for Quadrant D Data is divided into 100 sec bins |
 |
 |
| Parameter | Plot |
|---|---|
| CZT HV Monitor | 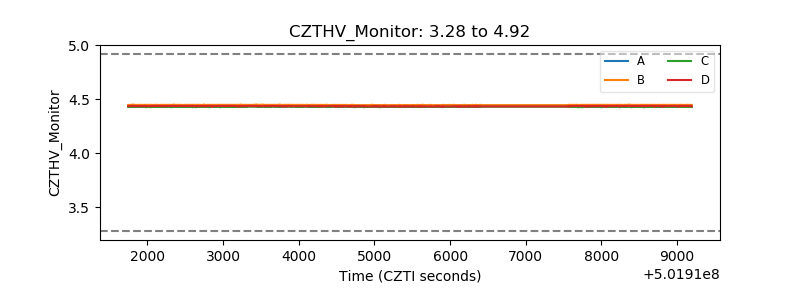 |
| D_VDD | 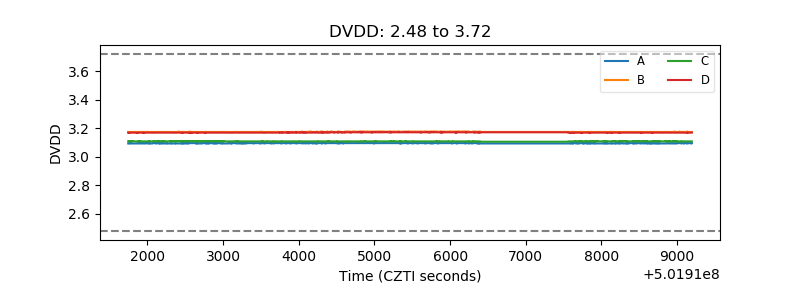 |
| Temperature 1 | 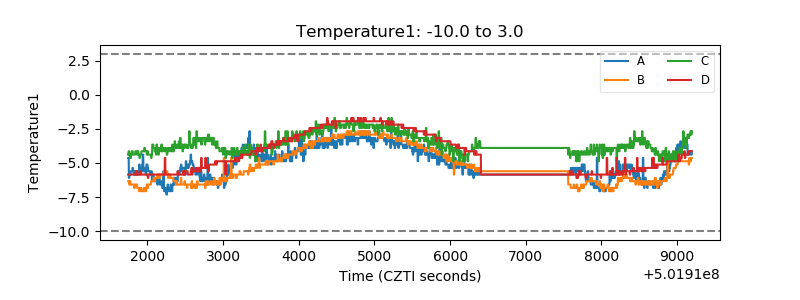 |
| Veto HV Monitor | 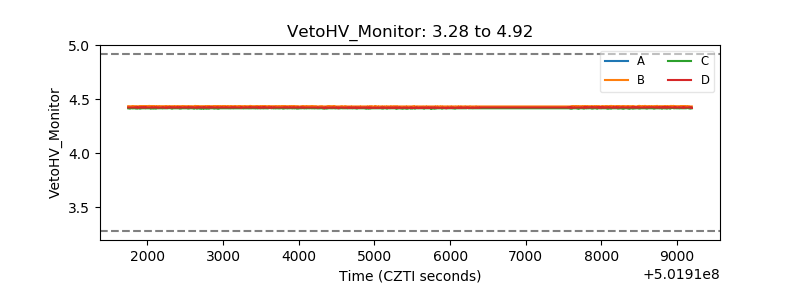 |
| Veto LLD | 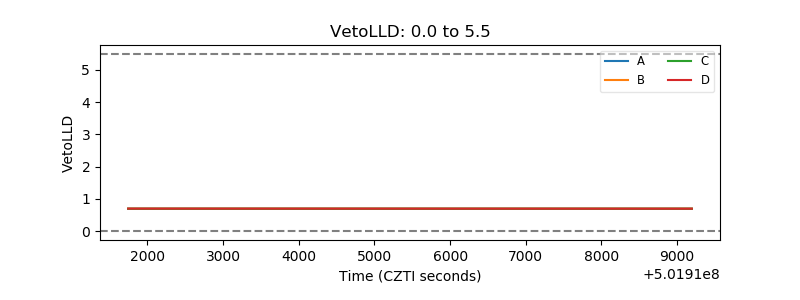 |
| Alpha Counter | 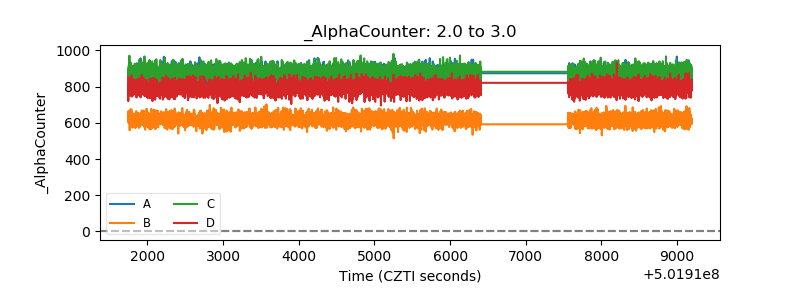 |
| _CPM_Rate | 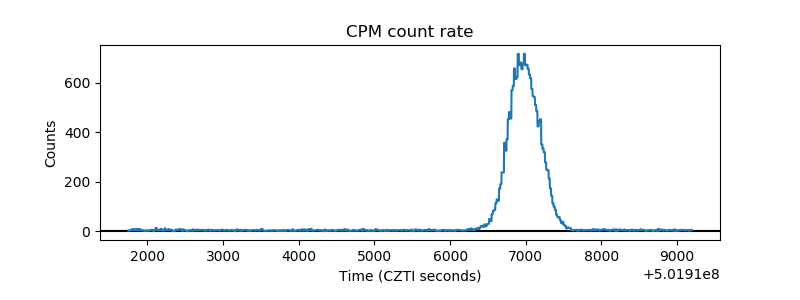 |
| CZT Counter | 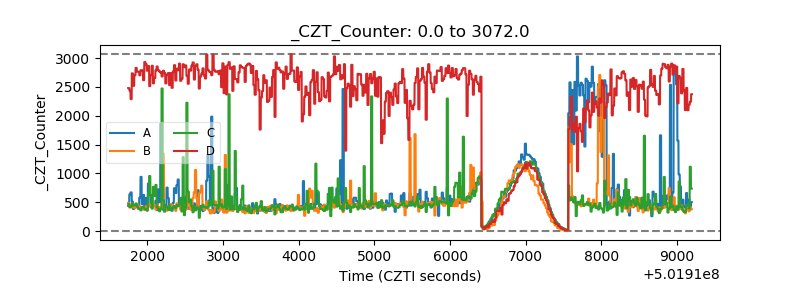 |
| +2.5 Volts monitor |  |
| +5 Volts monitor |  |
| _ROLL_ROT | 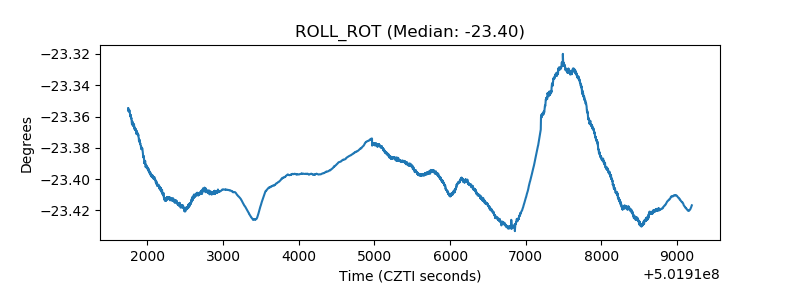 |
| _Roll_DEC | 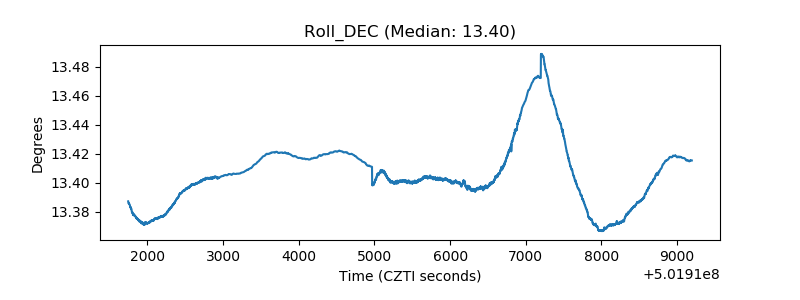 |
| _Roll_RA | 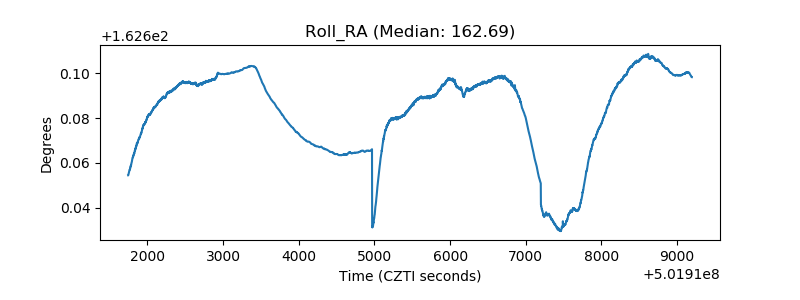 |
| Veto Counter | 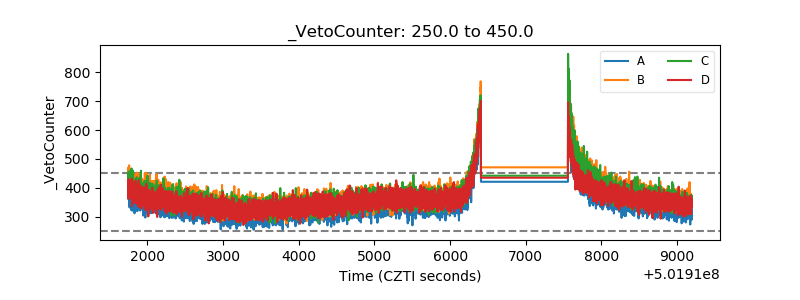 |