| Param | Original file | Final file |
|---|---|---|
| Filename | modeM0/AS1A14_014T01_9000006528_54996cztM0_level2.fits | modeM0/AS1A14_014T01_9000006528_54996cztM0_level2_quad_clean.evt |
| Size (bytes) | 699,603,840 | 71,032,320 |
| Size | 667.2 MB | 67.7 MB |
| Events in quadrant A | 4,559,812 | 561,614 |
| Events in quadrant B | 2,774,315 | 622,370 |
| Events in quadrant C | 2,936,183 | 551,413 |
| Events in quadrant D | 15,170,189 | 5,650 |
| Mode M0 | |||
|---|---|---|---|
| Quadrant | BADHDUFLAG | Total packets | Discarded packets |
| A | 0 | 17770 | 1 |
| B | 0 | 12503 | 1 |
| C | 0 | 12998 | 1 |
| D | 0 | 49132 | 1 |
| Mode SS | |||
|---|---|---|---|
| Quadrant | BADHDUFLAG | Total packets | Discarded packets |
| A | 0 | 118 | 0 |
| B | 0 | 118 | 0 |
| C | 0 | 118 | 0 |
| D | 0 | 118 | 0 |
| Mode M9 | |||
|---|---|---|---|
| Quadrant | BADHDUFLAG | Total packets | Discarded packets |
| A | 0 | 11 | 0 |
| B | 0 | 11 | 0 |
| C | 0 | 11 | 0 |
| D | 0 | 11 | 0 |
| Quadrant | Total seconds | Saturated seconds | Saturation percentage |
|---|---|---|---|
| A | 5866 | 208 | 3.545857% |
| B | 5866 | 76 | 1.295602% |
| C | 5867 | 51 | 0.869269% |
| D | 5867 | 5822 | 99.232998% |
Noise dominated data is calculated using 1-second bins in cleaned event files. If a bin has >2000 counts, and if more than 50% of those come from <1% of pixels, then it is considered to be noise-dominated and hence unusable.
| Quadrant | # 1 sec bins | Bins with >0 counts | Bins with >2000 counts | High rate bins dominated by noise | Noise dominated (total time) | Noise dominated (detector-on time) | Marked lightcurve |
|---|---|---|---|---|---|---|---|
| A | 6981 | 5867 | 115 | 115 | 1.65% | 1.96% | 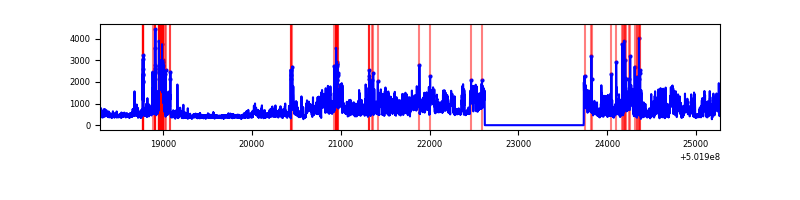 |
| B | 6981 | 5867 | 17 | 17 | 0.24% | 0.29% | 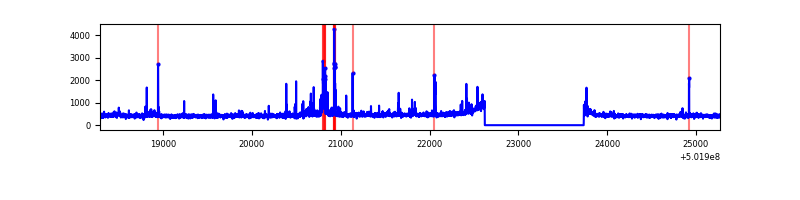 |
| C | 6982 | 5868 | 30 | 30 | 0.43% | 0.51% | 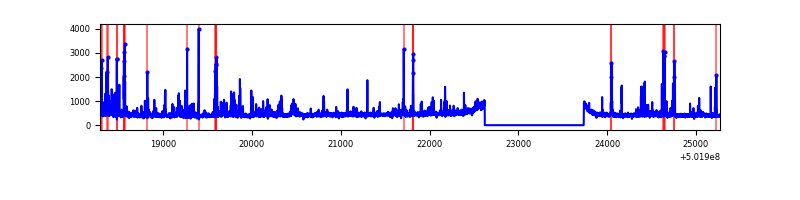 |
| D | 6981 | 5866 | 5723 | 5723 | 81.98% | 97.56% | 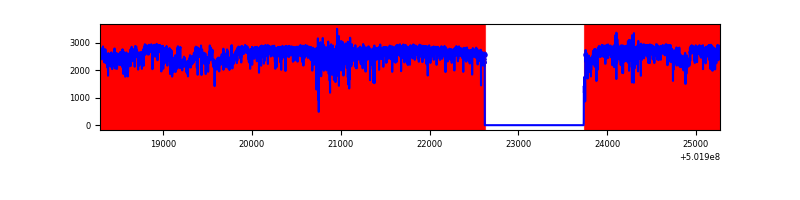 |
Top three noisy pixels from each quadrant. If the there are fewer than three noisy pixels in the level2.evt file, extra rows are filled as -1
| Pixel properties | Quadrant properties | ||||||
|---|---|---|---|---|---|---|---|
| Quadrant | DetID | PixID | Counts | Sigma | Mean | Median | Sigma |
| A | 3 | 14 | 1270865 | 7922.93 | 637 | 622 | 160.3 |
| A | 15 | 32 | 429624 | 2675.83 | 637 | 622 | 160.3 |
| A | 13 | 248 | 289567 | 1802.24 | 637 | 622 | 160.3 |
| B | 10 | 245 | 88176 | 633.52 | 636 | 613 | 138.2 |
| B | 5 | 236 | 65982 | 472.94 | 636 | 613 | 138.2 |
| B | 5 | 185 | 60960 | 436.61 | 636 | 613 | 138.2 |
| C | 13 | 3 | 227074 | 1308.44 | 626 | 619 | 173.1 |
| C | 7 | 220 | 118302 | 679.96 | 626 | 619 | 173.1 |
| C | 1 | 16 | 38918 | 221.29 | 626 | 619 | 173.1 |
| D | 15 | 94 | 13725157 | 332976.78 | 138 | 132 | 41.2 |
| D | 2 | 62 | 612157 | 14848.07 | 138 | 132 | 41.2 |
| D | 11 | 129 | 139241 | 3374.86 | 138 | 132 | 41.2 |
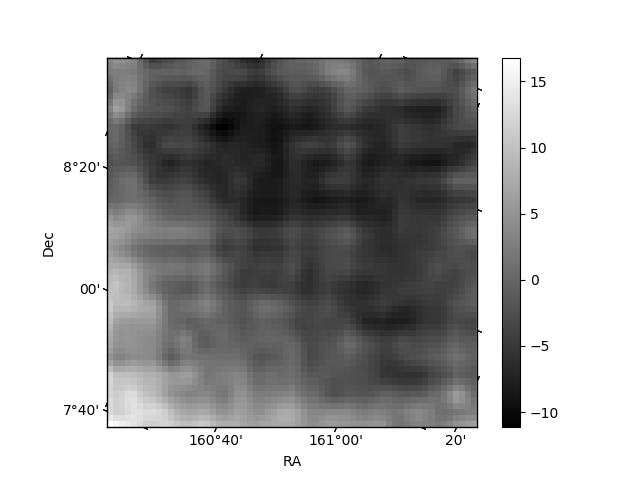
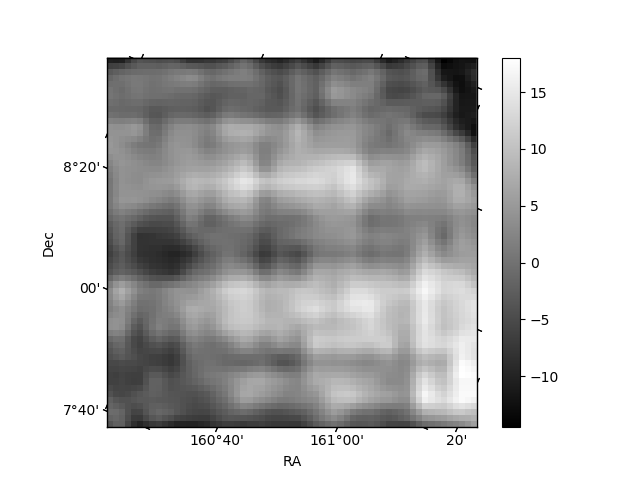
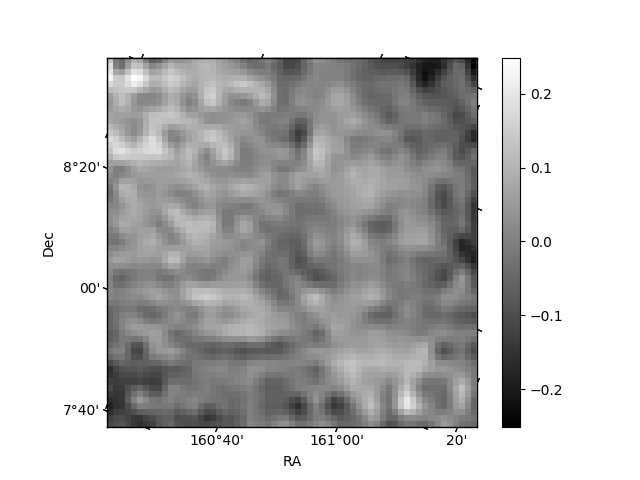
Histogram calculated using DETX and DETY for each event in the final _common_clean file
| Quadrant A | 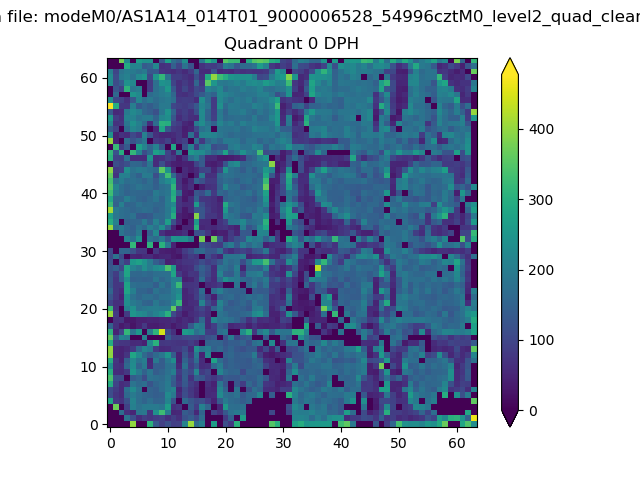 |
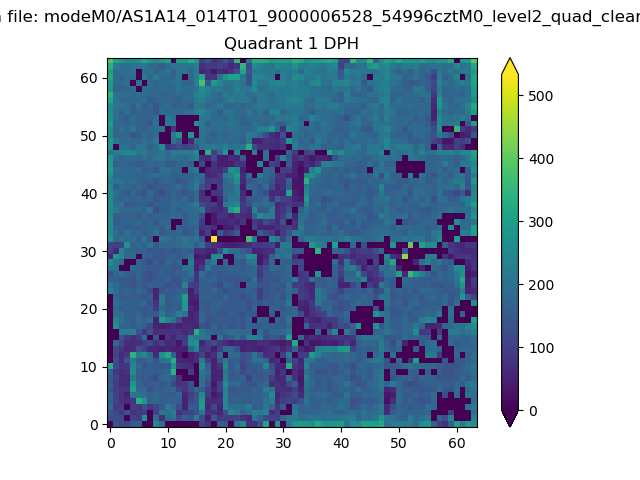 |
Quadrant B |
|---|---|---|---|
| Quadrant D | 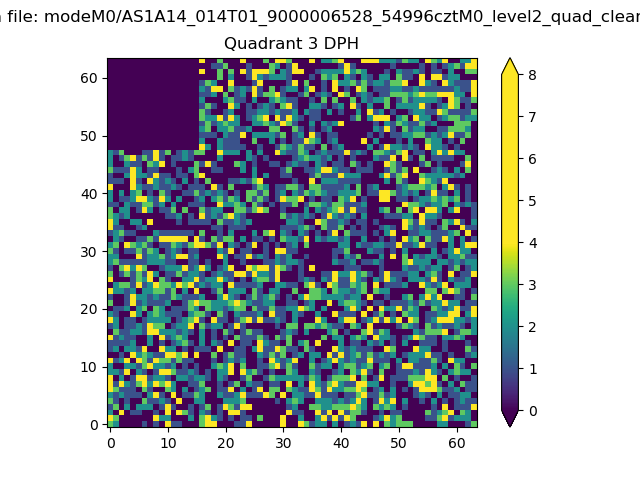 |
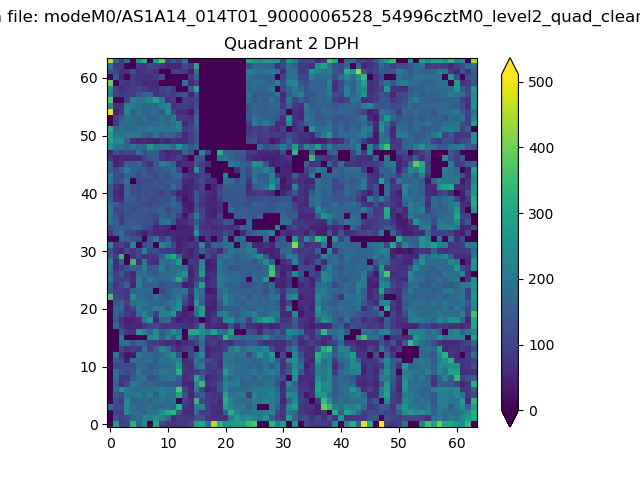 |
Quadrant C |
| Plot type | Count rate plots | Images |
|---|---|---|
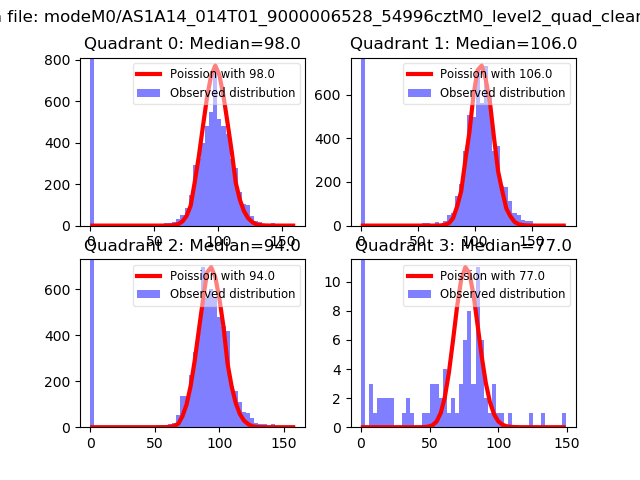
| Comparison with Poisson distribution Blue bars denote a histogram of data divided into 1 sec bins. Red curve is a Poisson curve with rate = median count rate of data. |
 |
 |
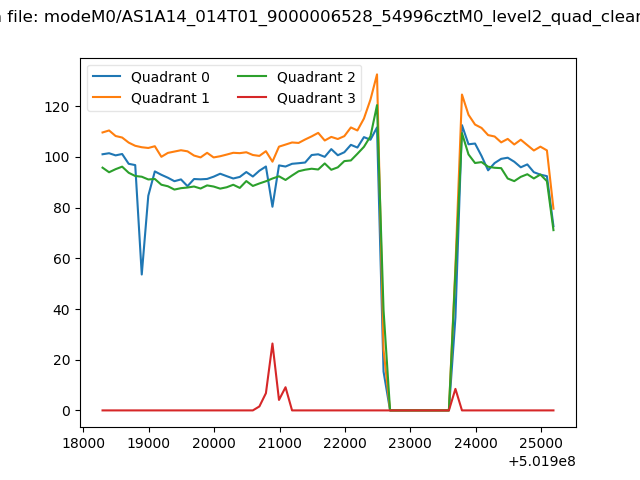
| Quadrant-wise count rates Data is divided into 100 sec bins |
 |
|
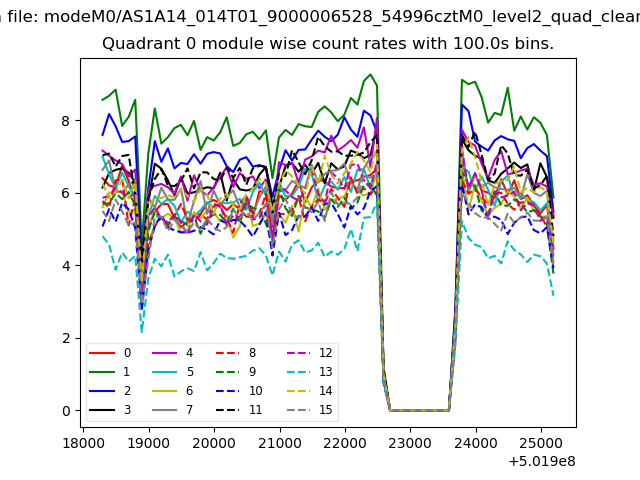
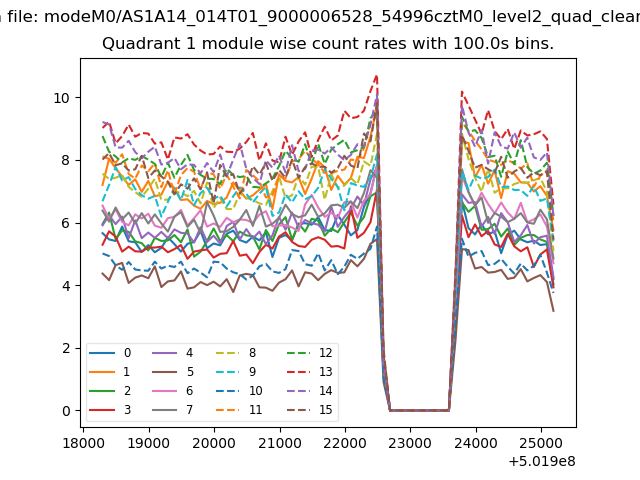
| Module-wise count rates for Quadrant A Data is divided into 100 sec bins |
 |
 |
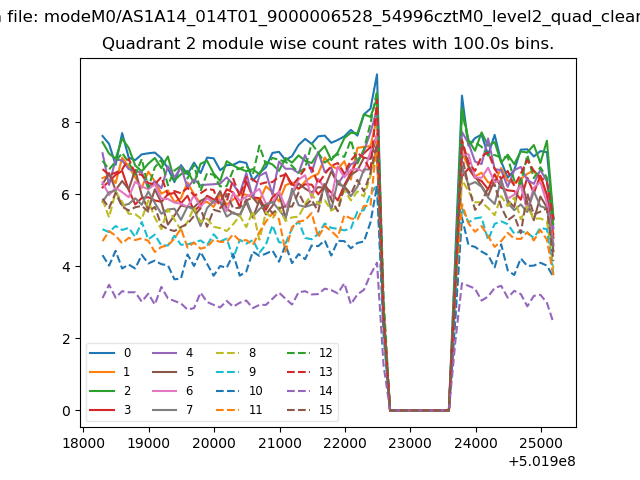
| Module-wise count rates for Quadrant B Data is divided into 100 sec bins |
 |
 |
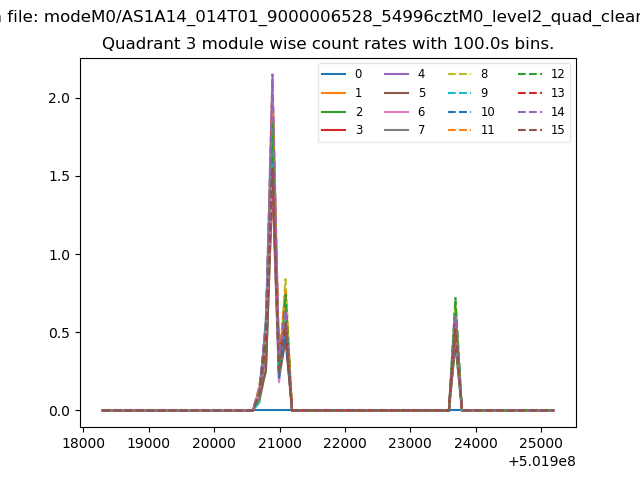
| Module-wise count rates for Quadrant C Data is divided into 100 sec bins |
 |
 |
| Module-wise count rates for Quadrant D Data is divided into 100 sec bins |
 |
 |
| Parameter | Plot |
|---|---|
| CZT HV Monitor | 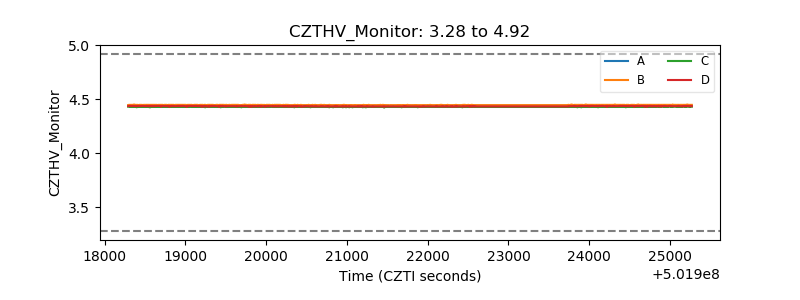 |
| D_VDD | 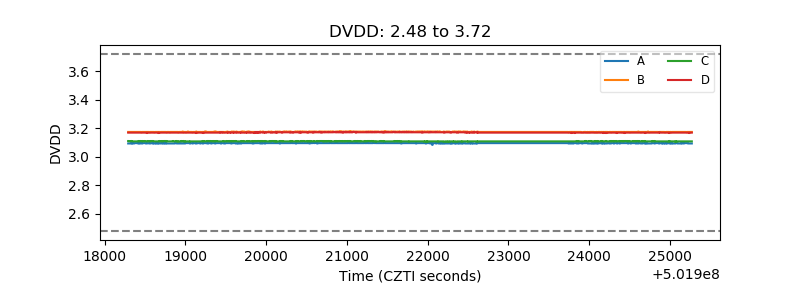 |
| Temperature 1 | 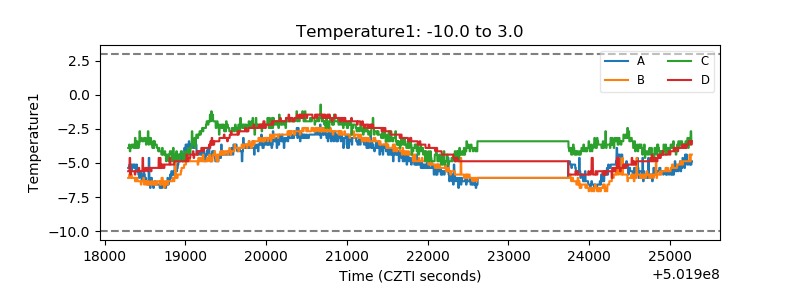 |
| Veto HV Monitor | 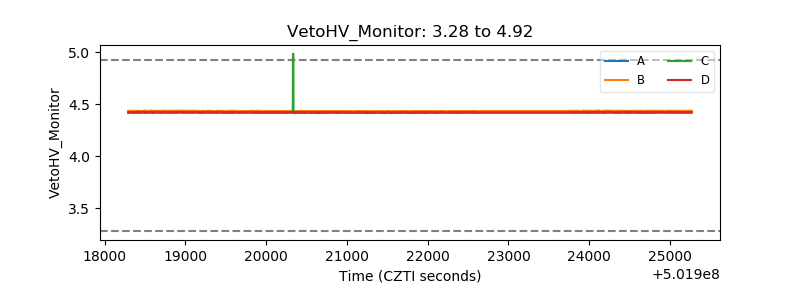 |
| Veto LLD | 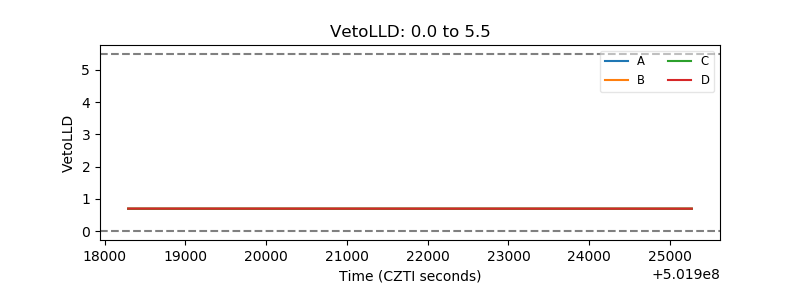 |
| Alpha Counter |  |
| _CPM_Rate | 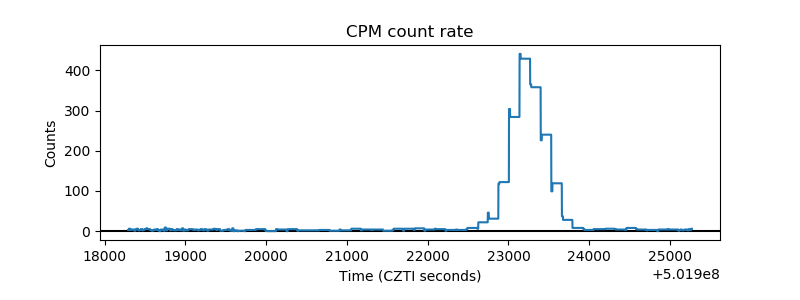 |
| CZT Counter | 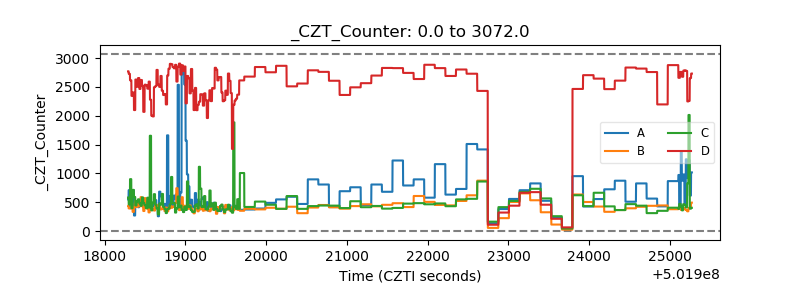 |
| +2.5 Volts monitor |  |
| +5 Volts monitor |  |
| _ROLL_ROT | 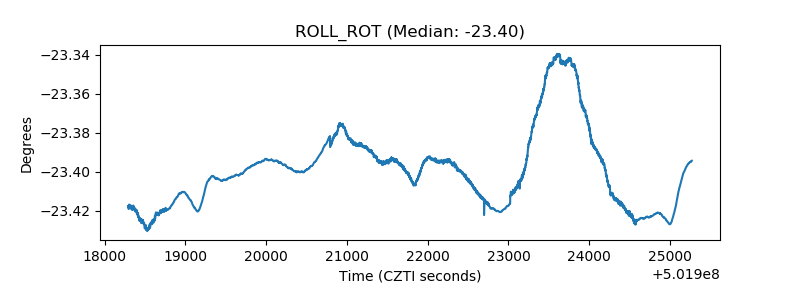 |
| _Roll_DEC | 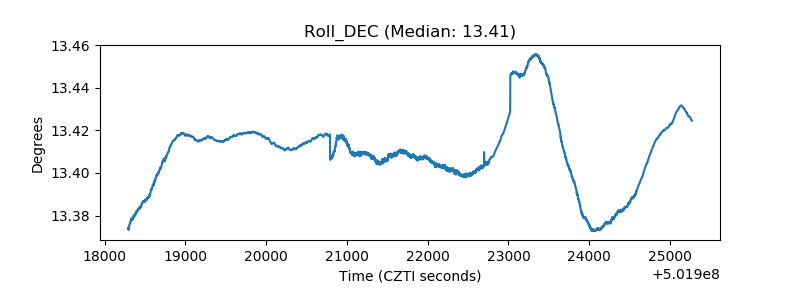 |
| _Roll_RA | 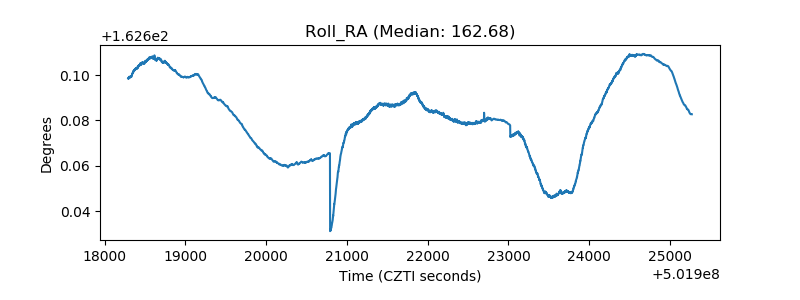 |
| Veto Counter | 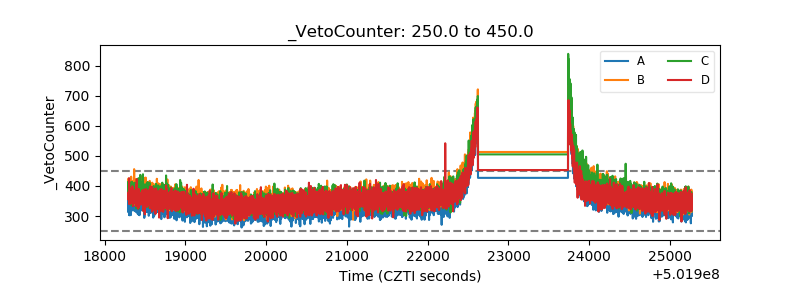 |