| Param | Original file | Final file |
|---|---|---|
| Filename | modeM0/AS1A14_014T01_9000006528_54998cztM0_level2.fits | modeM0/AS1A14_014T01_9000006528_54998cztM0_level2_quad_clean.evt |
| Size (bytes) | 585,665,280 | 60,096,960 |
| Size | 558.5 MB | 57.3 MB |
| Events in quadrant A | 3,828,847 | 461,066 |
| Events in quadrant B | 3,176,282 | 529,960 |
| Events in quadrant C | 3,157,053 | 465,630 |
| Events in quadrant D | 11,115,234 | 1,537 |
| Mode M0 | |||
|---|---|---|---|
| Quadrant | BADHDUFLAG | Total packets | Discarded packets |
| A | 0 | 18564 | 3622 |
| B | 0 | 14140 | 1035 |
| C | 0 | 14316 | 1258 |
| D | 0 | 42142 | 5646 |
| Mode SS | |||
|---|---|---|---|
| Quadrant | BADHDUFLAG | Total packets | Discarded packets |
| A | 0 | 116 | 12 |
| B | 0 | 115 | 7 |
| C | 0 | 116 | 6 |
| D | 0 | 116 | 12 |
| Mode M9 | |||
|---|---|---|---|
| Quadrant | BADHDUFLAG | Total packets | Discarded packets |
| A | 0 | 7 | 0 |
| B | 0 | 7 | 0 |
| C | 0 | 7 | 0 |
| D | 0 | 7 | 0 |
| Quadrant | Total seconds | Saturated seconds | Saturation percentage |
|---|---|---|---|
| A | 5132 | 358 | 6.975838% |
| B | 5233 | 172 | 3.286834% |
| C | 5208 | 222 | 4.262673% |
| D | 5030 | 5018 | 99.761431% |
Noise dominated data is calculated using 1-second bins in cleaned event files. If a bin has >2000 counts, and if more than 50% of those come from <1% of pixels, then it is considered to be noise-dominated and hence unusable.
| Quadrant | # 1 sec bins | Bins with >0 counts | Bins with >2000 counts | High rate bins dominated by noise | Noise dominated (total time) | Noise dominated (detector-on time) | Marked lightcurve |
|---|---|---|---|---|---|---|---|
| A | 6339 | 5243 | 173 | 173 | 2.73% | 3.30% | 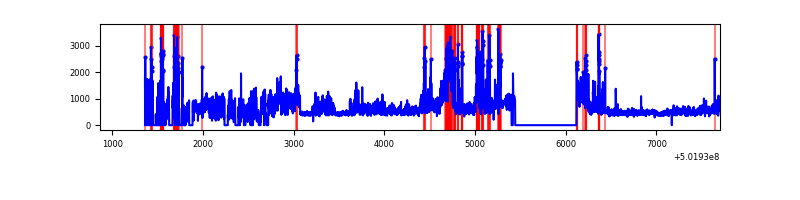 |
| B | 6835 | 5355 | 44 | 44 | 0.64% | 0.82% | 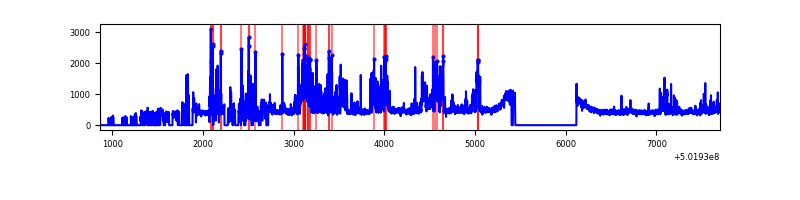 |
| C | 6698 | 5327 | 131 | 131 | 1.96% | 2.46% | 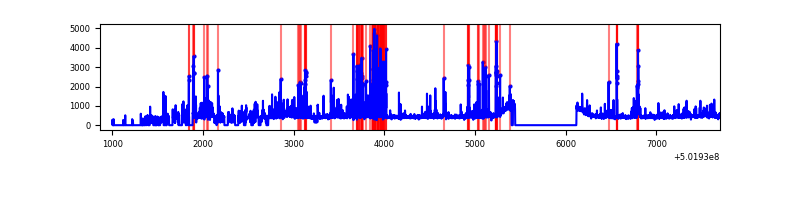 |
| D | 6363 | 5029 | 3492 | 3492 | 54.88% | 69.44% | 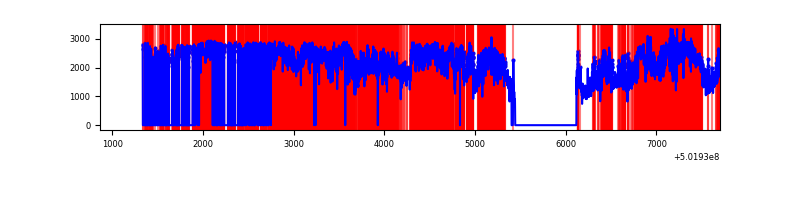 |
Top three noisy pixels from each quadrant. If the there are fewer than three noisy pixels in the level2.evt file, extra rows are filled as -1
| Pixel properties | Quadrant properties | ||||||
|---|---|---|---|---|---|---|---|
| Quadrant | DetID | PixID | Counts | Sigma | Mean | Median | Sigma |
| A | 3 | 14 | 806729 | 5761.72 | 561 | 548 | 139.9 |
| A | 15 | 32 | 782164 | 5586.15 | 561 | 548 | 139.9 |
| A | 11 | 3 | 22348 | 155.8 | 561 | 548 | 139.9 |
| B | 5 | 236 | 622059 | 5002.62 | 572 | 551 | 124.2 |
| B | 5 | 185 | 110950 | 888.62 | 572 | 551 | 124.2 |
| B | 10 | 245 | 82258 | 657.67 | 572 | 551 | 124.2 |
| C | 9 | 38 | 593247 | 3855.51 | 559 | 554 | 153.7 |
| C | 14 | 254 | 105917 | 685.39 | 559 | 554 | 153.7 |
| C | 6 | 223 | 104054 | 673.27 | 559 | 554 | 153.7 |
| D | 15 | 94 | 9542123 | 388533.07 | 81 | 77 | 24.6 |
| D | 2 | 62 | 809330 | 32951.17 | 81 | 77 | 24.6 |
| D | 15 | 93 | 98096 | 3991.14 | 81 | 77 | 24.6 |
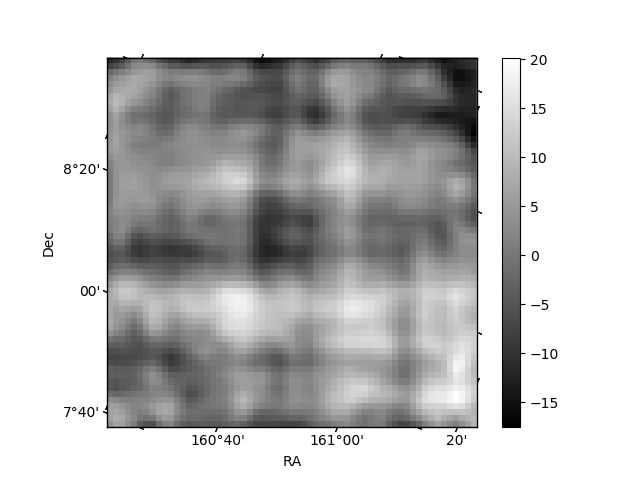
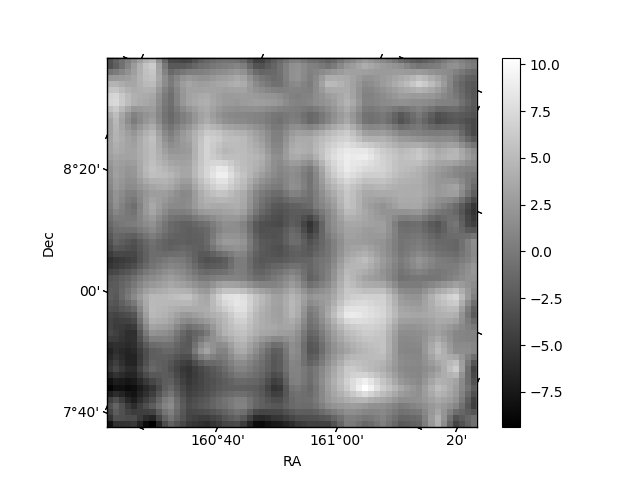
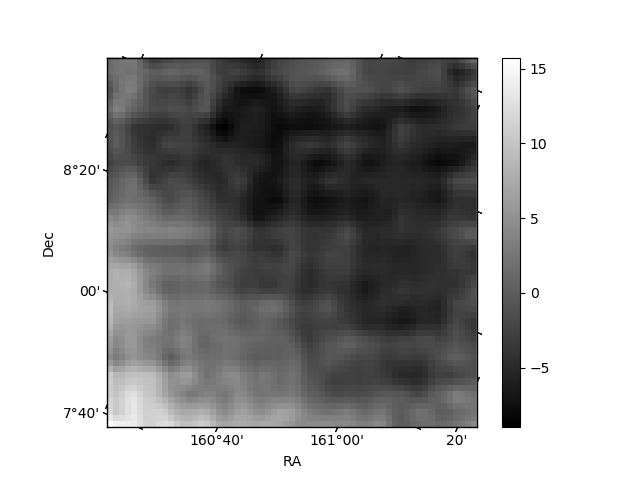
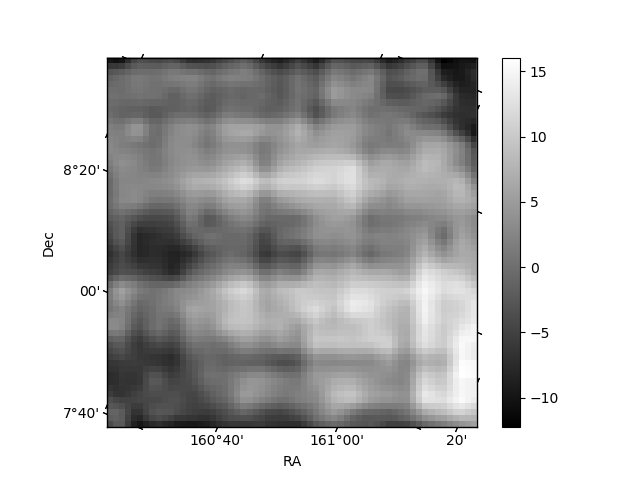
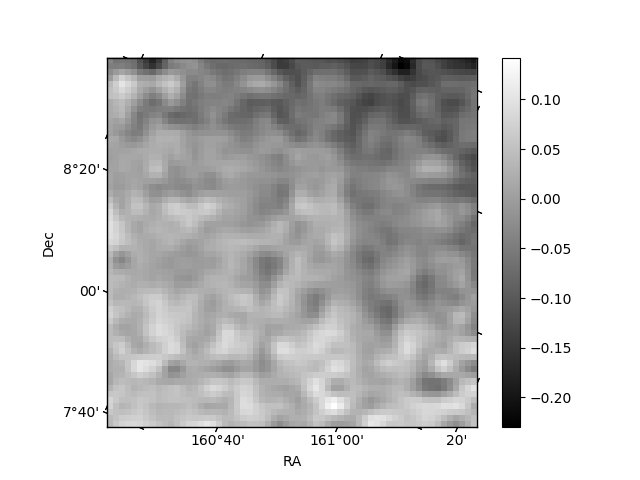
Histogram calculated using DETX and DETY for each event in the final _common_clean file
| Quadrant A | 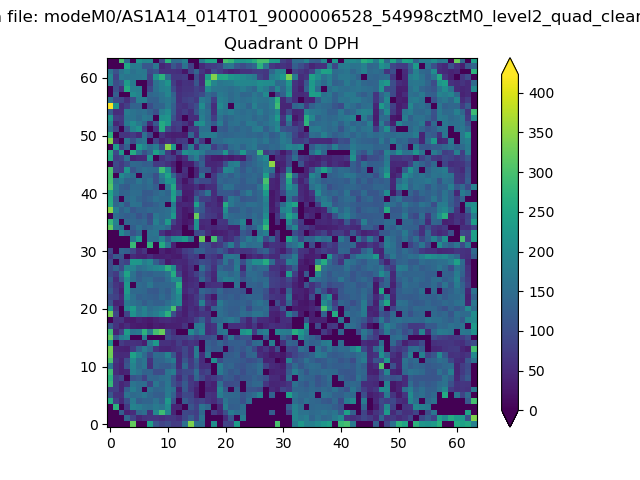 |
 |
Quadrant B |
|---|---|---|---|
| Quadrant D | 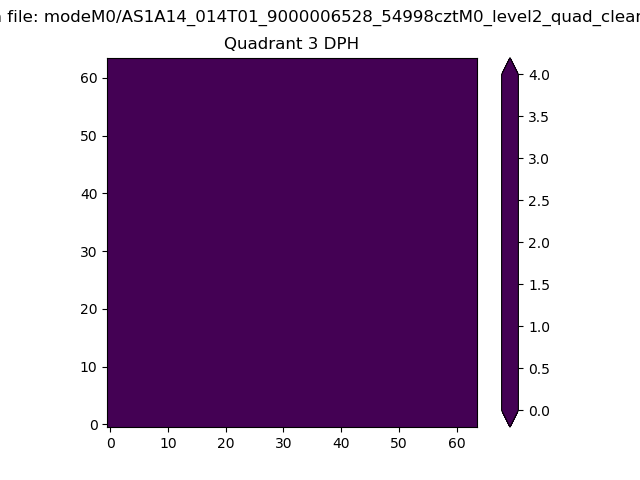 |
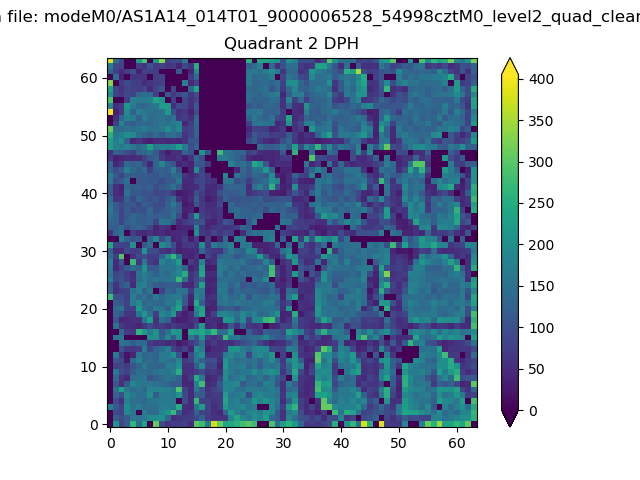 |
Quadrant C |
| Plot type | Count rate plots | Images |
|---|---|---|
| Comparison with Poisson distribution Blue bars denote a histogram of data divided into 1 sec bins. Red curve is a Poisson curve with rate = median count rate of data. |
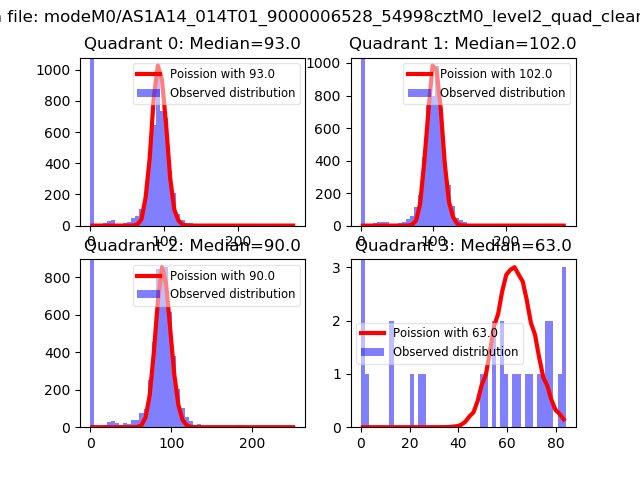 |
 |
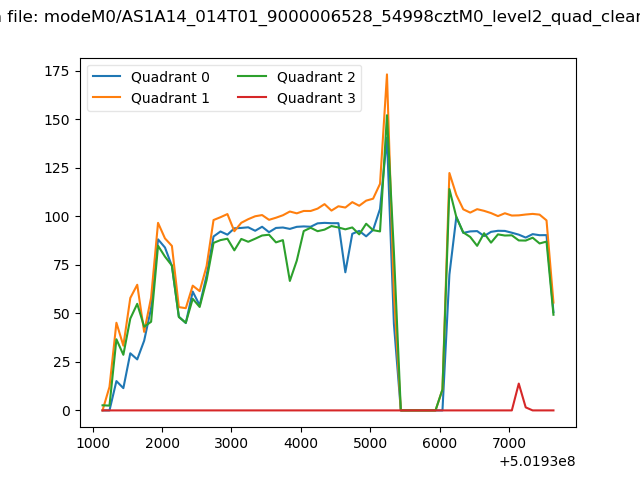
| Quadrant-wise count rates Data is divided into 100 sec bins |
 |
|
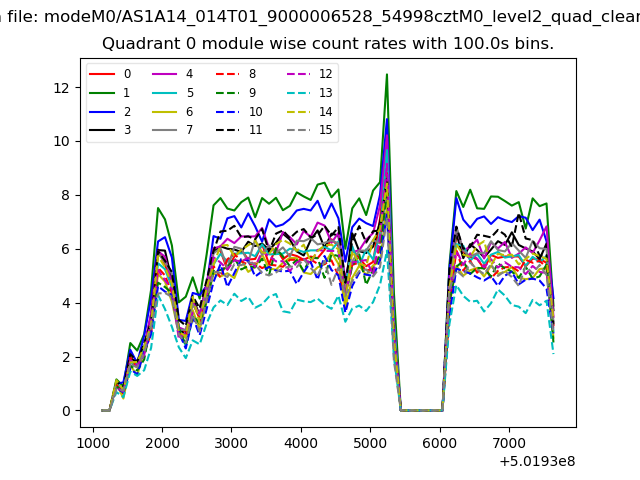
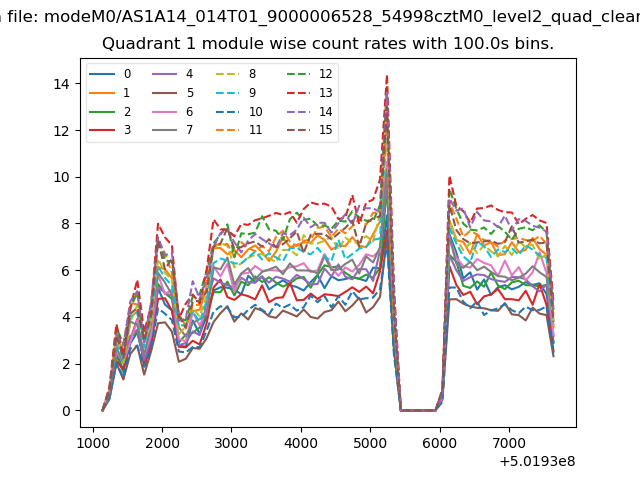
| Module-wise count rates for Quadrant A Data is divided into 100 sec bins |
 |
 |
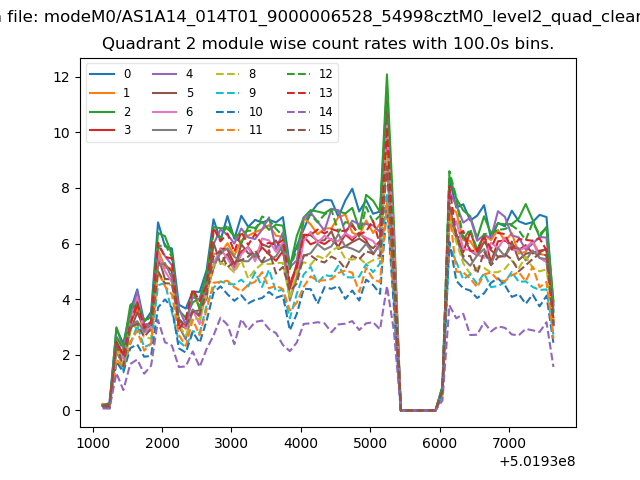
| Module-wise count rates for Quadrant B Data is divided into 100 sec bins |
 |
 |
| Module-wise count rates for Quadrant C Data is divided into 100 sec bins |
 |
 |
| Module-wise count rates for Quadrant D Data is divided into 100 sec bins |
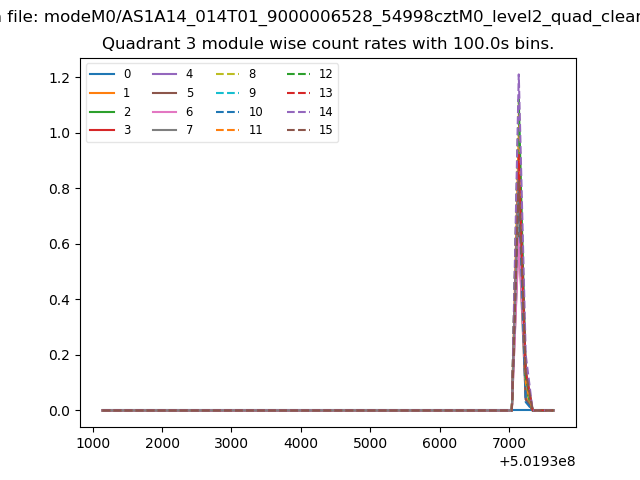 |
 |
| Parameter | Plot |
|---|---|
| CZT HV Monitor | 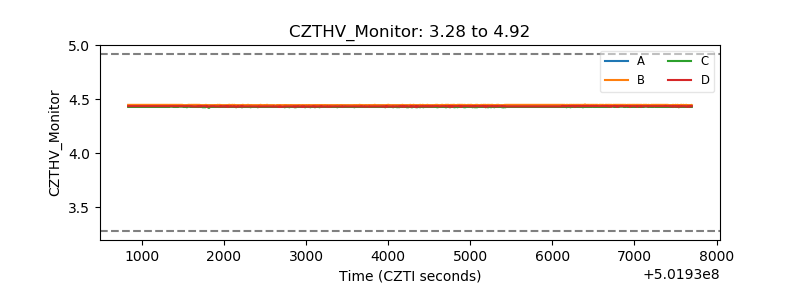 |
| D_VDD | 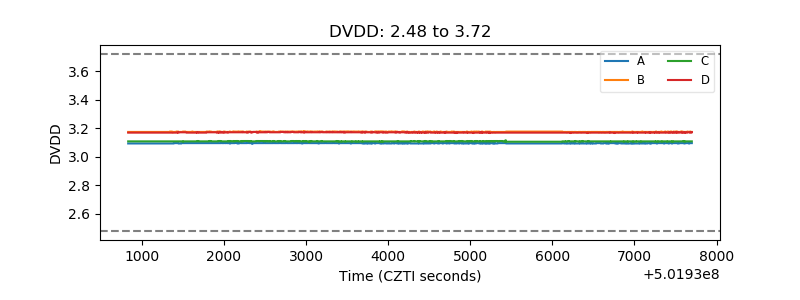 |
| Temperature 1 | 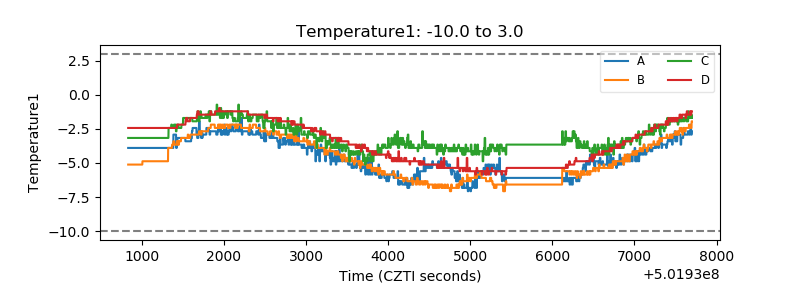 |
| Veto HV Monitor | 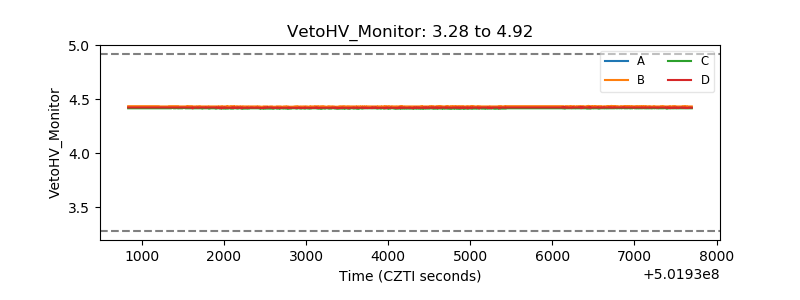 |
| Veto LLD | 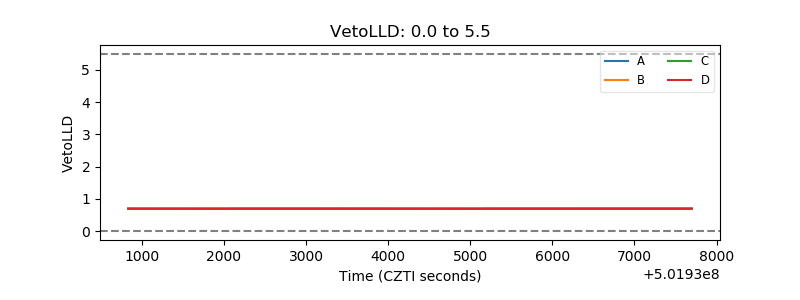 |
| Alpha Counter |  |
| _CPM_Rate | 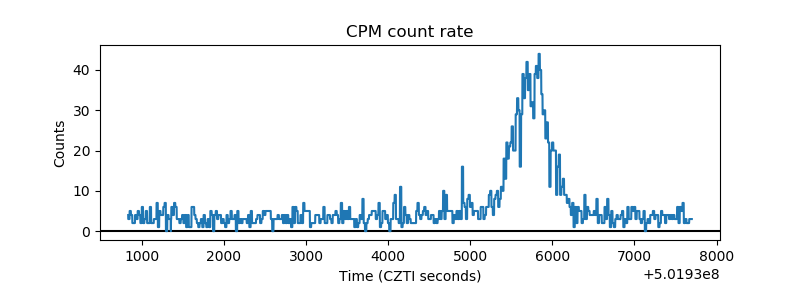 |
| CZT Counter | 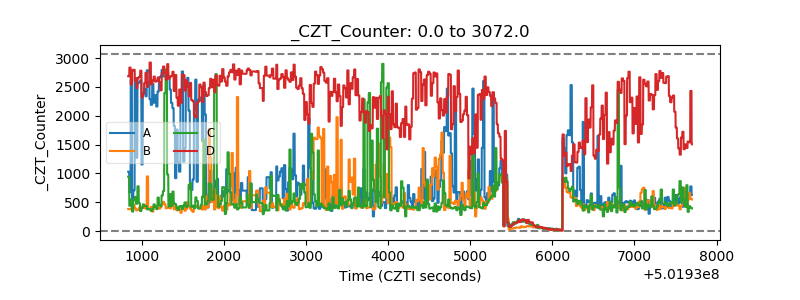 |
| +2.5 Volts monitor |  |
| +5 Volts monitor |  |
| _ROLL_ROT | 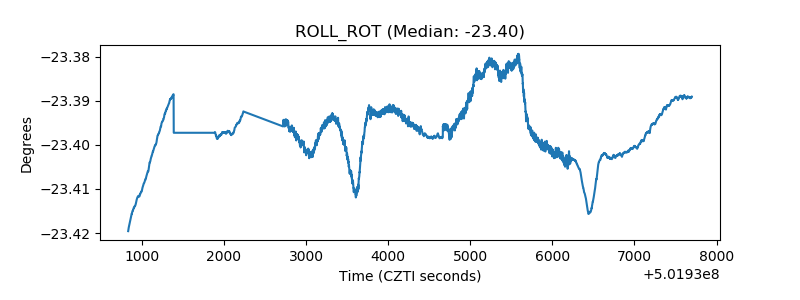 |
| _Roll_DEC | 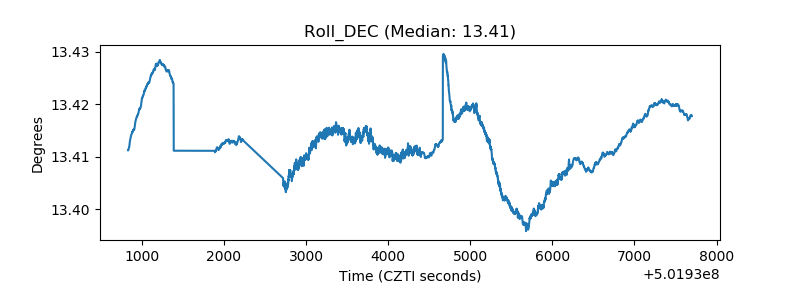 |
| _Roll_RA |  |
| Veto Counter | 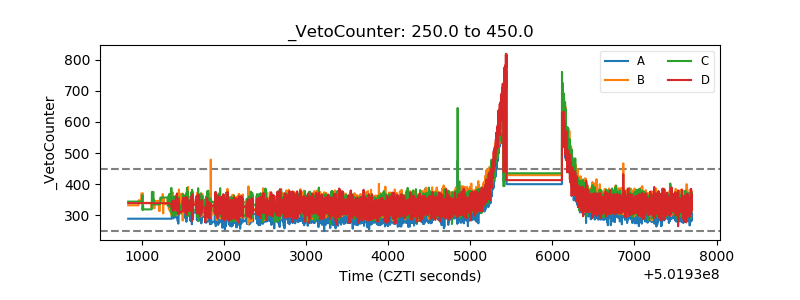 |