| Param | Original file | Final file |
|---|---|---|
| Filename | modeM0/AS1A14_014T01_9000006528_55000cztM0_level2.fits | modeM0/AS1A14_014T01_9000006528_55000cztM0_level2_quad_clean.evt |
| Size (bytes) | 875,946,240 | 92,211,840 |
| Size | 835.4 MB | 87.9 MB |
| Events in quadrant A | 4,699,546 | 714,268 |
| Events in quadrant B | 4,702,391 | 766,975 |
| Events in quadrant C | 3,753,666 | 693,311 |
| Events in quadrant D | 18,666,900 | 77,956 |
| Mode M0 | |||
|---|---|---|---|
| Quadrant | BADHDUFLAG | Total packets | Discarded packets |
| A | 0 | 19351 | 174 |
| B | 0 | 19559 | 172 |
| C | 0 | 16957 | 187 |
| D | 0 | 61435 | 722 |
| Mode SS | |||
|---|---|---|---|
| Quadrant | BADHDUFLAG | Total packets | Discarded packets |
| A | 0 | 156 | 0 |
| B | 0 | 156 | 2 |
| C | 0 | 156 | 0 |
| D | 0 | 156 | 0 |
| Quadrant | Total seconds | Saturated seconds | Saturation percentage |
|---|---|---|---|
| A | 7760 | 157 | 2.023196% |
| B | 7762 | 269 | 3.465602% |
| C | 7753 | 34 | 0.438540% |
| D | 7736 | 6882 | 88.960703% |
Noise dominated data is calculated using 1-second bins in cleaned event files. If a bin has >2000 counts, and if more than 50% of those come from <1% of pixels, then it is considered to be noise-dominated and hence unusable.
| Quadrant | # 1 sec bins | Bins with >0 counts | Bins with >2000 counts | High rate bins dominated by noise | Noise dominated (total time) | Noise dominated (detector-on time) | Marked lightcurve |
|---|---|---|---|---|---|---|---|
| A | 7789 | 7770 | 124 | 124 | 1.59% | 1.60% | 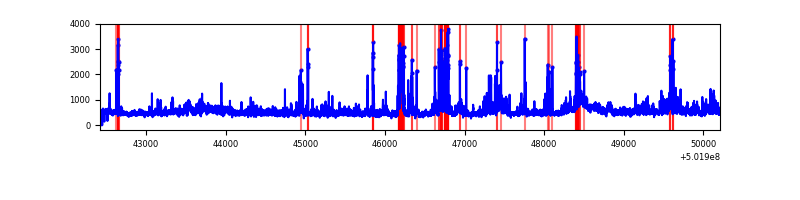 |
| B | 7782 | 7772 | 166 | 166 | 2.13% | 2.14% | 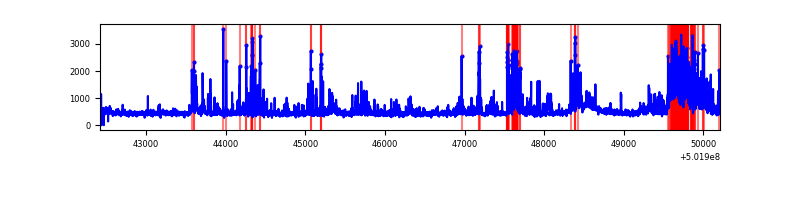 |
| C | 7785 | 7763 | 35 | 35 | 0.45% | 0.45% | 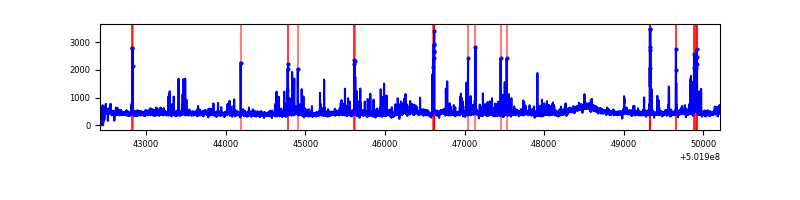 |
| D | 7755 | 7736 | 6484 | 6484 | 83.61% | 83.82% | 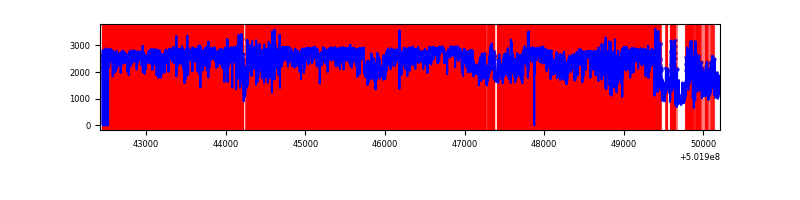 |
Top three noisy pixels from each quadrant. If the there are fewer than three noisy pixels in the level2.evt file, extra rows are filled as -1
| Pixel properties | Quadrant properties | ||||||
|---|---|---|---|---|---|---|---|
| Quadrant | DetID | PixID | Counts | Sigma | Mean | Median | Sigma |
| A | 3 | 14 | 711382 | 3441.34 | 836 | 813 | 206.5 |
| A | 15 | 32 | 505233 | 2442.95 | 836 | 813 | 206.5 |
| A | 0 | 8 | 120451 | 579.42 | 836 | 813 | 206.5 |
| B | 5 | 236 | 517798 | 2909.54 | 822 | 791 | 177.7 |
| B | 12 | 6 | 419801 | 2358.04 | 822 | 791 | 177.7 |
| B | 2 | 249 | 188175 | 1054.53 | 822 | 791 | 177.7 |
| C | 13 | 3 | 164168 | 727.76 | 817 | 811 | 224.5 |
| C | 1 | 16 | 101212 | 447.29 | 817 | 811 | 224.5 |
| C | 14 | 254 | 72534 | 319.53 | 817 | 811 | 224.5 |
| D | 15 | 94 | 16369318 | 185300.02 | 305 | 292 | 88.3 |
| D | 11 | 129 | 278115 | 3145.0 | 305 | 292 | 88.3 |
| D | 3 | 224 | 142272 | 1607.24 | 305 | 292 | 88.3 |
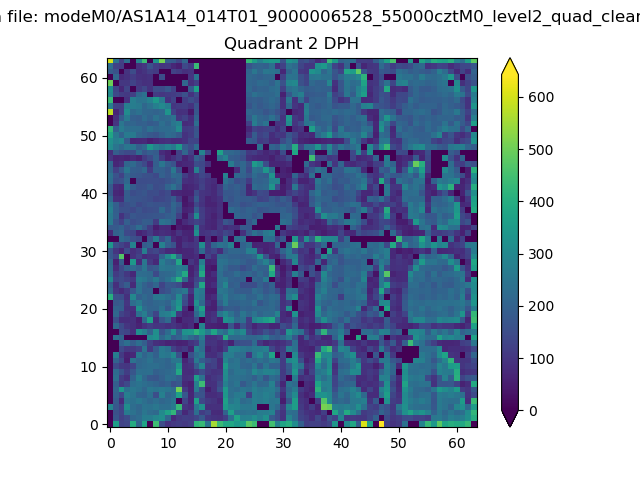
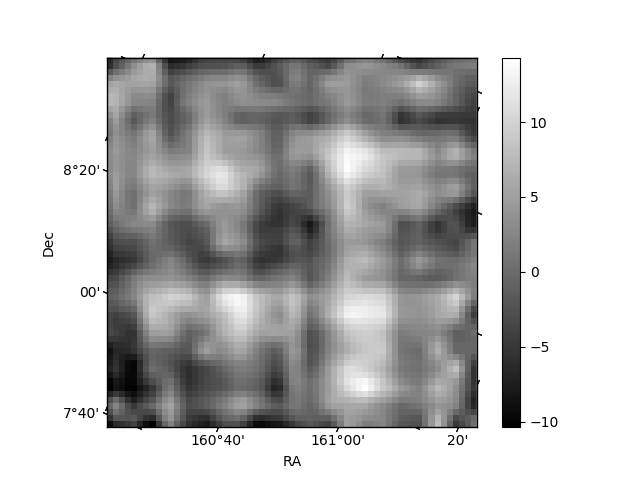
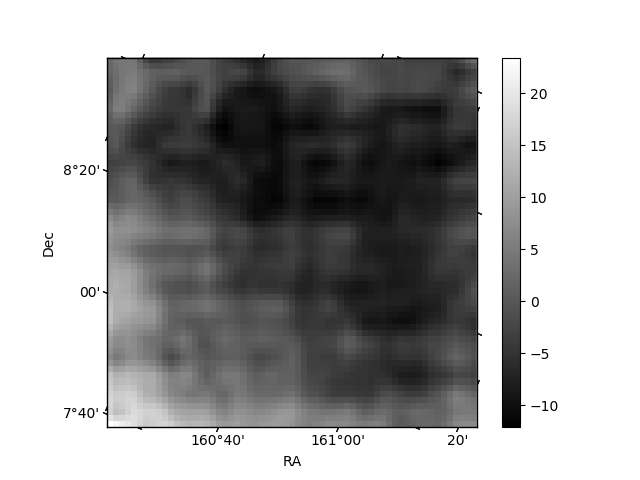
Histogram calculated using DETX and DETY for each event in the final _common_clean file
| Quadrant A |  |
 |
Quadrant B |
|---|---|---|---|
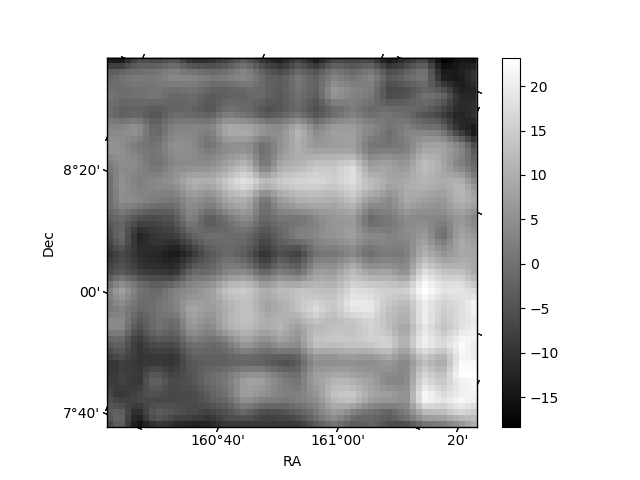
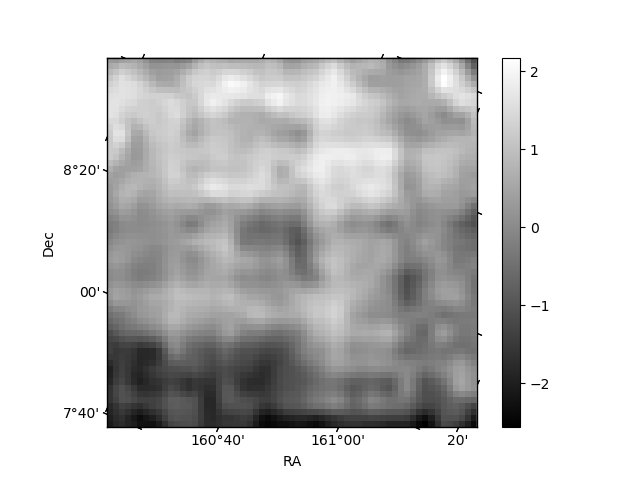
| Quadrant D |  |
 |
Quadrant C |
| Plot type | Count rate plots | Images |
|---|---|---|
| Comparison with Poisson distribution Blue bars denote a histogram of data divided into 1 sec bins. Red curve is a Poisson curve with rate = median count rate of data. |
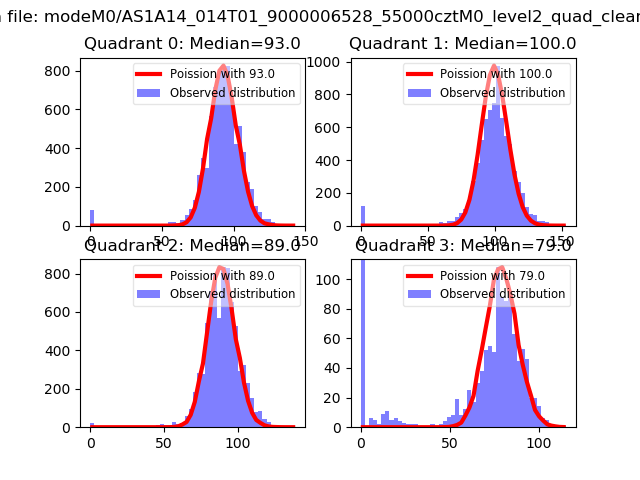 |
 |
| Quadrant-wise count rates Data is divided into 100 sec bins |
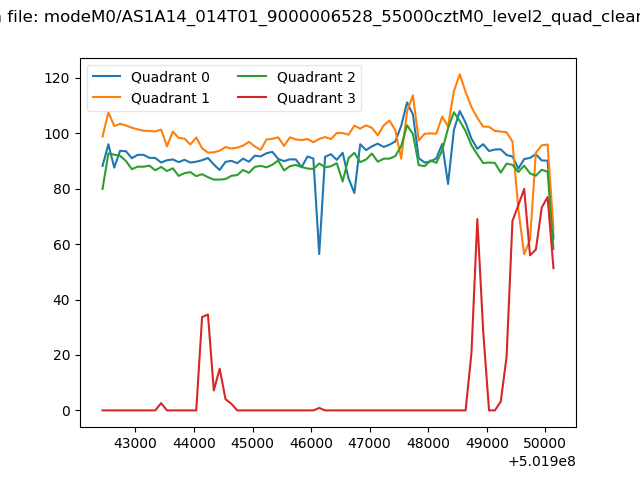 |
|
| Module-wise count rates for Quadrant A Data is divided into 100 sec bins |
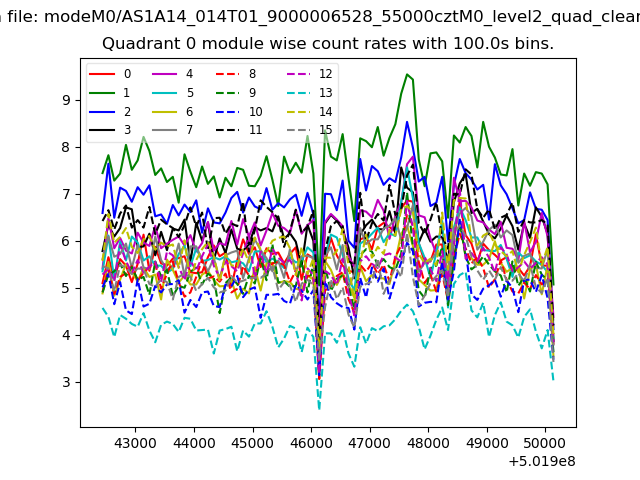 |
 |
| Module-wise count rates for Quadrant B Data is divided into 100 sec bins |
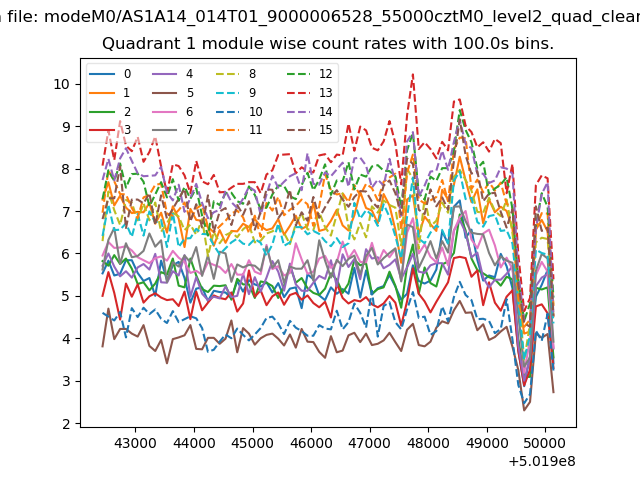 |
 |
| Module-wise count rates for Quadrant C Data is divided into 100 sec bins |
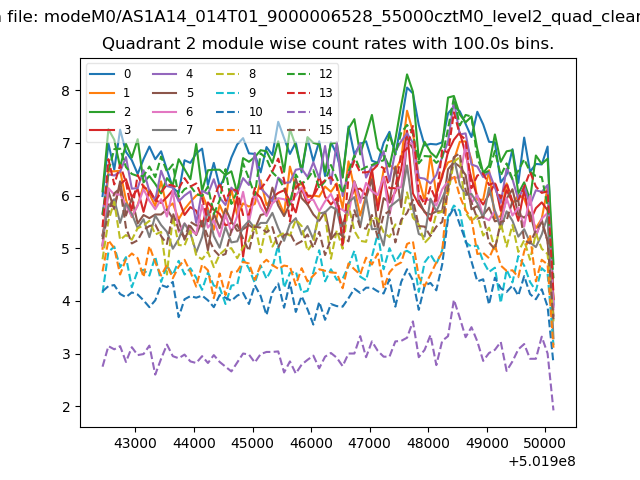 |
 |
| Module-wise count rates for Quadrant D Data is divided into 100 sec bins |
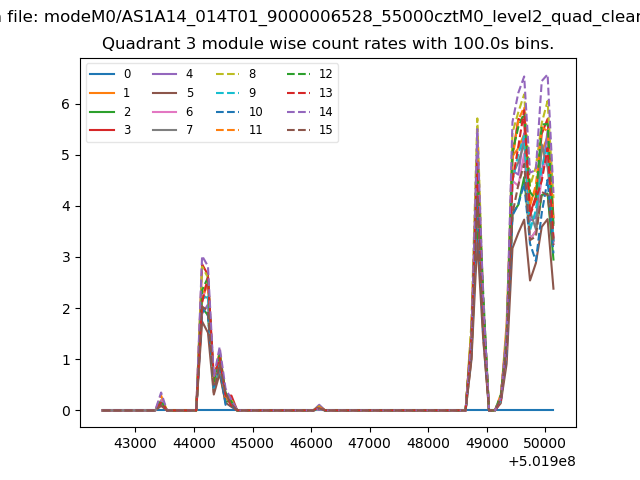 |
 |
| Parameter | Plot |
|---|---|
| CZT HV Monitor | 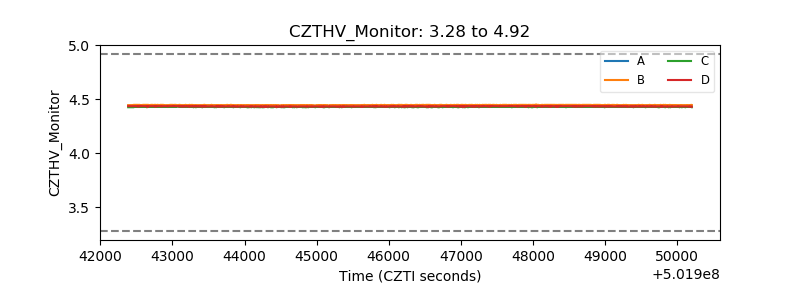 |
| D_VDD |  |
| Temperature 1 | 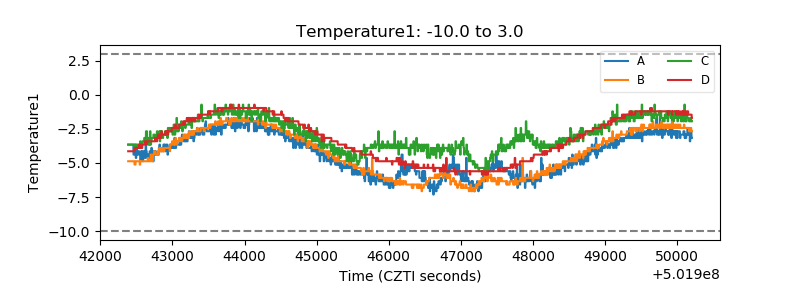 |
| Veto HV Monitor | 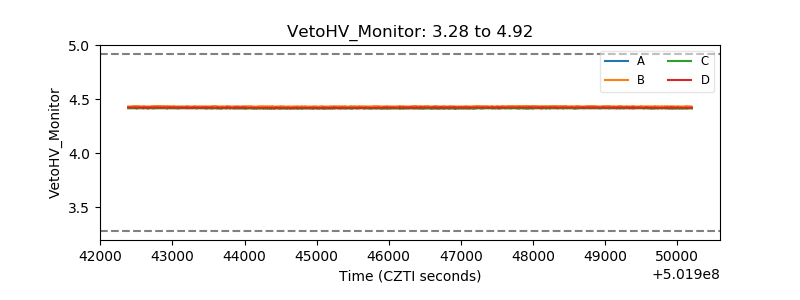 |
| Veto LLD | 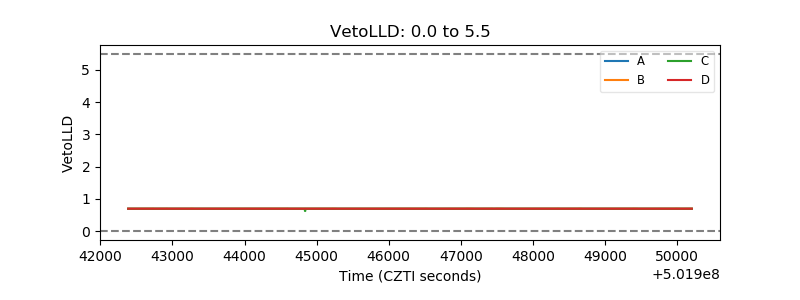 |
| Alpha Counter | 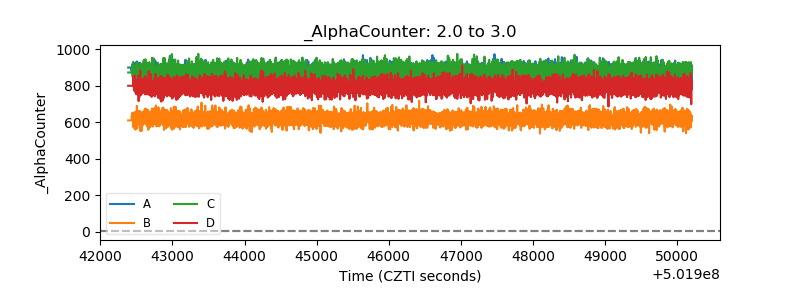 |
| _CPM_Rate | 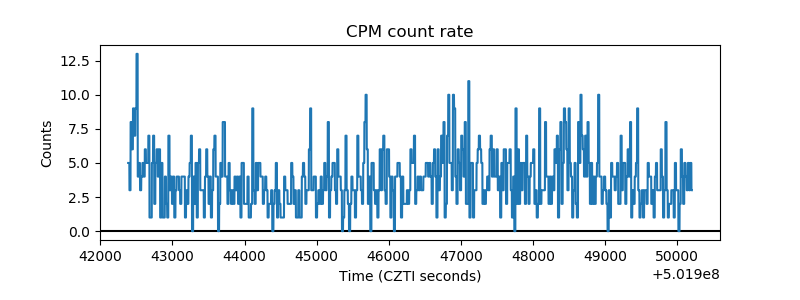 |
| CZT Counter | 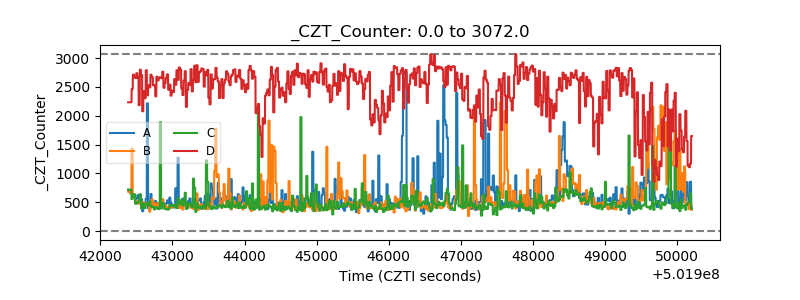 |
| +2.5 Volts monitor |  |
| +5 Volts monitor |  |
| _ROLL_ROT | 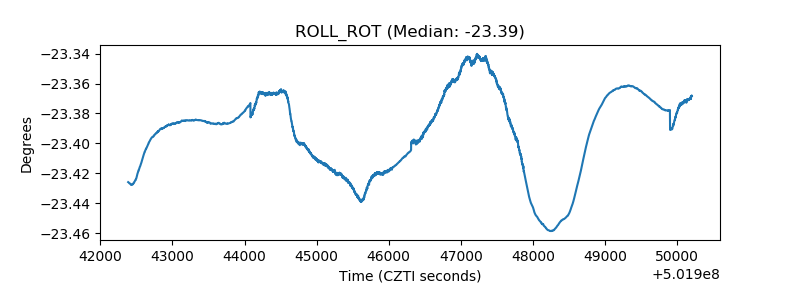 |
| _Roll_DEC | 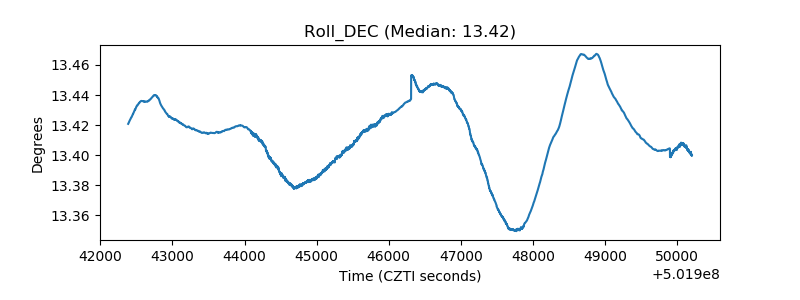 |
| _Roll_RA | 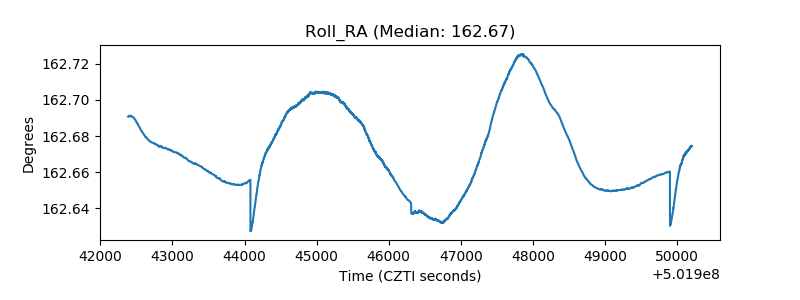 |
| Veto Counter | 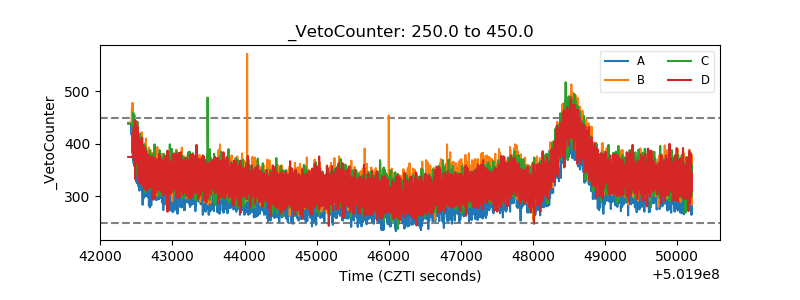 |