| Param | Original file | Final file |
|---|---|---|
| Filename | modeM0/AS1A14_014T01_9000006528_55007cztM0_level2.fits | modeM0/AS1A14_014T01_9000006528_55007cztM0_level2_quad_clean.evt |
| Size (bytes) | 984,568,320 | 101,638,080 |
| Size | 939.0 MB | 96.9 MB |
| Events in quadrant A | 6,034,829 | 717,095 |
| Events in quadrant B | 4,410,017 | 847,241 |
| Events in quadrant C | 6,737,659 | 734,046 |
| Events in quadrant D | 18,626,555 | 207,540 |
| Mode M0 | |||
|---|---|---|---|
| Quadrant | BADHDUFLAG | Total packets | Discarded packets |
| A | 0 | 23924 | 131 |
| B | 0 | 18963 | 114 |
| C | 0 | 25922 | 144 |
| D | 0 | 61823 | 844 |
| Mode SS | |||
|---|---|---|---|
| Quadrant | BADHDUFLAG | Total packets | Discarded packets |
| A | 0 | 170 | 2 |
| B | 0 | 170 | 2 |
| C | 0 | 170 | 2 |
| D | 0 | 170 | 0 |
| Mode M9 | |||
|---|---|---|---|
| Quadrant | BADHDUFLAG | Total packets | Discarded packets |
| A | 0 | 18 | 0 |
| B | 0 | 18 | 0 |
| C | 0 | 18 | 0 |
| D | 0 | 18 | 0 |
| Quadrant | Total seconds | Saturated seconds | Saturation percentage |
|---|---|---|---|
| A | 8230 | 943 | 11.458080% |
| B | 8238 | 150 | 1.820830% |
| C | 8229 | 440 | 5.346944% |
| D | 8194 | 6086 | 74.273859% |
Noise dominated data is calculated using 1-second bins in cleaned event files. If a bin has >2000 counts, and if more than 50% of those come from <1% of pixels, then it is considered to be noise-dominated and hence unusable.
| Quadrant | # 1 sec bins | Bins with >0 counts | Bins with >2000 counts | High rate bins dominated by noise | Noise dominated (total time) | Noise dominated (detector-on time) | Marked lightcurve |
|---|---|---|---|---|---|---|---|
| A | 10044 | 8246 | 799 | 799 | 7.95% | 9.69% | 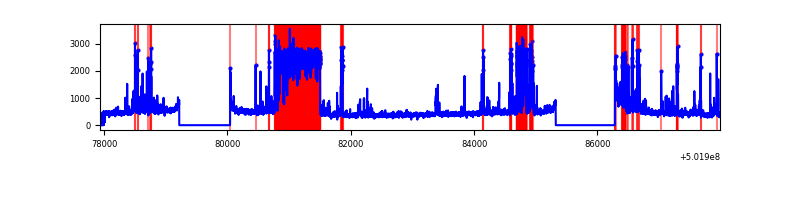 |
| B | 10056 | 8258 | 51 | 51 | 0.51% | 0.62% | 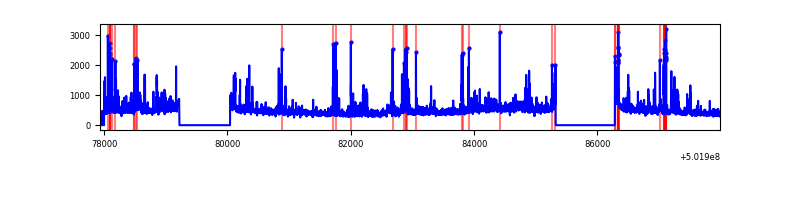 |
| C | 10033 | 8242 | 456 | 456 | 4.55% | 5.53% | 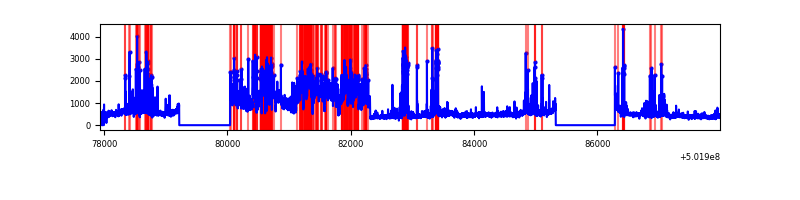 |
| D | 10009 | 8197 | 6175 | 6175 | 61.69% | 75.33% |  |
Top three noisy pixels from each quadrant. If the there are fewer than three noisy pixels in the level2.evt file, extra rows are filled as -1
| Pixel properties | Quadrant properties | ||||||
|---|---|---|---|---|---|---|---|
| Quadrant | DetID | PixID | Counts | Sigma | Mean | Median | Sigma |
| A | 15 | 32 | 2450854 | 11596.14 | 843 | 820 | 211.3 |
| A | 3 | 14 | 175415 | 826.37 | 843 | 820 | 211.3 |
| A | 0 | 8 | 66251 | 309.69 | 843 | 820 | 211.3 |
| B | 5 | 236 | 288252 | 1503.28 | 886 | 853 | 191.2 |
| B | 5 | 185 | 268096 | 1397.85 | 886 | 853 | 191.2 |
| B | 2 | 249 | 139810 | 726.83 | 886 | 853 | 191.2 |
| C | 9 | 38 | 2495479 | 10576.64 | 860 | 854 | 235.9 |
| C | 13 | 3 | 503926 | 2132.91 | 860 | 854 | 235.9 |
| C | 12 | 252 | 109568 | 460.92 | 860 | 854 | 235.9 |
| D | 15 | 94 | 14242392 | 91290.43 | 545 | 520 | 156.0 |
| D | 2 | 249 | 1335144 | 8554.94 | 545 | 520 | 156.0 |
| D | 11 | 129 | 464667 | 2975.18 | 545 | 520 | 156.0 |
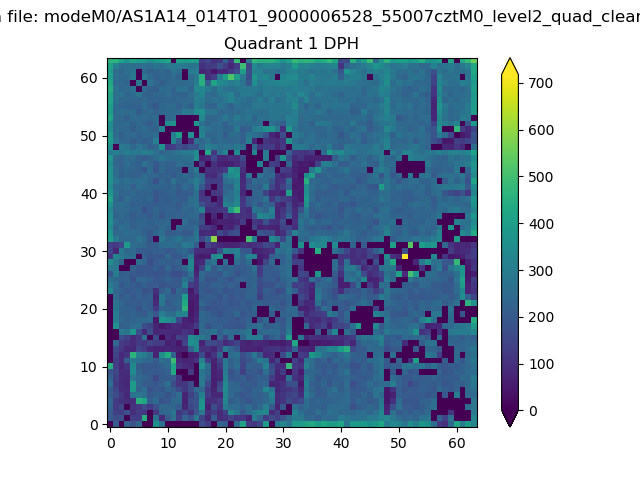
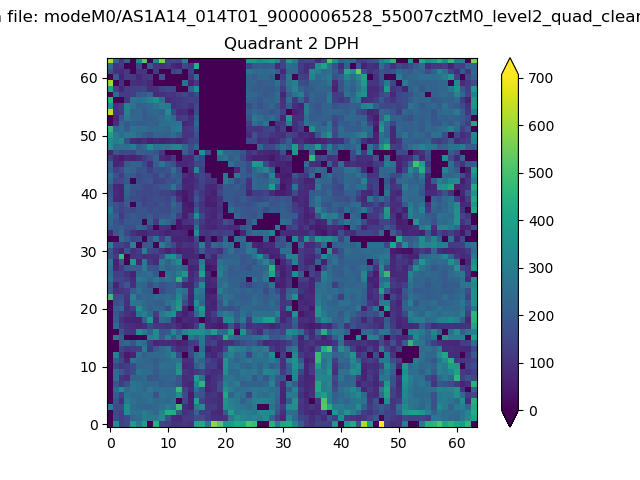
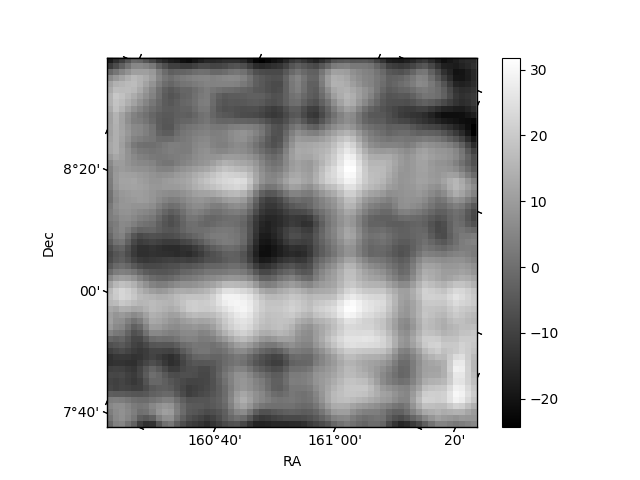
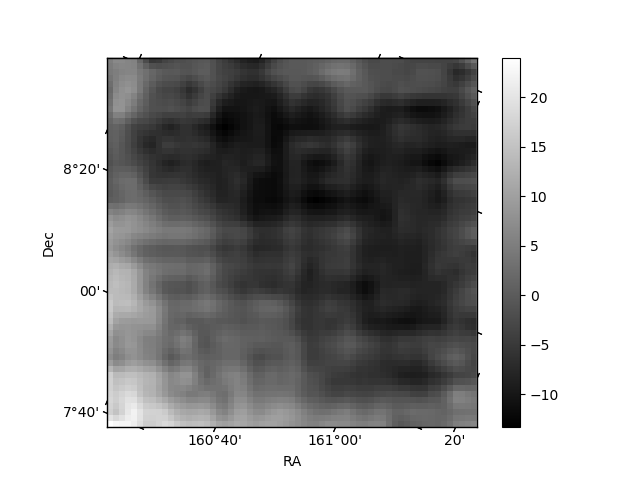
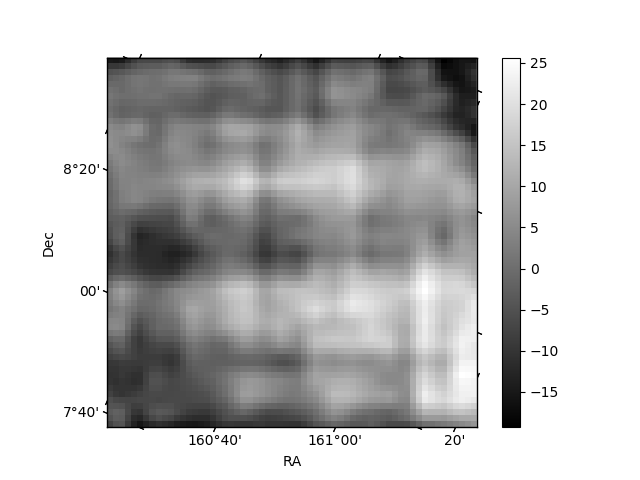
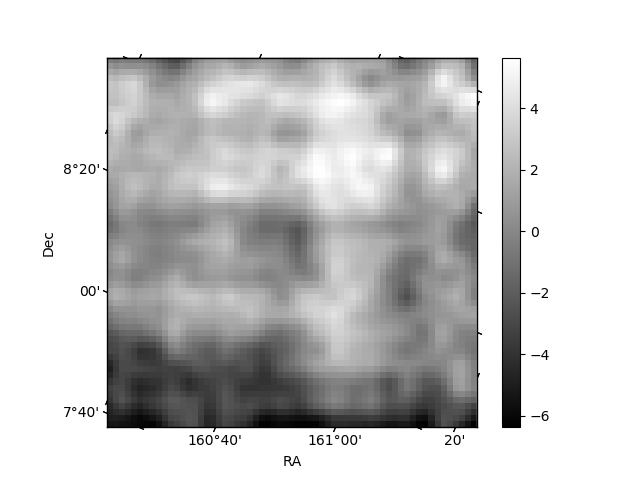
Histogram calculated using DETX and DETY for each event in the final _common_clean file
| Quadrant A | 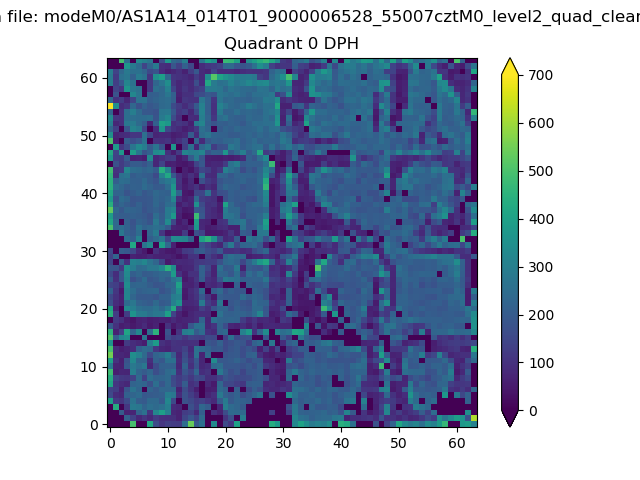 |
 |
Quadrant B |
|---|---|---|---|
| Quadrant D | 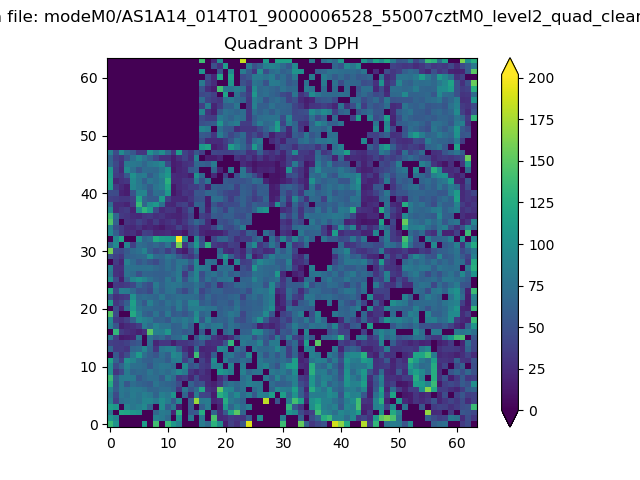 |
 |
Quadrant C |
| Plot type | Count rate plots | Images |
|---|---|---|
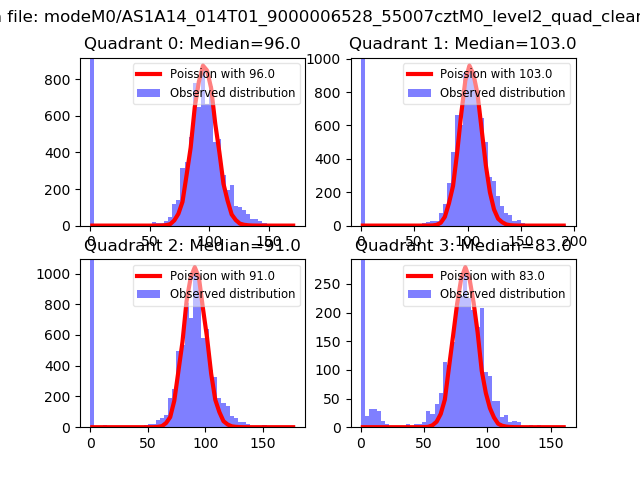
| Comparison with Poisson distribution Blue bars denote a histogram of data divided into 1 sec bins. Red curve is a Poisson curve with rate = median count rate of data. |
 |
 |
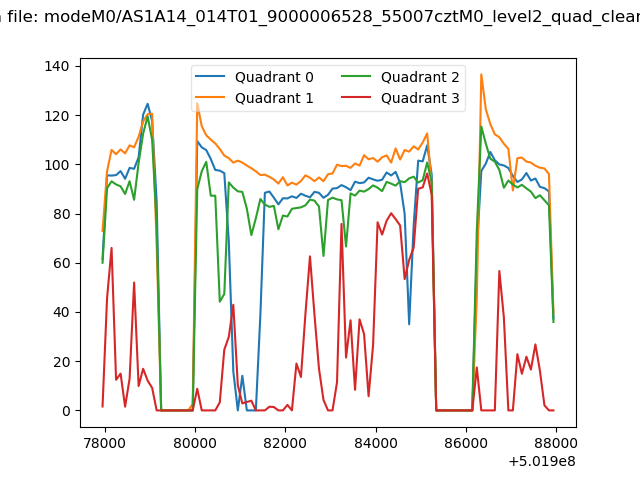
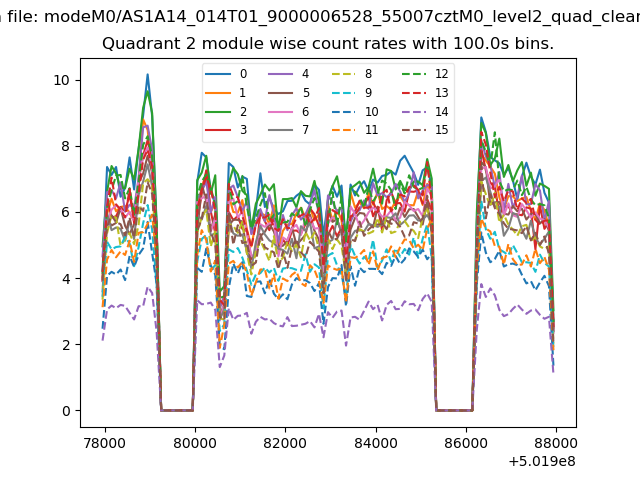
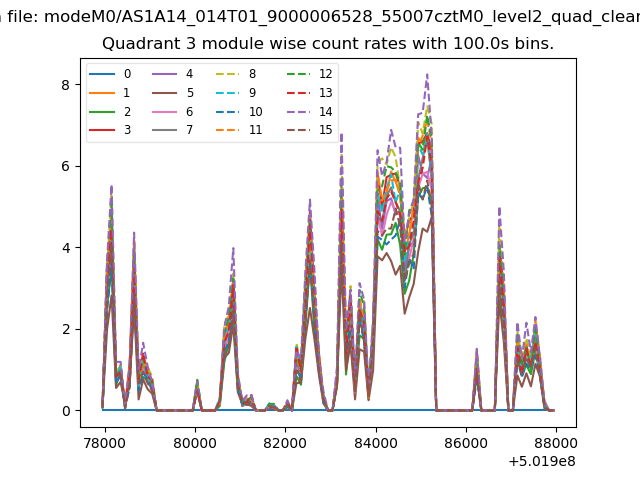
| Quadrant-wise count rates Data is divided into 100 sec bins |
 |
|
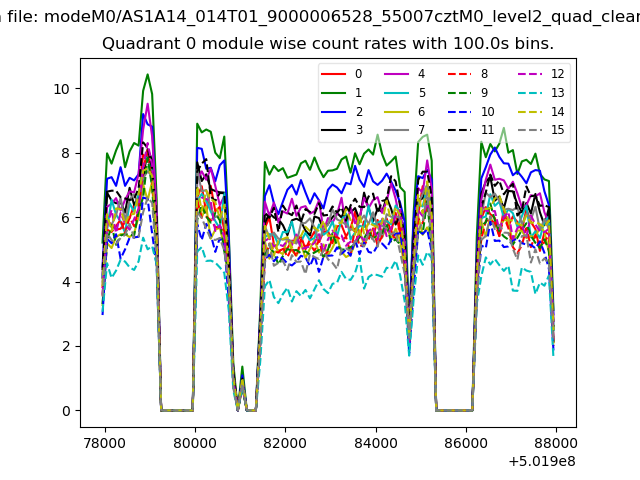
| Module-wise count rates for Quadrant A Data is divided into 100 sec bins |
 |
 |
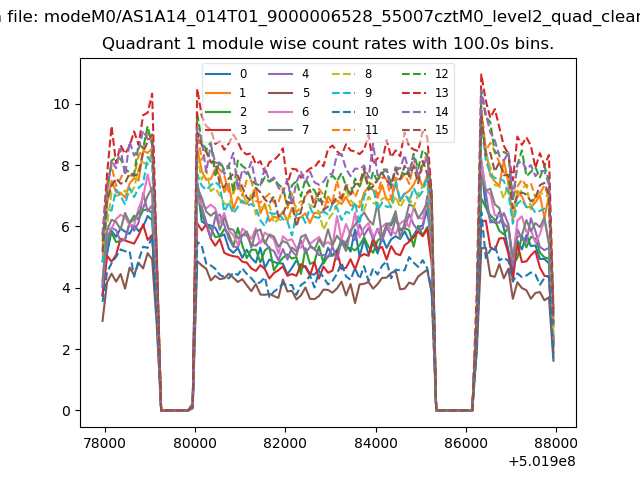
| Module-wise count rates for Quadrant B Data is divided into 100 sec bins |
 |
 |
| Module-wise count rates for Quadrant C Data is divided into 100 sec bins |
 |
 |
| Module-wise count rates for Quadrant D Data is divided into 100 sec bins |
 |
 |
| Parameter | Plot |
|---|---|
| CZT HV Monitor | 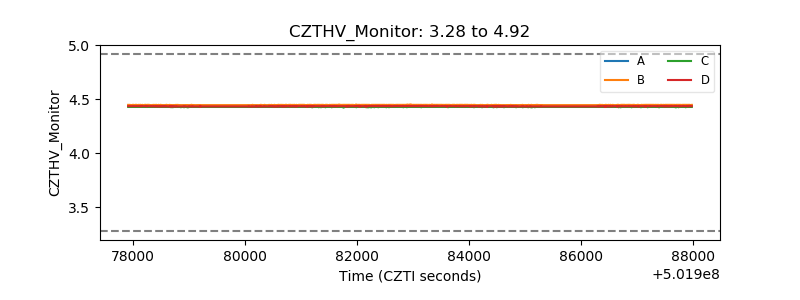 |
| D_VDD |  |
| Temperature 1 | 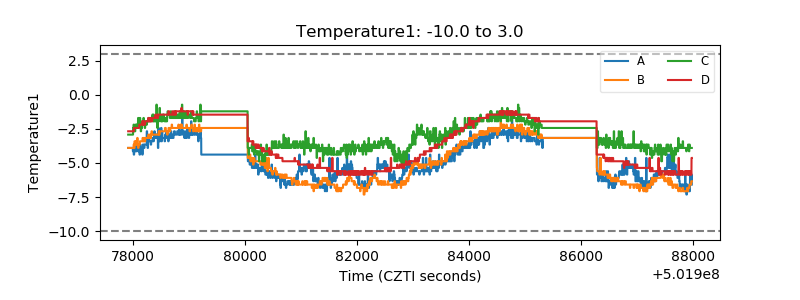 |
| Veto HV Monitor | 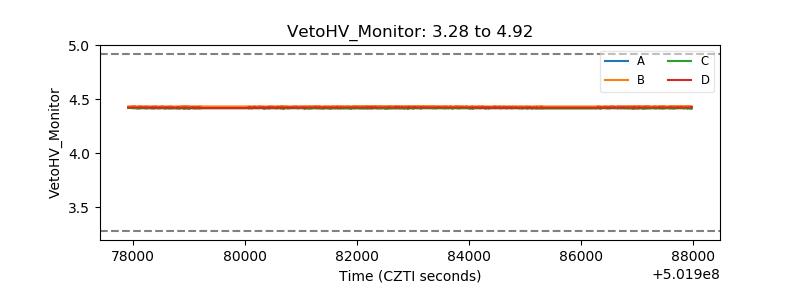 |
| Veto LLD | 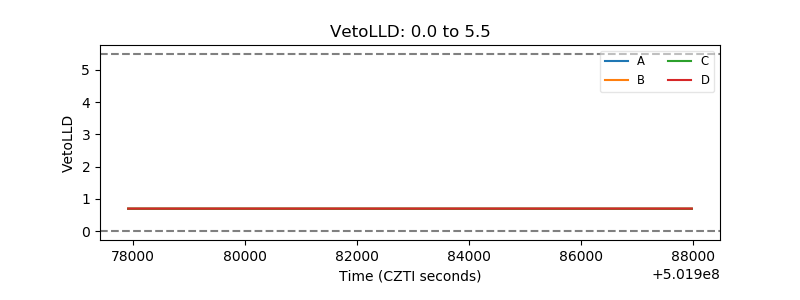 |
| Alpha Counter | 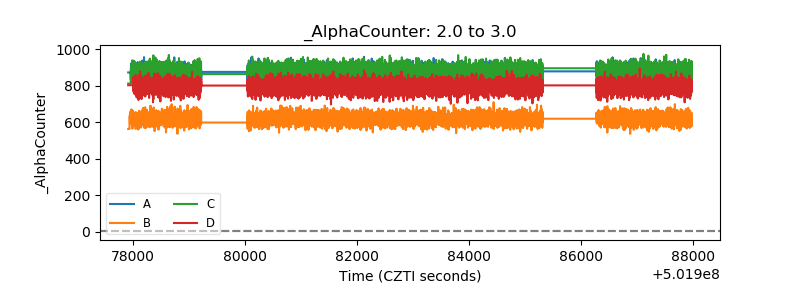 |
| _CPM_Rate | 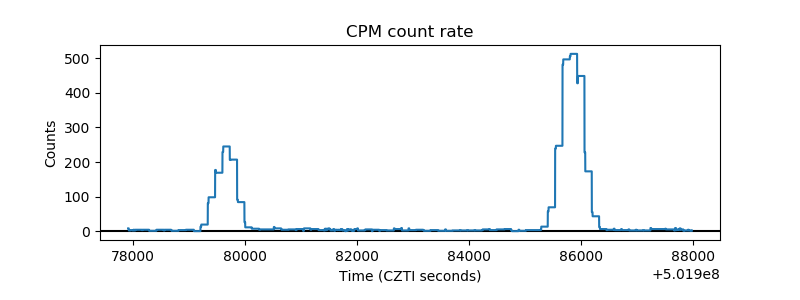 |
| CZT Counter | 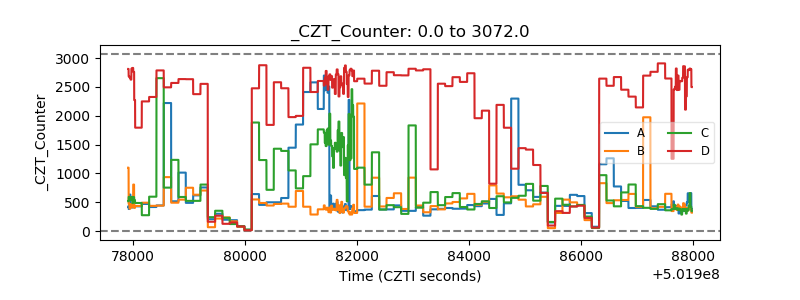 |
| +2.5 Volts monitor |  |
| +5 Volts monitor | 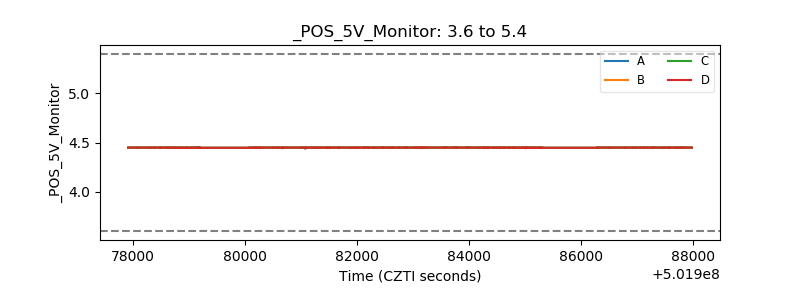 |
| _ROLL_ROT | 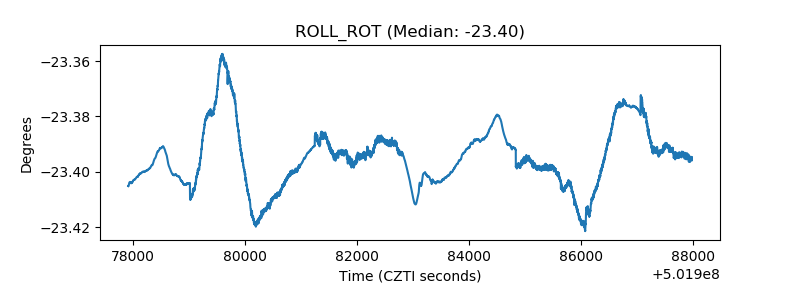 |
| _Roll_DEC | 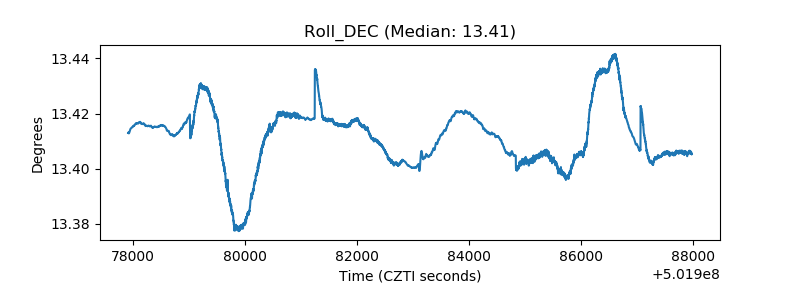 |
| _Roll_RA | 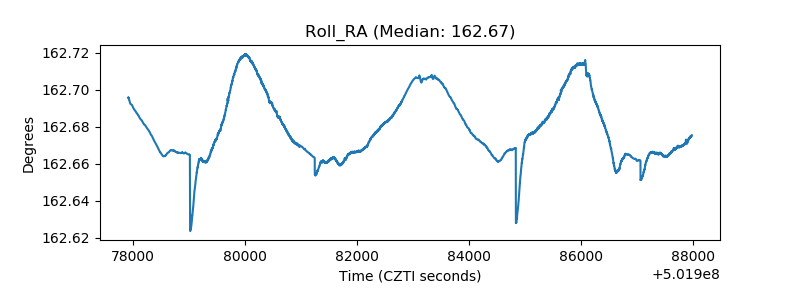 |
| Veto Counter | 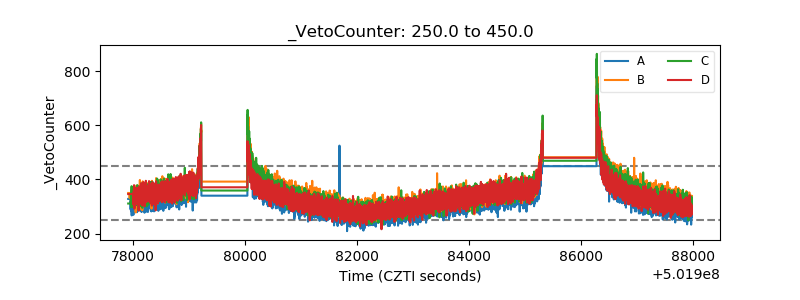 |