| Param | Original file | Final file |
|---|---|---|
| Filename | modeM0/AS1A14_014T01_9000006528_55009cztM0_level2.fits | modeM0/AS1A14_014T01_9000006528_55009cztM0_level2_quad_clean.evt |
| Size (bytes) | 933,007,680 | 76,029,120 |
| Size | 889.8 MB | 72.5 MB |
| Events in quadrant A | 4,699,215 | 640,282 |
| Events in quadrant B | 3,263,754 | 736,059 |
| Events in quadrant C | 10,042,342 | 420,504 |
| Events in quadrant D | 16,004,575 | 31,177 |
| Mode M0 | |||
|---|---|---|---|
| Quadrant | BADHDUFLAG | Total packets | Discarded packets |
| A | 0 | 18866 | 2 |
| B | 0 | 14645 | 2 |
| C | 0 | 34518 | 9 |
| D | 0 | 52217 | 2 |
| Mode SS | |||
|---|---|---|---|
| Quadrant | BADHDUFLAG | Total packets | Discarded packets |
| A | 0 | 140 | 0 |
| B | 0 | 140 | 0 |
| C | 0 | 140 | 0 |
| D | 0 | 140 | 0 |
| Mode M9 | |||
|---|---|---|---|
| Quadrant | BADHDUFLAG | Total packets | Discarded packets |
| A | 0 | 15 | 0 |
| B | 0 | 15 | 0 |
| C | 0 | 15 | 0 |
| D | 0 | 16 | 0 |
| Quadrant | Total seconds | Saturated seconds | Saturation percentage |
|---|---|---|---|
| A | 6794 | 478 | 7.035620% |
| B | 6794 | 73 | 1.074477% |
| C | 6792 | 2666 | 39.252061% |
| D | 6793 | 6496 | 95.627852% |
Noise dominated data is calculated using 1-second bins in cleaned event files. If a bin has >2000 counts, and if more than 50% of those come from <1% of pixels, then it is considered to be noise-dominated and hence unusable.
| Quadrant | # 1 sec bins | Bins with >0 counts | Bins with >2000 counts | High rate bins dominated by noise | Noise dominated (total time) | Noise dominated (detector-on time) | Marked lightcurve |
|---|---|---|---|---|---|---|---|
| A | 7949 | 6795 | 403 | 403 | 5.07% | 5.93% | 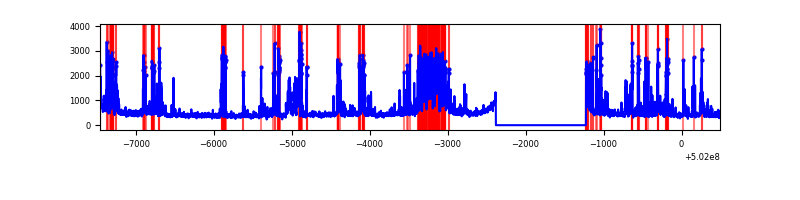 |
| B | 7949 | 6794 | 5 | 5 | 0.06% | 0.07% | 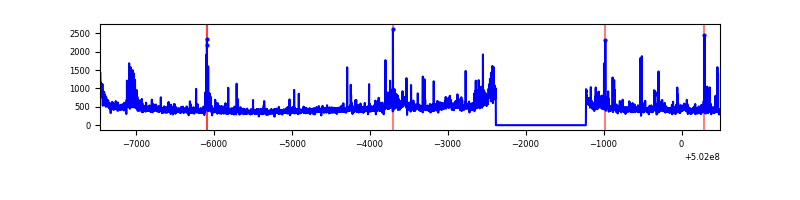 |
| C | 7948 | 6794 | 2731 | 2731 | 34.36% | 40.20% | 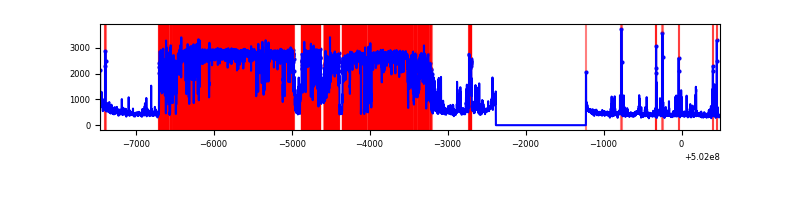 |
| D | 7947 | 6792 | 5352 | 5352 | 67.35% | 78.80% | 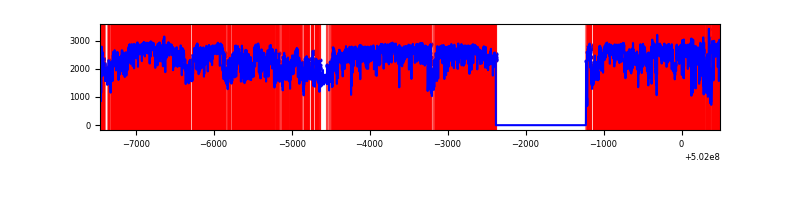 |
Top three noisy pixels from each quadrant. If the there are fewer than three noisy pixels in the level2.evt file, extra rows are filled as -1
| Pixel properties | Quadrant properties | ||||||
|---|---|---|---|---|---|---|---|
| Quadrant | DetID | PixID | Counts | Sigma | Mean | Median | Sigma |
| A | 15 | 32 | 1806261 | 10039.01 | 719 | 701 | 179.9 |
| A | 13 | 248 | 63428 | 348.77 | 719 | 701 | 179.9 |
| A | 3 | 14 | 21073 | 113.27 | 719 | 701 | 179.9 |
| B | 5 | 236 | 161291 | 1022.32 | 736 | 711 | 157.1 |
| B | 5 | 185 | 101277 | 640.24 | 736 | 711 | 157.1 |
| B | 10 | 28 | 22819 | 140.75 | 736 | 711 | 157.1 |
| C | 9 | 38 | 7235628 | 44138.56 | 592 | 587 | 163.9 |
| C | 1 | 16 | 130806 | 794.42 | 592 | 587 | 163.9 |
| C | 14 | 254 | 123031 | 746.99 | 592 | 587 | 163.9 |
| D | 15 | 94 | 14923370 | 291880.52 | 171 | 162 | 51.1 |
| D | 2 | 249 | 93184 | 1819.4 | 171 | 162 | 51.1 |
| D | 3 | 224 | 56812 | 1108.01 | 171 | 162 | 51.1 |
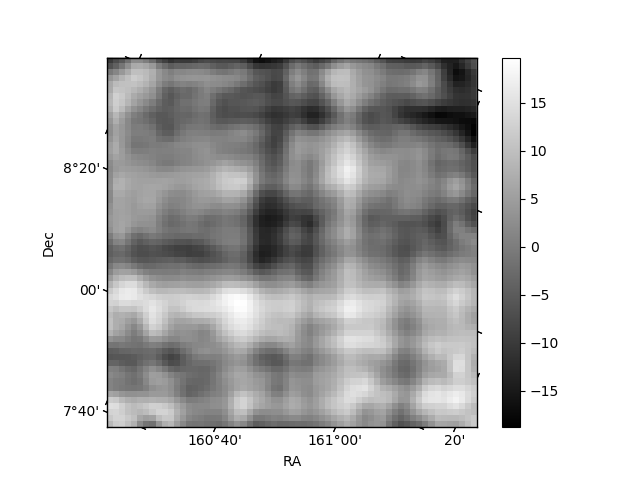
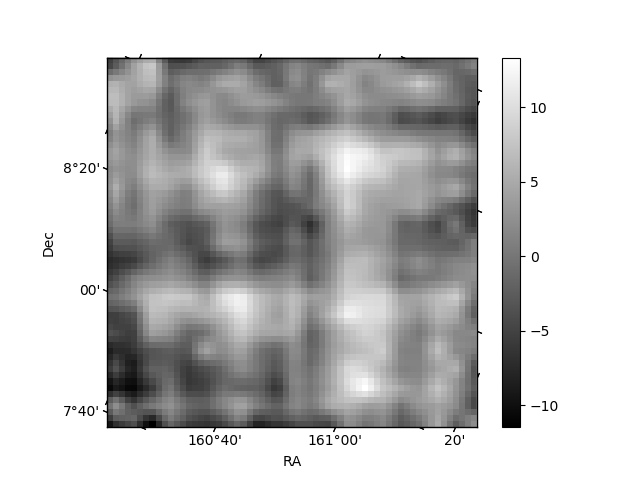
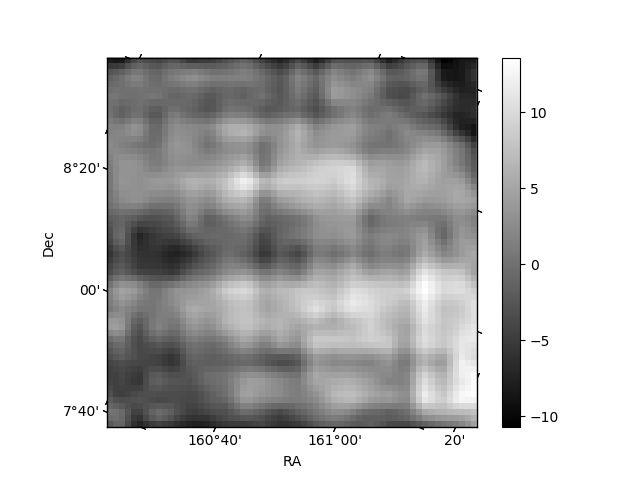
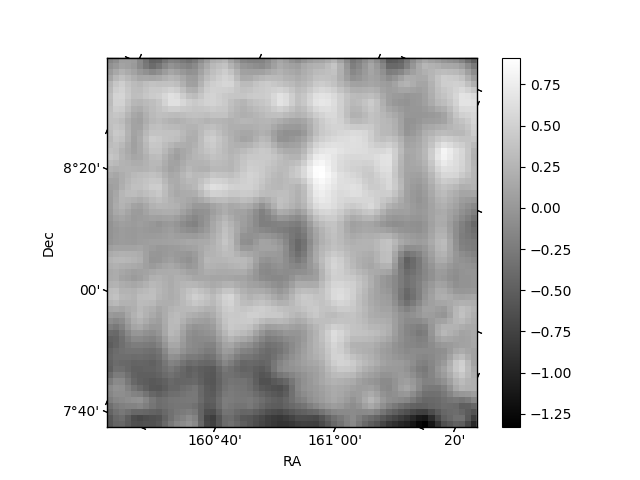
Histogram calculated using DETX and DETY for each event in the final _common_clean file
| Quadrant A | 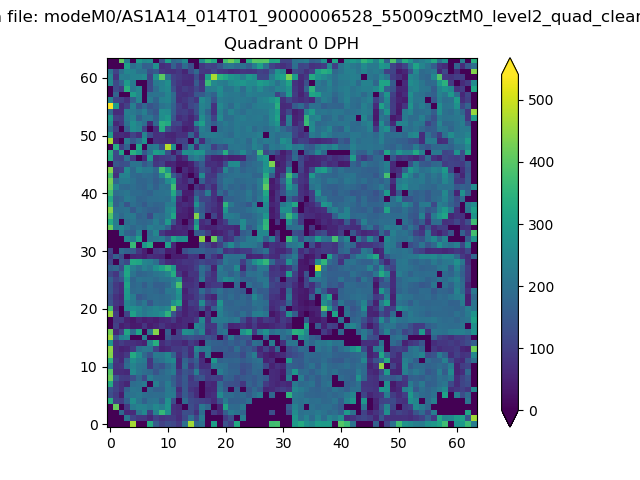 |
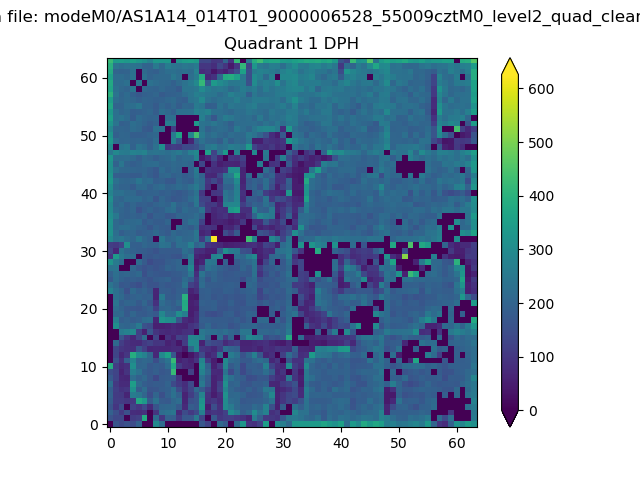 |
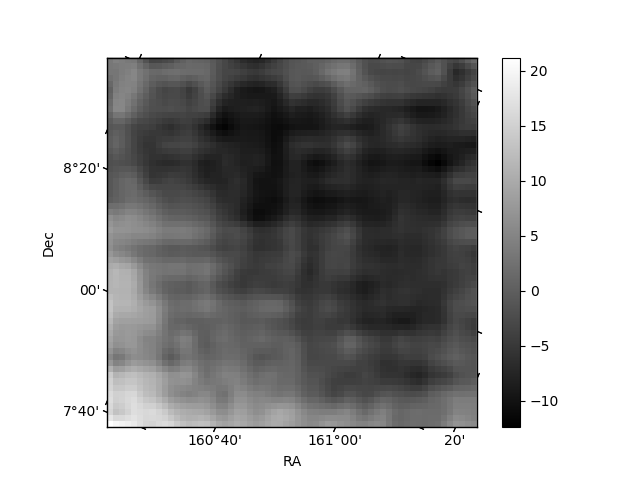
Quadrant B |
|---|---|---|---|
| Quadrant D | 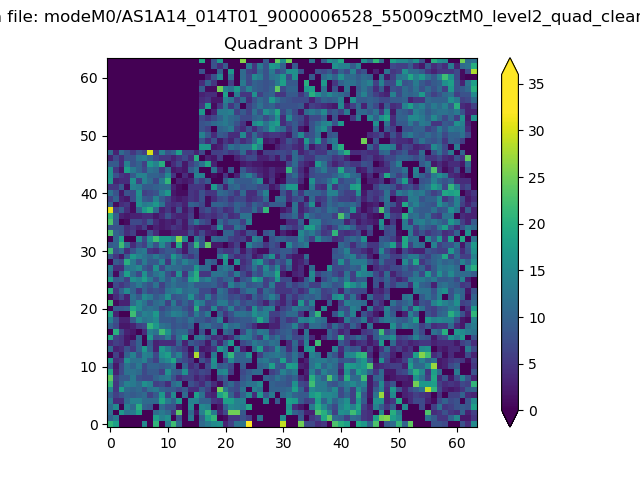 |
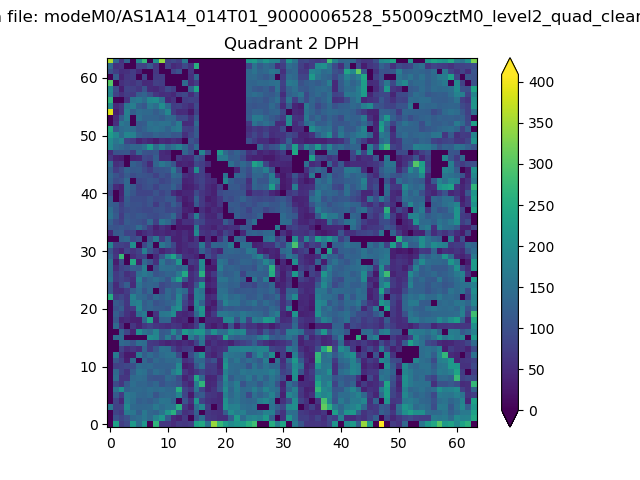 |
Quadrant C |
| Plot type | Count rate plots | Images |
|---|---|---|
| Comparison with Poisson distribution Blue bars denote a histogram of data divided into 1 sec bins. Red curve is a Poisson curve with rate = median count rate of data. |
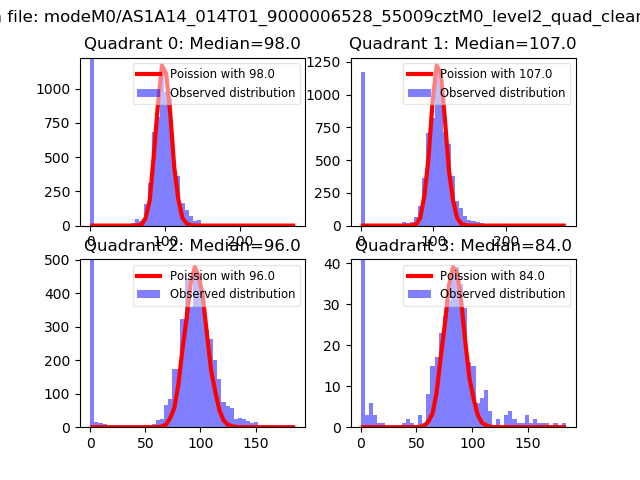 |
 |
| Quadrant-wise count rates Data is divided into 100 sec bins |
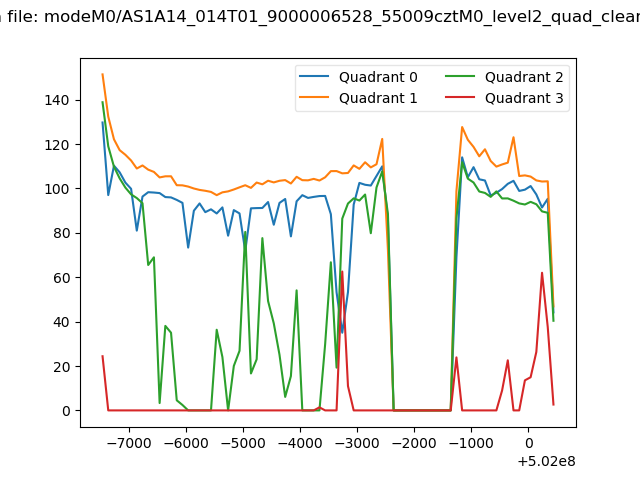 |
|
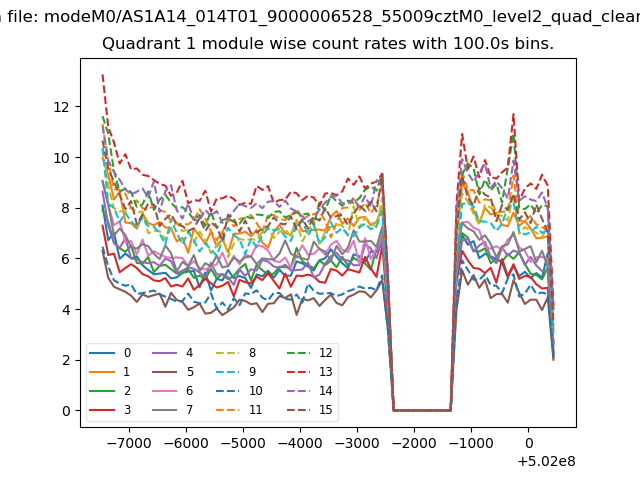
| Module-wise count rates for Quadrant A Data is divided into 100 sec bins |
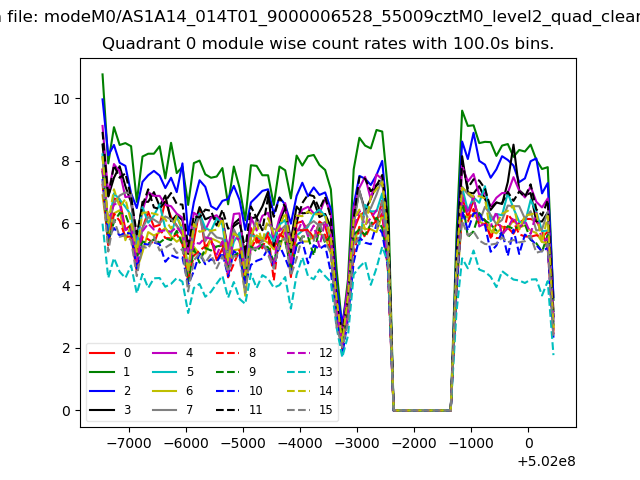 |
 |
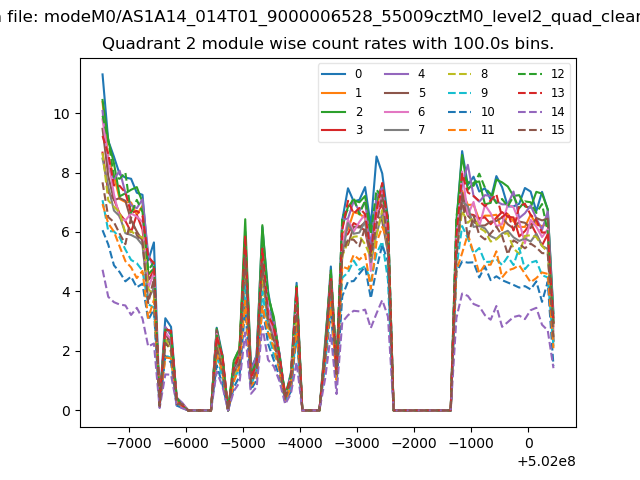
| Module-wise count rates for Quadrant B Data is divided into 100 sec bins |
 |
 |
| Module-wise count rates for Quadrant C Data is divided into 100 sec bins |
 |
 |
| Module-wise count rates for Quadrant D Data is divided into 100 sec bins |
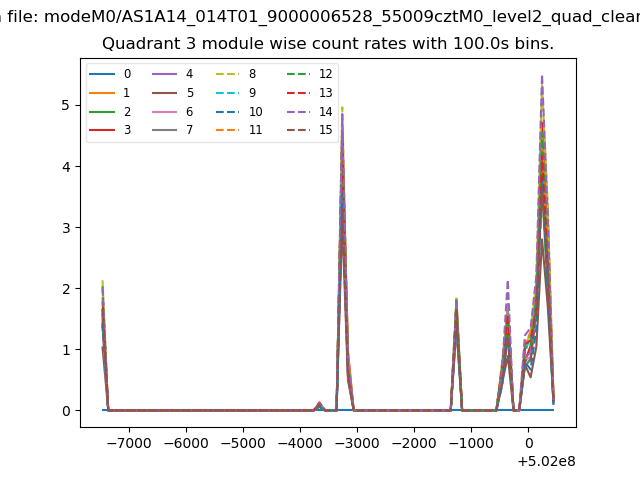 |
 |
| Parameter | Plot |
|---|---|
| CZT HV Monitor | 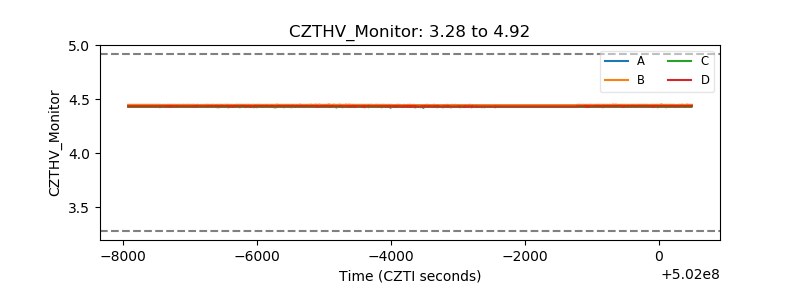 |
| D_VDD | 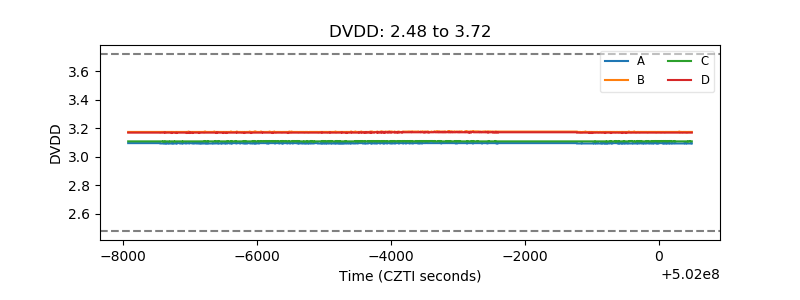 |
| Temperature 1 | 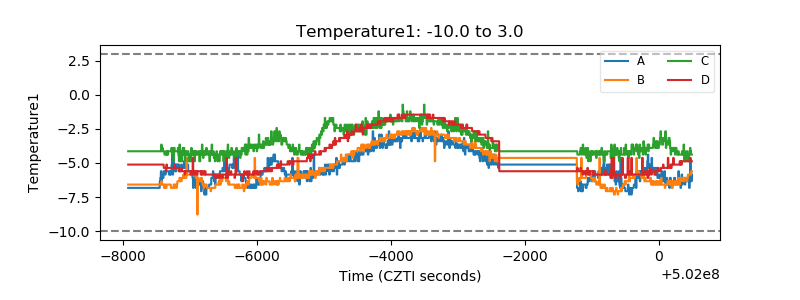 |
| Veto HV Monitor | 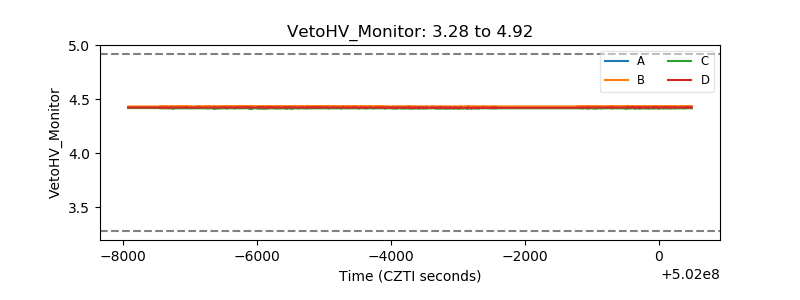 |
| Veto LLD | 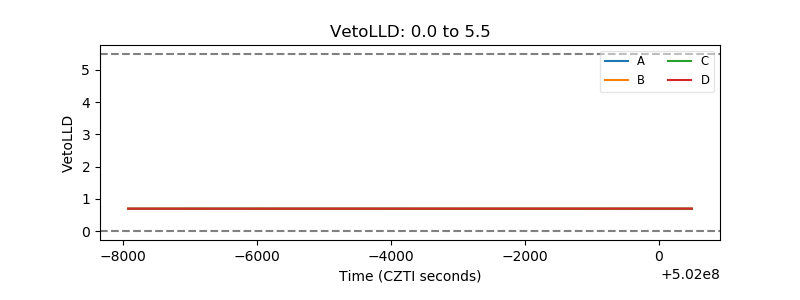 |
| Alpha Counter |  |
| _CPM_Rate | 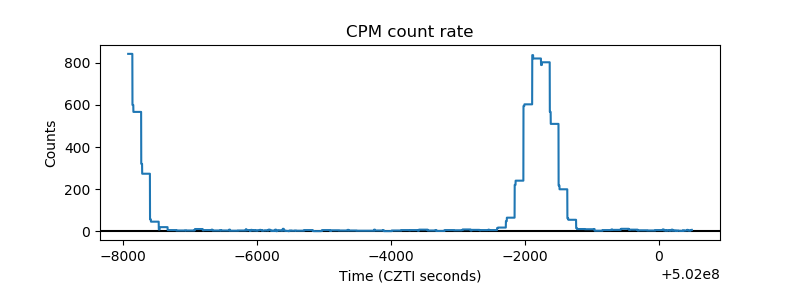 |
| CZT Counter | 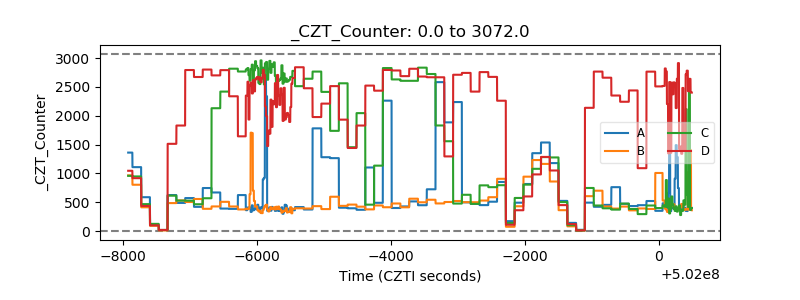 |
| +2.5 Volts monitor |  |
| +5 Volts monitor | 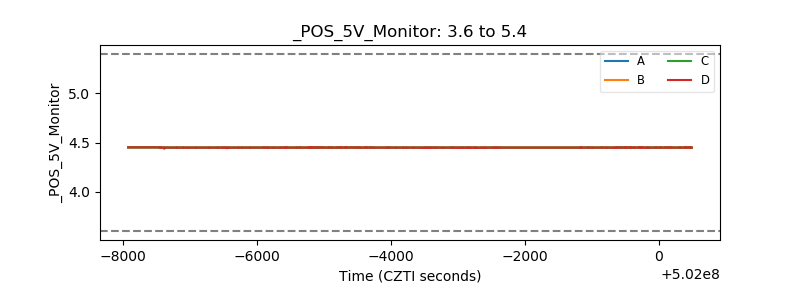 |
| _ROLL_ROT | 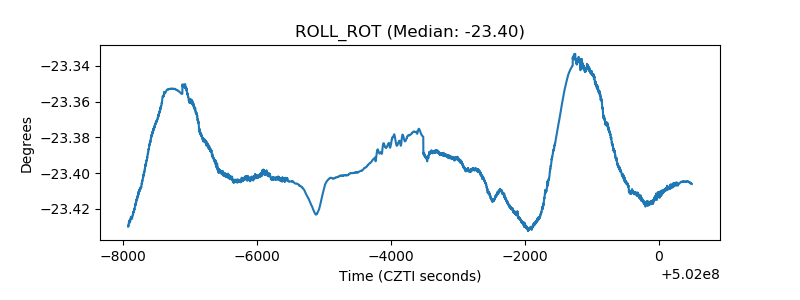 |
| _Roll_DEC | 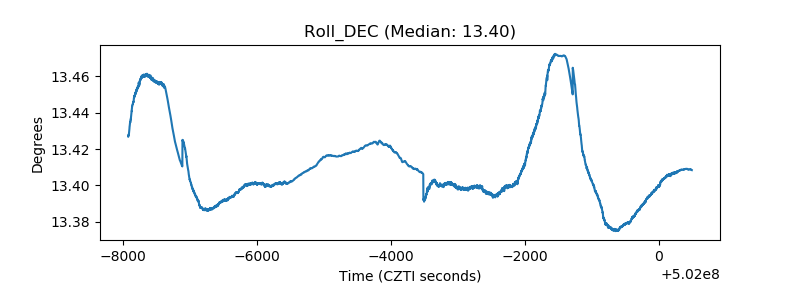 |
| _Roll_RA | 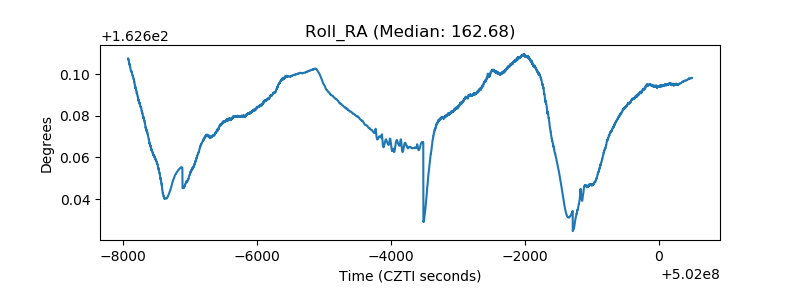 |
| Veto Counter | 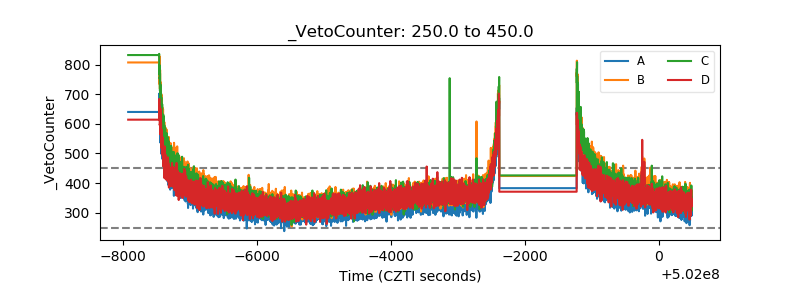 |