| Param | Original file | Final file |
|---|---|---|
| Filename | modeM0/AS1A14_025T01_9000006530_55014cztM0_level2.fits | modeM0/AS1A14_025T01_9000006530_55014cztM0_level2_quad_clean.evt |
| Size (bytes) | 864,504,000 | 82,368,000 |
| Size | 824.5 MB | 78.6 MB |
| Events in quadrant A | 3,600,071 | 679,094 |
| Events in quadrant B | 3,649,980 | 739,201 |
| Events in quadrant C | 5,972,034 | 555,928 |
| Events in quadrant D | 18,211,312 | 11,343 |
| Mode M0 | |||
|---|---|---|---|
| Quadrant | BADHDUFLAG | Total packets | Discarded packets |
| A | 0 | 16158 | 0 |
| B | 0 | 16106 | 1 |
| C | 0 | 23191 | 19 |
| D | 0 | 59133 | 9 |
| Mode SS | |||
|---|---|---|---|
| Quadrant | BADHDUFLAG | Total packets | Discarded packets |
| A | 0 | 146 | 0 |
| B | 0 | 146 | 0 |
| C | 0 | 146 | 0 |
| D | 0 | 146 | 0 |
| Quadrant | Total seconds | Saturated seconds | Saturation percentage |
|---|---|---|---|
| A | 7303 | 137 | 1.875941% |
| B | 7302 | 99 | 1.355793% |
| C | 7300 | 1089 | 14.917808% |
| D | 7302 | 7190 | 98.466174% |
Noise dominated data is calculated using 1-second bins in cleaned event files. If a bin has >2000 counts, and if more than 50% of those come from <1% of pixels, then it is considered to be noise-dominated and hence unusable.
| Quadrant | # 1 sec bins | Bins with >0 counts | Bins with >2000 counts | High rate bins dominated by noise | Noise dominated (total time) | Noise dominated (detector-on time) | Marked lightcurve |
|---|---|---|---|---|---|---|---|
| A | 7303 | 7303 | 66 | 66 | 0.90% | 0.90% | 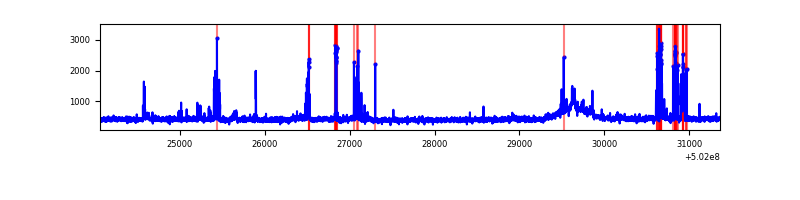 |
| B | 7302 | 7302 | 45 | 45 | 0.62% | 0.62% | 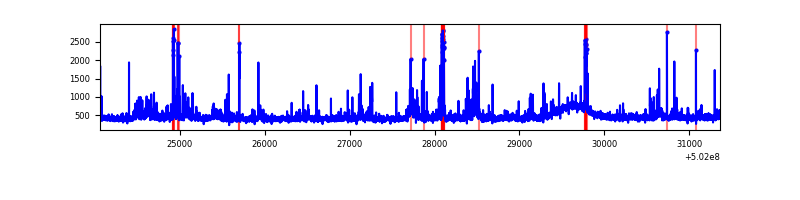 |
| C | 7303 | 7302 | 1070 | 1070 | 14.65% | 14.65% | 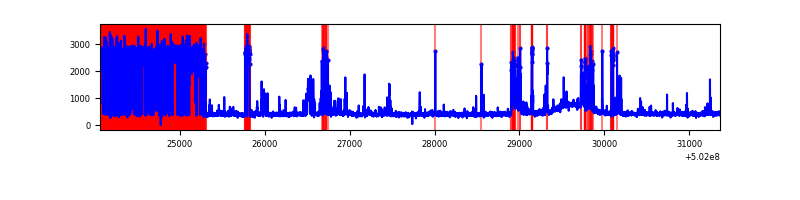 |
| D | 7302 | 7301 | 6603 | 6603 | 90.43% | 90.44% | 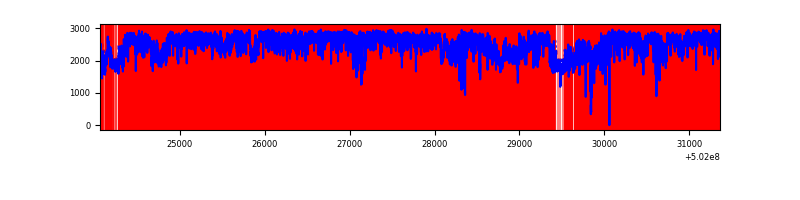 |
Top three noisy pixels from each quadrant. If the there are fewer than three noisy pixels in the level2.evt file, extra rows are filled as -1
| Pixel properties | Quadrant properties | ||||||
|---|---|---|---|---|---|---|---|
| Quadrant | DetID | PixID | Counts | Sigma | Mean | Median | Sigma |
| A | 15 | 32 | 371827 | 1903.33 | 794 | 772 | 194.9 |
| A | 13 | 248 | 107586 | 547.9 | 794 | 772 | 194.9 |
| A | 4 | 3 | 14301 | 69.4 | 794 | 772 | 194.9 |
| B | 5 | 185 | 287267 | 1658.46 | 790 | 761 | 172.8 |
| B | 5 | 172 | 62593 | 357.92 | 790 | 761 | 172.8 |
| B | 2 | 249 | 58257 | 332.82 | 790 | 761 | 172.8 |
| C | 4 | 5 | 2678413 | 13593.25 | 722 | 716 | 197.0 |
| C | 15 | 193 | 184777 | 934.38 | 722 | 716 | 197.0 |
| C | 6 | 223 | 103169 | 520.1 | 722 | 716 | 197.0 |
| D | 15 | 94 | 17115919 | 356185.76 | 161 | 153 | 48.1 |
| D | 2 | 172 | 150286 | 3124.33 | 161 | 153 | 48.1 |
| D | 11 | 129 | 148577 | 3088.76 | 161 | 153 | 48.1 |
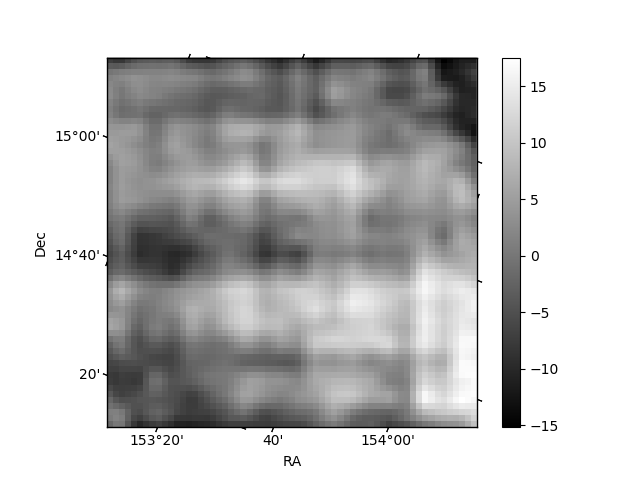
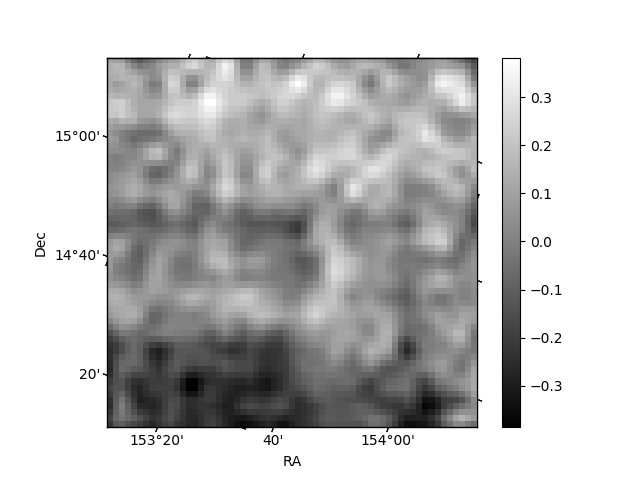
Histogram calculated using DETX and DETY for each event in the final _common_clean file
| Quadrant A |  |
 |
Quadrant B |
|---|---|---|---|
| Quadrant D | 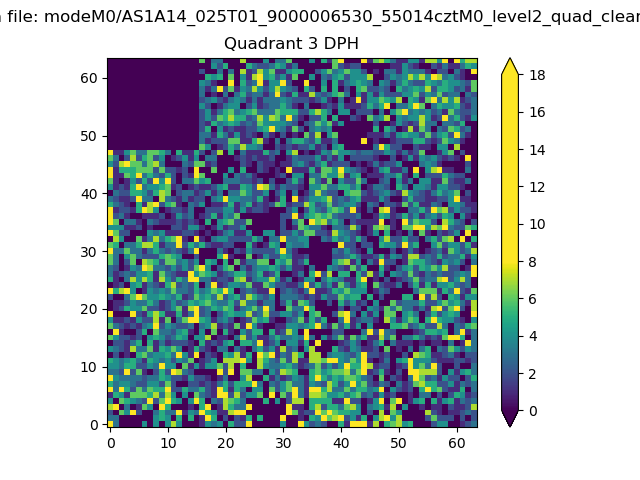 |
 |
Quadrant C |
| Plot type | Count rate plots | Images |
|---|---|---|
| Comparison with Poisson distribution Blue bars denote a histogram of data divided into 1 sec bins. Red curve is a Poisson curve with rate = median count rate of data. |
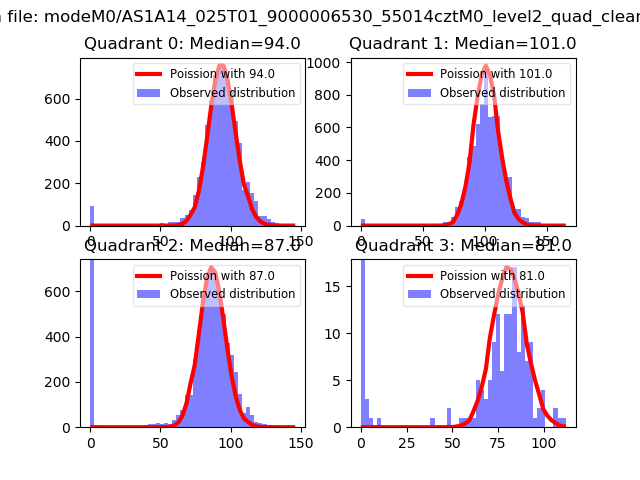 |
 |
| Quadrant-wise count rates Data is divided into 100 sec bins |
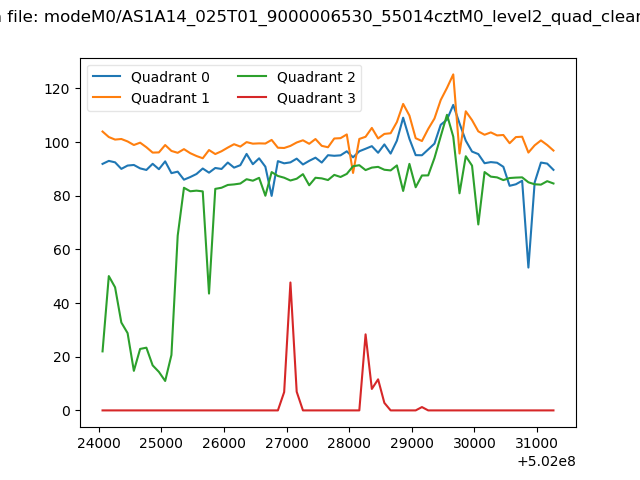 |
|
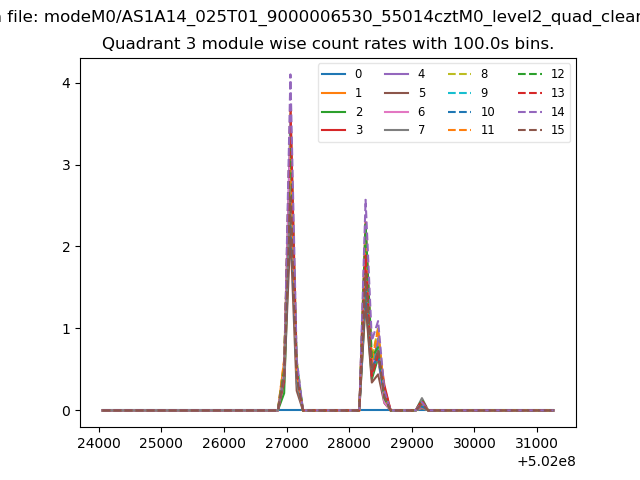
| Module-wise count rates for Quadrant A Data is divided into 100 sec bins |
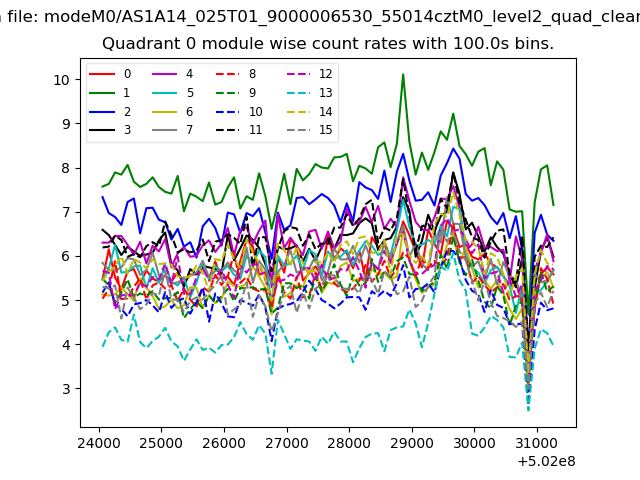 |
 |
| Module-wise count rates for Quadrant B Data is divided into 100 sec bins |
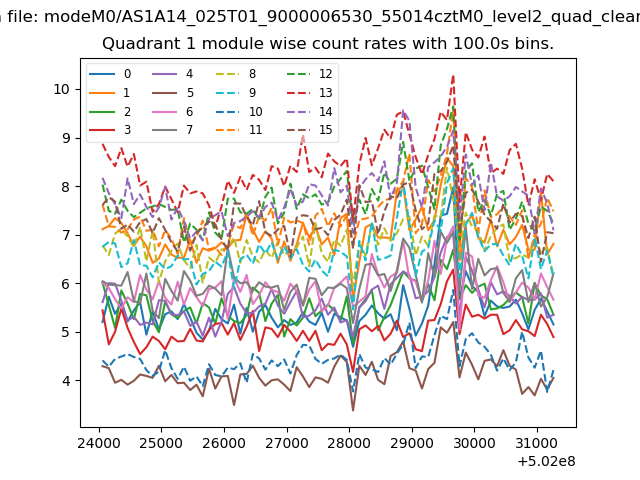 |
 |
| Module-wise count rates for Quadrant C Data is divided into 100 sec bins |
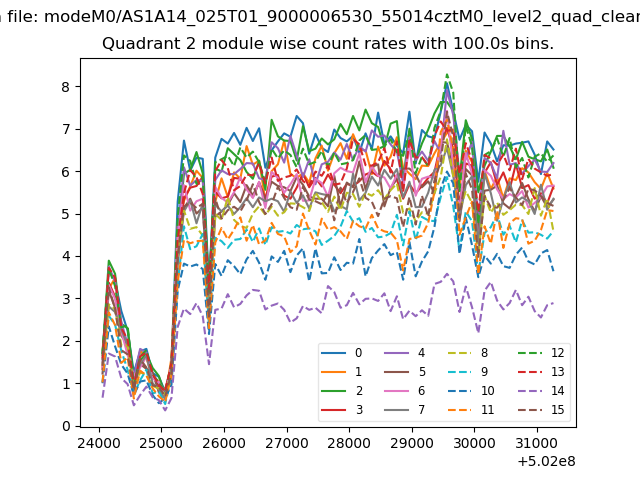 |
 |
| Module-wise count rates for Quadrant D Data is divided into 100 sec bins |
 |
 |
| Parameter | Plot |
|---|---|
| CZT HV Monitor |  |
| D_VDD | 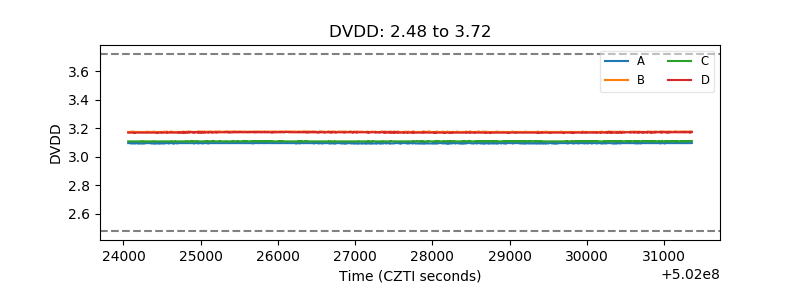 |
| Temperature 1 | 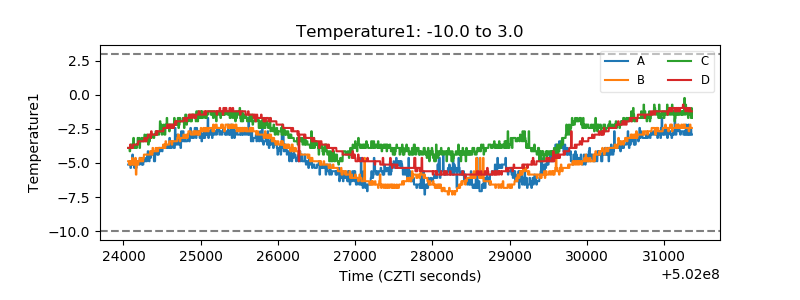 |
| Veto HV Monitor | 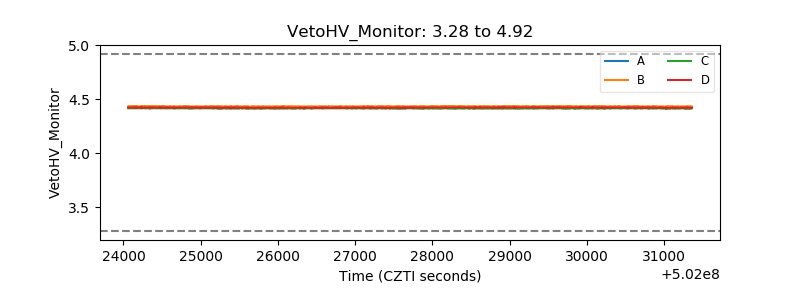 |
| Veto LLD | 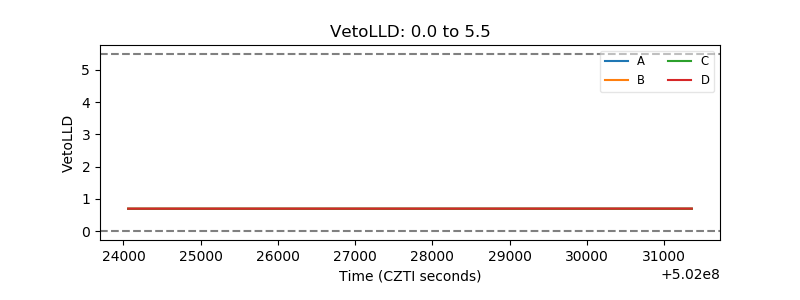 |
| Alpha Counter | 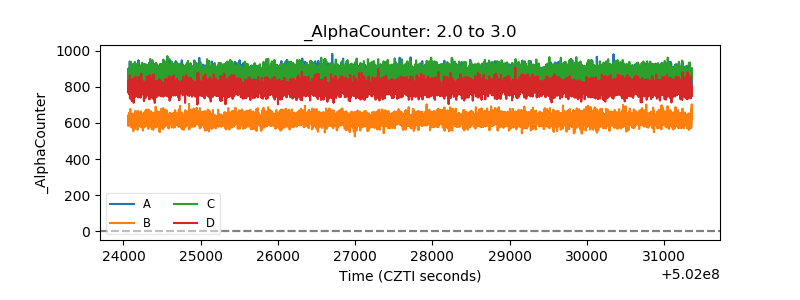 |
| _CPM_Rate | 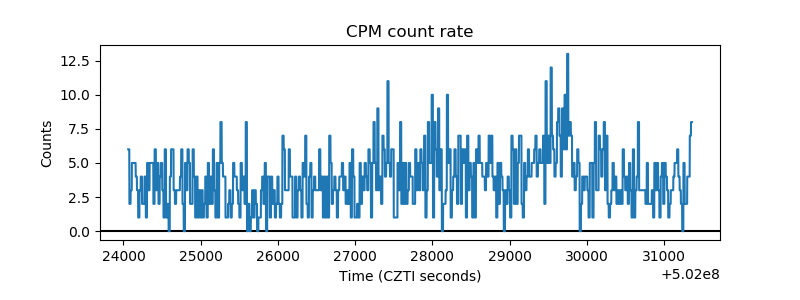 |
| CZT Counter | 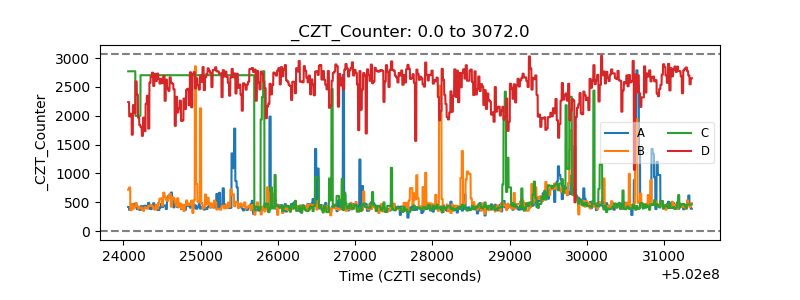 |
| +2.5 Volts monitor |  |
| +5 Volts monitor |  |
| _ROLL_ROT | 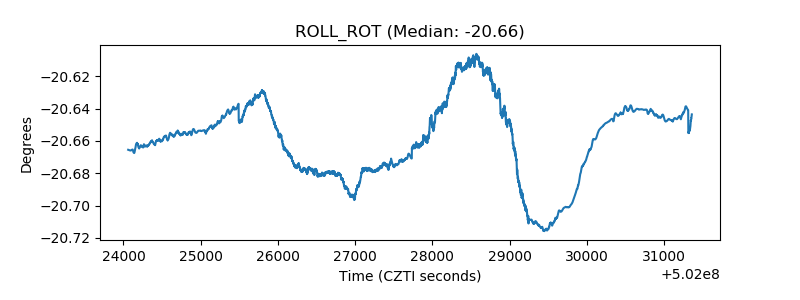 |
| _Roll_DEC | 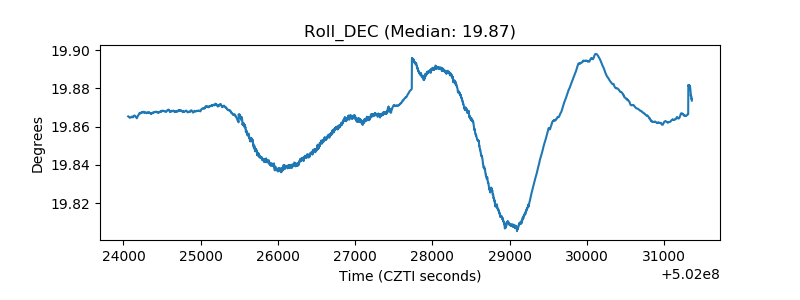 |
| _Roll_RA | 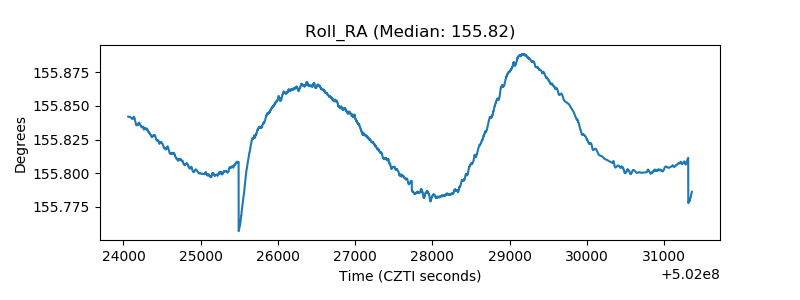 |
| Veto Counter | 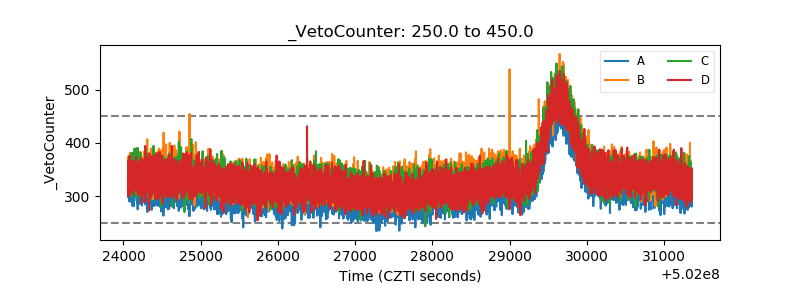 |