| Param | Original file | Final file |
|---|---|---|
| Filename | modeM0/AS1A14_025T01_9000006530_55022cztM0_level2.fits | modeM0/AS1A14_025T01_9000006530_55022cztM0_level2_quad_clean.evt |
| Size (bytes) | 687,830,400 | 61,657,920 |
| Size | 656.0 MB | 58.8 MB |
| Events in quadrant A | 6,518,518 | 410,713 |
| Events in quadrant B | 3,595,830 | 504,181 |
| Events in quadrant C | 3,298,921 | 476,572 |
| Events in quadrant D | 11,622,338 | 92,422 |
| Mode M0 | |||
|---|---|---|---|
| Quadrant | BADHDUFLAG | Total packets | Discarded packets |
| A | 0 | 23242 | 53 |
| B | 0 | 14903 | 103 |
| C | 0 | 13856 | 16 |
| D | 0 | 38412 | 82 |
| Mode SS | |||
|---|---|---|---|
| Quadrant | BADHDUFLAG | Total packets | Discarded packets |
| A | 0 | 112 | 0 |
| B | 0 | 112 | 0 |
| C | 0 | 112 | 0 |
| D | 0 | 112 | 0 |
| Mode M9 | |||
|---|---|---|---|
| Quadrant | BADHDUFLAG | Total packets | Discarded packets |
| A | 0 | 16 | 0 |
| B | 0 | 16 | 1 |
| C | 0 | 16 | 0 |
| D | 0 | 16 | 0 |
| Quadrant | Total seconds | Saturated seconds | Saturation percentage |
|---|---|---|---|
| A | 5475 | 1250 | 22.831050% |
| B | 5469 | 525 | 9.599561% |
| C | 5477 | 261 | 4.765383% |
| D | 5471 | 4548 | 83.129227% |
Noise dominated data is calculated using 1-second bins in cleaned event files. If a bin has >2000 counts, and if more than 50% of those come from <1% of pixels, then it is considered to be noise-dominated and hence unusable.
| Quadrant | # 1 sec bins | Bins with >0 counts | Bins with >2000 counts | High rate bins dominated by noise | Noise dominated (total time) | Noise dominated (detector-on time) | Marked lightcurve |
|---|---|---|---|---|---|---|---|
| A | 6201 | 5474 | 1125 | 1125 | 18.14% | 20.55% | 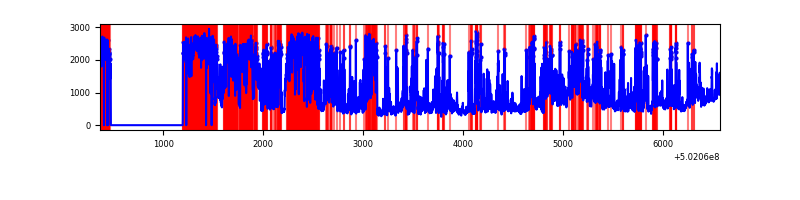 |
| B | 6201 | 5469 | 477 | 477 | 7.69% | 8.72% | 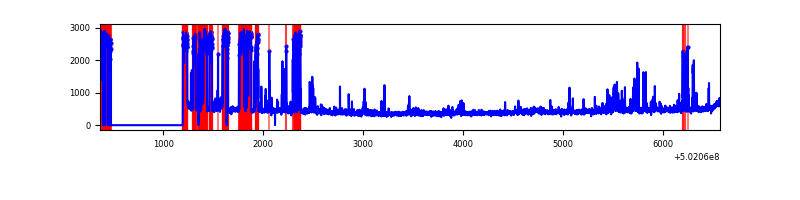 |
| C | 6202 | 5480 | 192 | 192 | 3.10% | 3.50% | 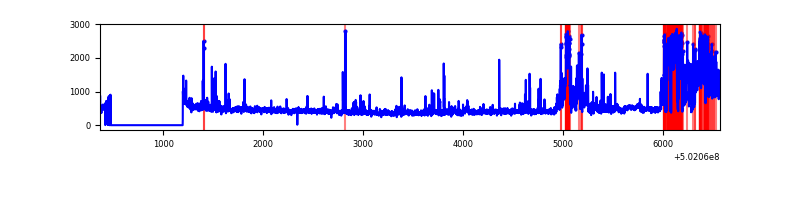 |
| D | 6202 | 5470 | 3590 | 3590 | 57.88% | 65.63% | 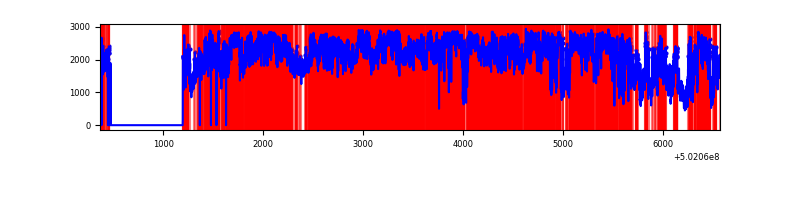 |
Top three noisy pixels from each quadrant. If the there are fewer than three noisy pixels in the level2.evt file, extra rows are filled as -1
| Pixel properties | Quadrant properties | ||||||
|---|---|---|---|---|---|---|---|
| Quadrant | DetID | PixID | Counts | Sigma | Mean | Median | Sigma |
| A | 15 | 32 | 3458507 | 27241.75 | 505 | 492 | 126.9 |
| A | 12 | 115 | 768681 | 6051.68 | 505 | 492 | 126.9 |
| A | 0 | 8 | 207375 | 1629.79 | 505 | 492 | 126.9 |
| B | 0 | 183 | 1212894 | 10579.19 | 530 | 513 | 114.6 |
| B | 10 | 245 | 103390 | 897.7 | 530 | 513 | 114.6 |
| B | 5 | 236 | 67770 | 586.88 | 530 | 513 | 114.6 |
| C | 4 | 5 | 705093 | 4543.86 | 561 | 556 | 155.1 |
| C | 13 | 3 | 228759 | 1471.78 | 561 | 556 | 155.1 |
| C | 1 | 16 | 39544 | 251.45 | 561 | 556 | 155.1 |
| D | 15 | 94 | 9317648 | 135119.67 | 236 | 224 | 69.0 |
| D | 11 | 129 | 918448 | 13315.92 | 236 | 224 | 69.0 |
| D | 15 | 93 | 108274 | 1566.92 | 236 | 224 | 69.0 |
Histogram calculated using DETX and DETY for each event in the final _common_clean file
| Quadrant A | 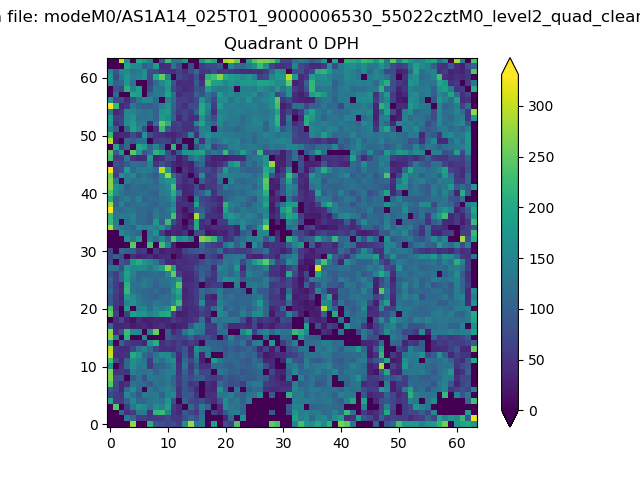 |
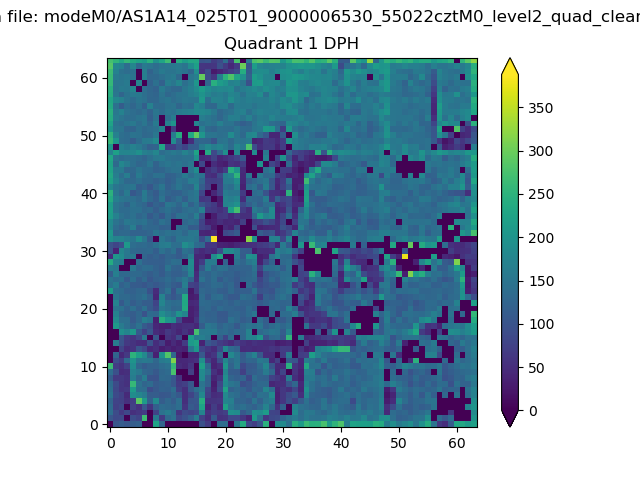 |
Quadrant B |
|---|---|---|---|
| Quadrant D | 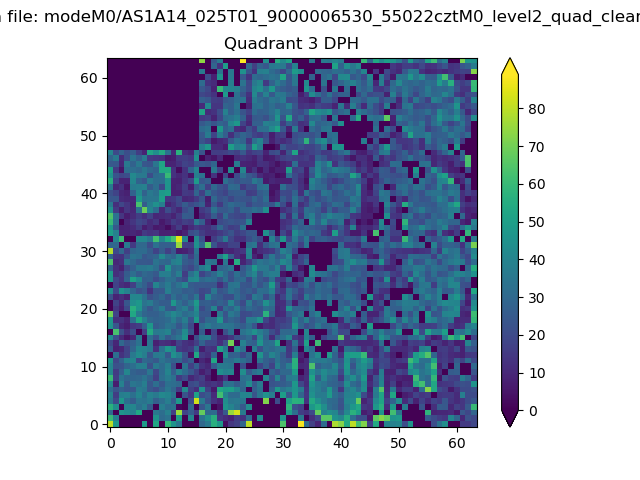 |
 |
Quadrant C |
| Plot type | Count rate plots | Images |
|---|---|---|
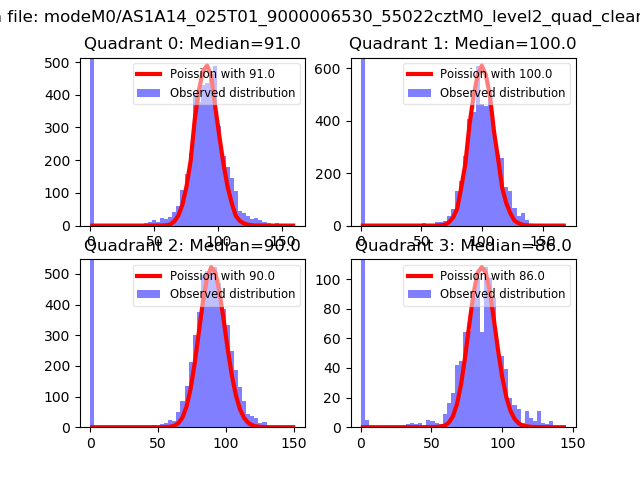
| Comparison with Poisson distribution Blue bars denote a histogram of data divided into 1 sec bins. Red curve is a Poisson curve with rate = median count rate of data. |
 |
 |
| Quadrant-wise count rates Data is divided into 100 sec bins |
 |
|
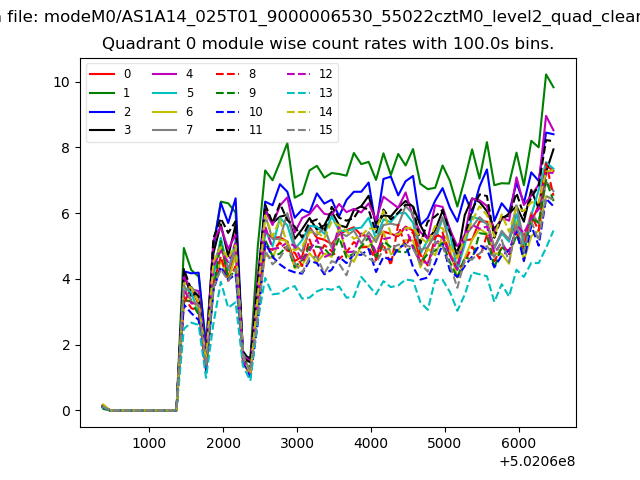
| Module-wise count rates for Quadrant A Data is divided into 100 sec bins |
 |
 |
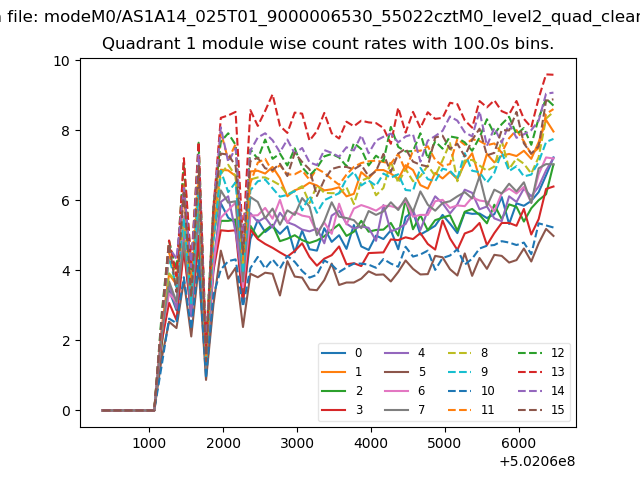
| Module-wise count rates for Quadrant B Data is divided into 100 sec bins |
 |
 |
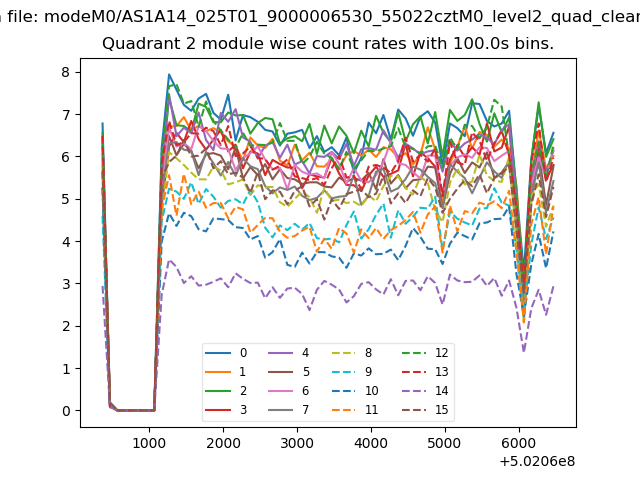
| Module-wise count rates for Quadrant C Data is divided into 100 sec bins |
 |
 |
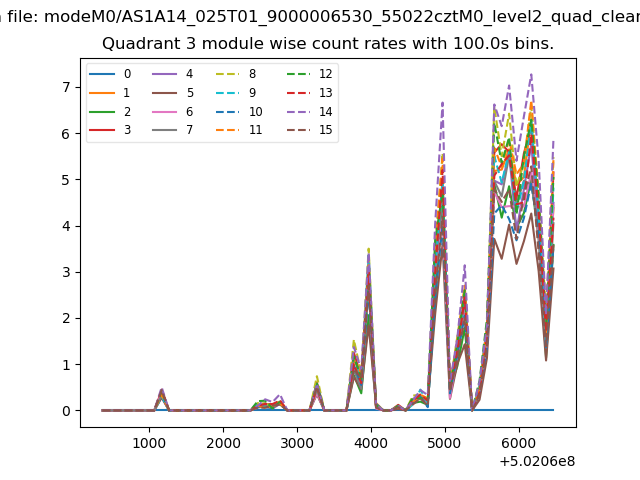
| Module-wise count rates for Quadrant D Data is divided into 100 sec bins |
 |
 |
| Parameter | Plot |
|---|---|
| CZT HV Monitor |  |
| D_VDD | 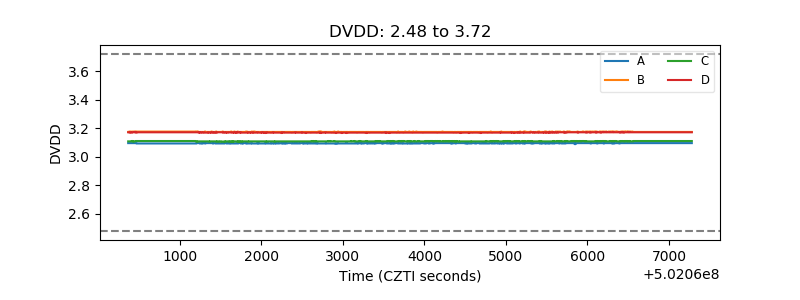 |
| Temperature 1 | 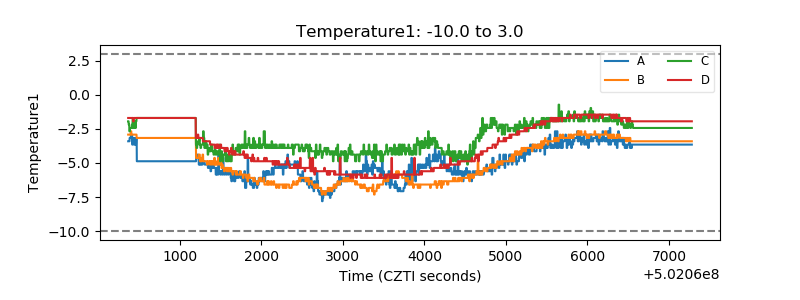 |
| Veto HV Monitor | 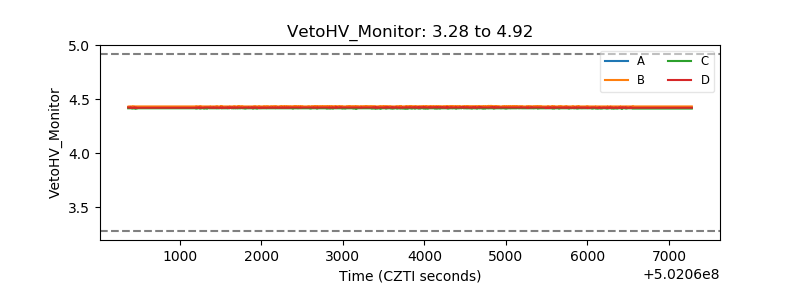 |
| Veto LLD | 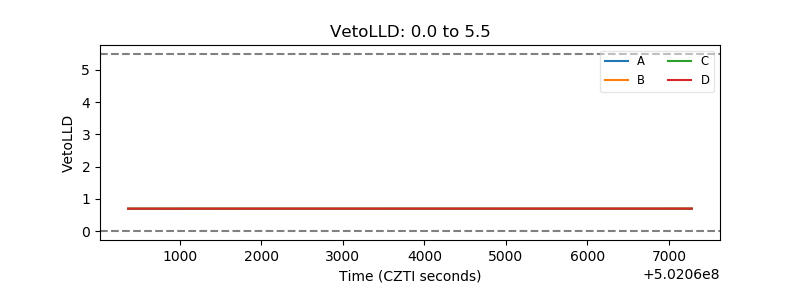 |
| Alpha Counter | 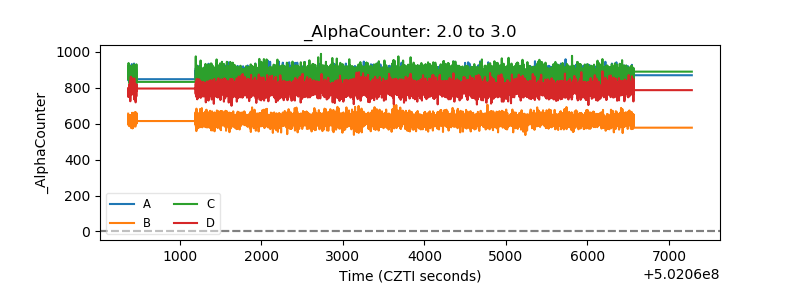 |
| _CPM_Rate |  |
| CZT Counter | 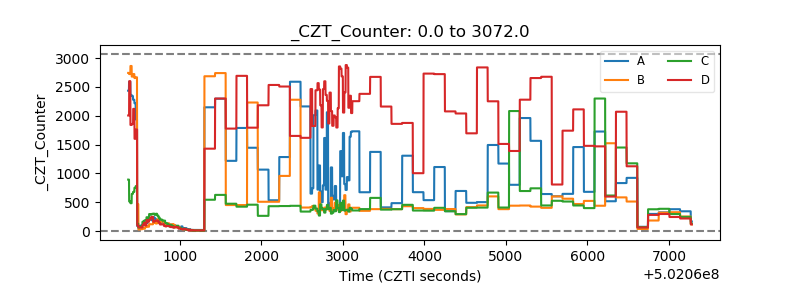 |
| +2.5 Volts monitor |  |
| +5 Volts monitor |  |
| _ROLL_ROT | 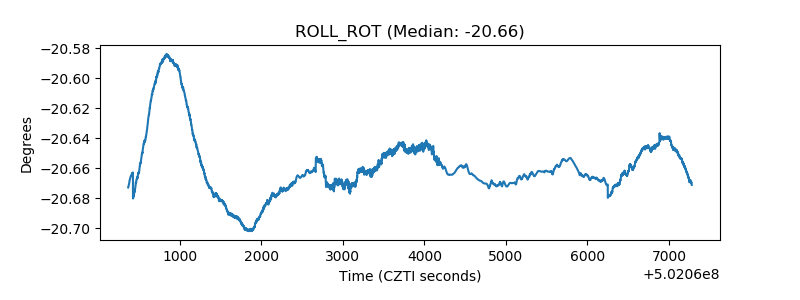 |
| _Roll_DEC | 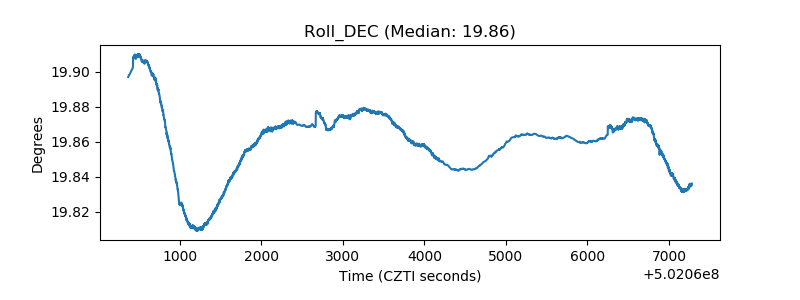 |
| _Roll_RA |  |
| Veto Counter | 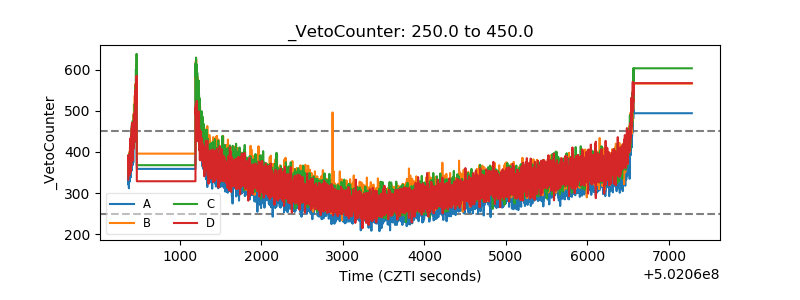 |