| Param | Original file | Final file |
|---|---|---|
| Filename | modeM0/AS1A14_025T01_9000006530_55024cztM0_level2.fits | modeM0/AS1A14_025T01_9000006530_55024cztM0_level2_quad_clean.evt |
| Size (bytes) | 3,024,561,600 | 243,397,440 |
| Size | 2.8 GB | 232.1 MB |
| Events in quadrant A | 34,489,221 | 1,258,746 |
| Events in quadrant B | 11,980,401 | 2,299,298 |
| Events in quadrant C | 12,120,086 | 2,061,505 |
| Events in quadrant D | 51,633,425 | 200,965 |
| Mode M0 | |||
|---|---|---|---|
| Quadrant | BADHDUFLAG | Total packets | Discarded packets |
| A | 0 | 118181 | 108 |
| B | 0 | 52214 | 37 |
| C | 0 | 52400 | 25 |
| D | 0 | 168943 | 93 |
| Mode SS | |||
|---|---|---|---|
| Quadrant | BADHDUFLAG | Total packets | Discarded packets |
| A | 0 | 460 | 0 |
| B | 0 | 460 | 0 |
| C | 0 | 460 | 0 |
| D | 0 | 460 | 0 |
| Mode M9 | |||
|---|---|---|---|
| Quadrant | BADHDUFLAG | Total packets | Discarded packets |
| A | 0 | 50 | 0 |
| B | 0 | 50 | 0 |
| C | 0 | 50 | 0 |
| D | 0 | 50 | 0 |
| Quadrant | Total seconds | Saturated seconds | Saturation percentage |
|---|---|---|---|
| A | 22491 | 9364 | 41.634432% |
| B | 22491 | 776 | 3.450269% |
| C | 22494 | 407 | 1.809371% |
| D | 22492 | 20495 | 91.121288% |
Noise dominated data is calculated using 1-second bins in cleaned event files. If a bin has >2000 counts, and if more than 50% of those come from <1% of pixels, then it is considered to be noise-dominated and hence unusable.
| Quadrant | # 1 sec bins | Bins with >0 counts | Bins with >2000 counts | High rate bins dominated by noise | Noise dominated (total time) | Noise dominated (detector-on time) | Marked lightcurve |
|---|---|---|---|---|---|---|---|
| A | 27427 | 22495 | 8850 | 8850 | 32.27% | 39.34% | 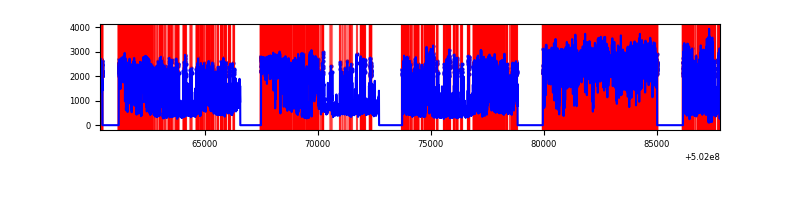 |
| B | 27427 | 22495 | 575 | 575 | 2.10% | 2.56% | 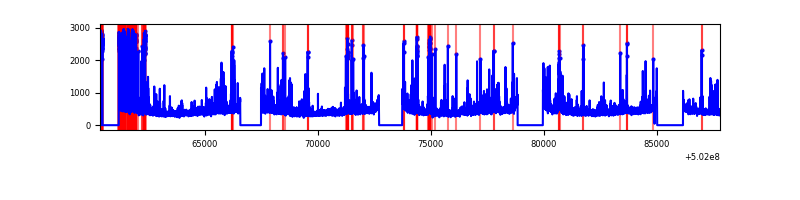 |
| C | 27428 | 22497 | 277 | 277 | 1.01% | 1.23% | 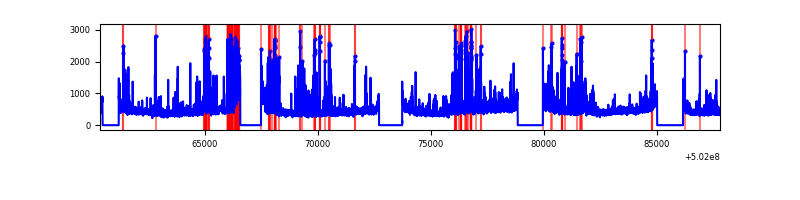 |
| D | 27428 | 22497 | 17326 | 17326 | 63.17% | 77.01% | 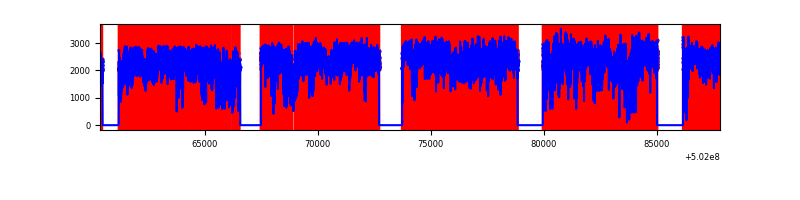 |
Top three noisy pixels from each quadrant. If the there are fewer than three noisy pixels in the level2.evt file, extra rows are filled as -1
| Pixel properties | Quadrant properties | ||||||
|---|---|---|---|---|---|---|---|
| Quadrant | DetID | PixID | Counts | Sigma | Mean | Median | Sigma |
| A | 15 | 32 | 22015673 | 49110.97 | 1812 | 1768 | 448.2 |
| A | 12 | 115 | 2819086 | 6285.17 | 1812 | 1768 | 448.2 |
| A | 0 | 250 | 1741114 | 3880.32 | 1812 | 1768 | 448.2 |
| B | 0 | 183 | 1252925 | 2472.74 | 2357 | 2269 | 505.8 |
| B | 5 | 185 | 423857 | 833.54 | 2357 | 2269 | 505.8 |
| B | 10 | 245 | 351087 | 689.67 | 2357 | 2269 | 505.8 |
| C | 4 | 5 | 1097884 | 1673.12 | 2357 | 2331 | 654.8 |
| C | 1 | 16 | 841087 | 1280.94 | 2357 | 2331 | 654.8 |
| C | 6 | 223 | 372139 | 564.77 | 2357 | 2331 | 654.8 |
| D | 15 | 94 | 38901839 | 168863.62 | 801 | 762 | 230.4 |
| D | 11 | 129 | 6192355 | 26876.76 | 801 | 762 | 230.4 |
| D | 15 | 93 | 1063836 | 4614.64 | 801 | 762 | 230.4 |
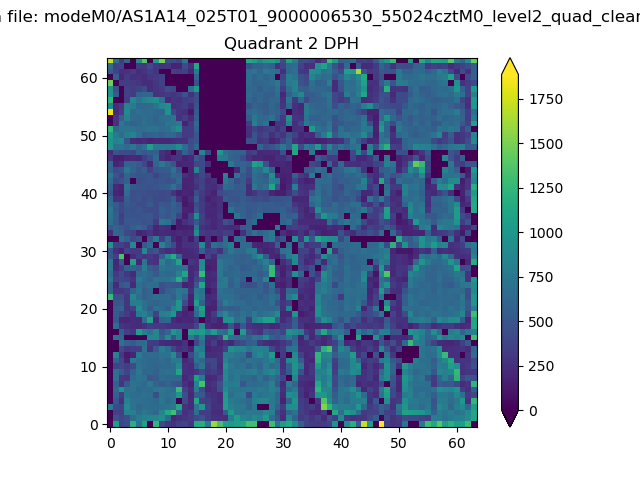
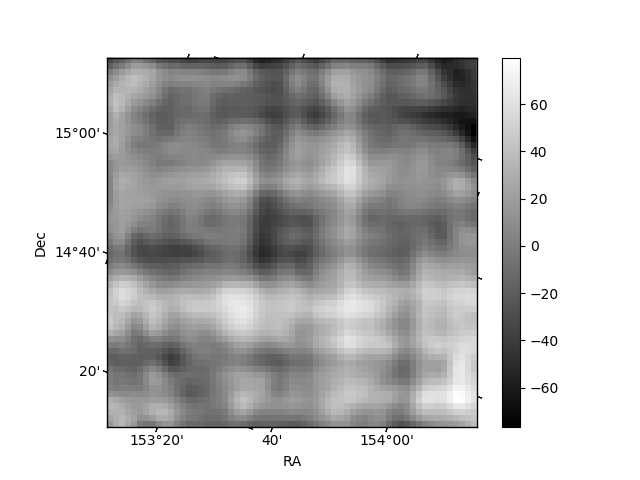
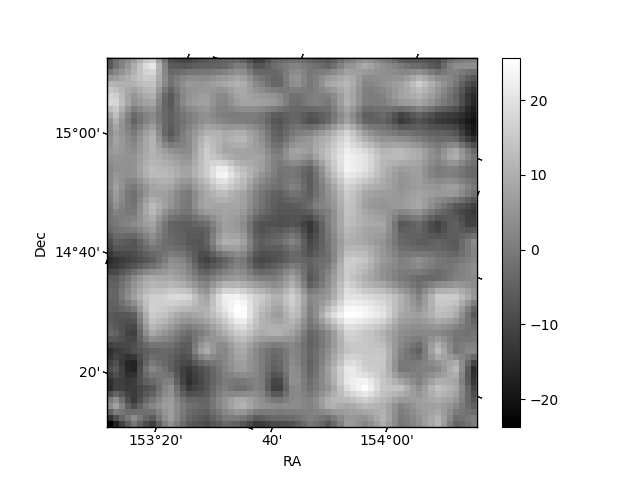
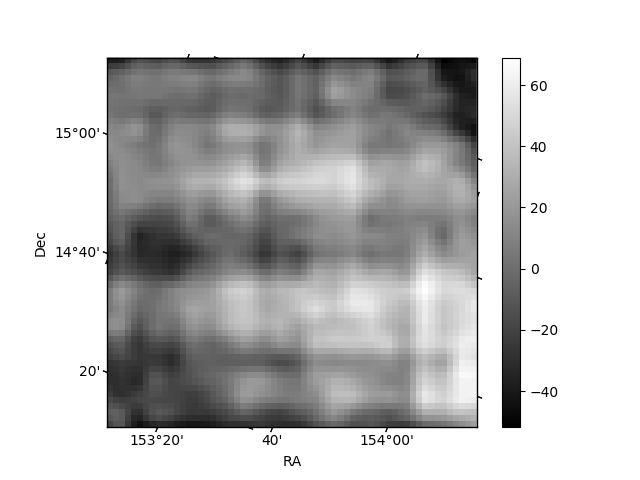
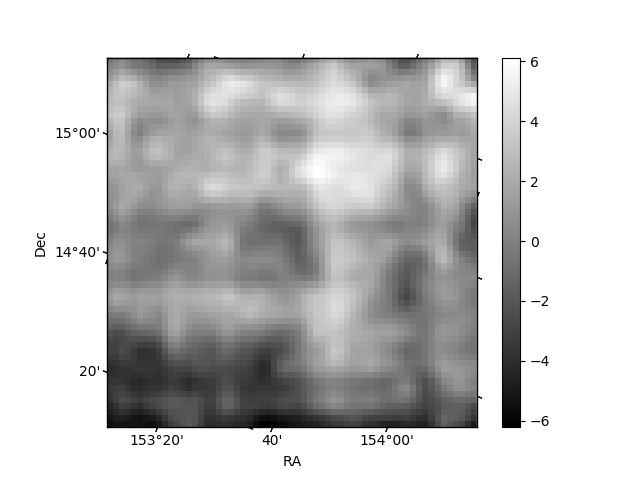
Histogram calculated using DETX and DETY for each event in the final _common_clean file
| Quadrant A | 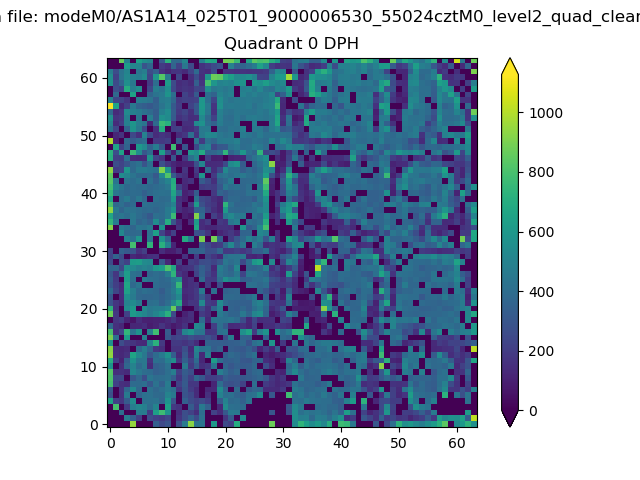 |
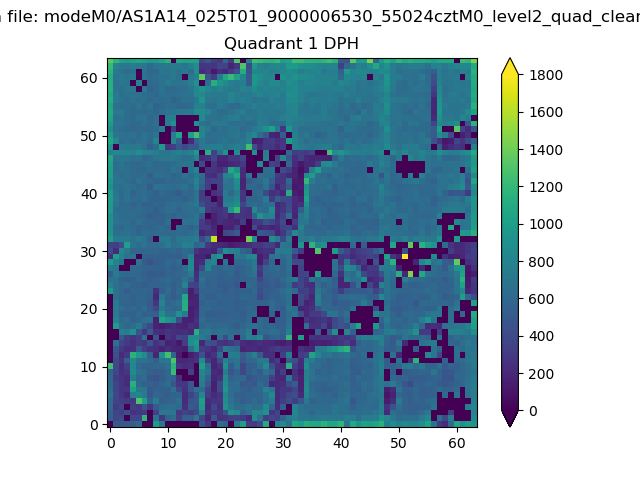 |
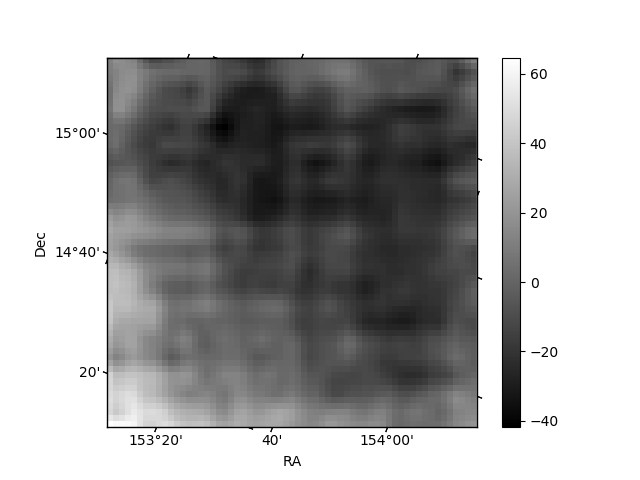
Quadrant B |
|---|---|---|---|
| Quadrant D | 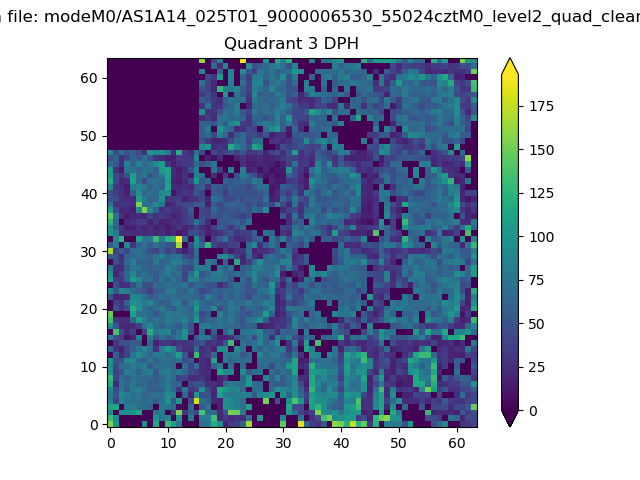 |
 |
Quadrant C |
| Plot type | Count rate plots | Images |
|---|---|---|
| Comparison with Poisson distribution Blue bars denote a histogram of data divided into 1 sec bins. Red curve is a Poisson curve with rate = median count rate of data. |
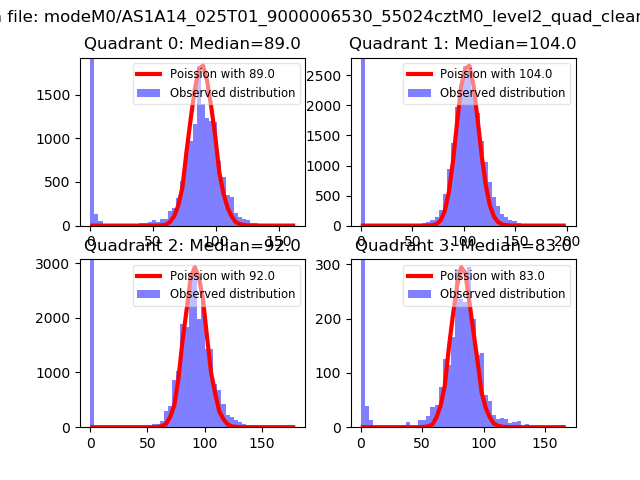 |
 |
| Quadrant-wise count rates Data is divided into 100 sec bins |
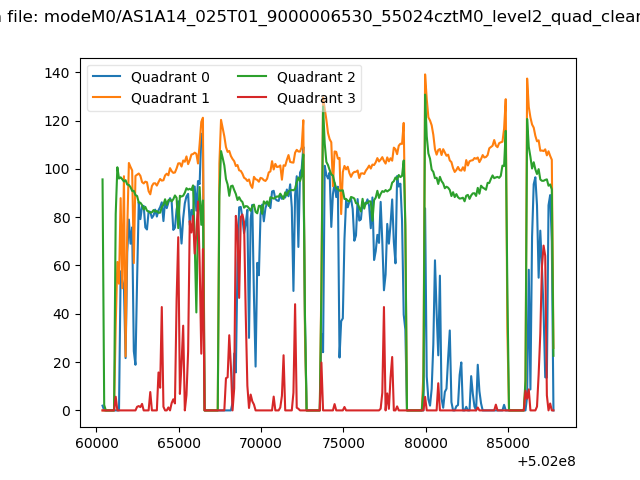 |
|
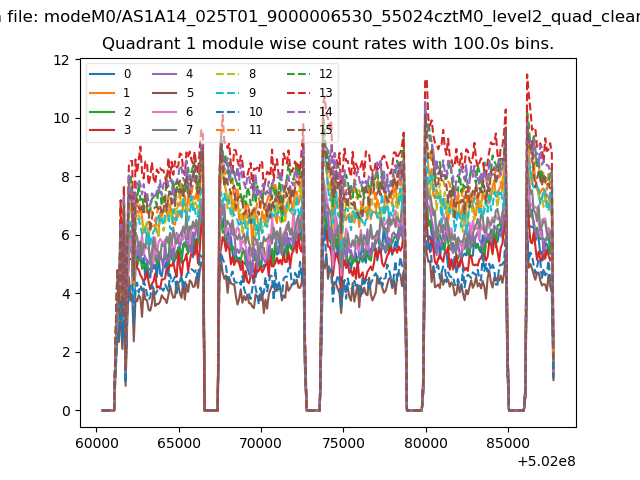
| Module-wise count rates for Quadrant A Data is divided into 100 sec bins |
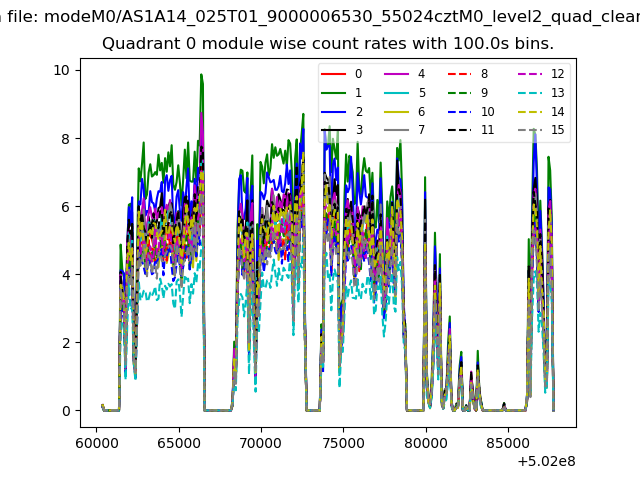 |
 |
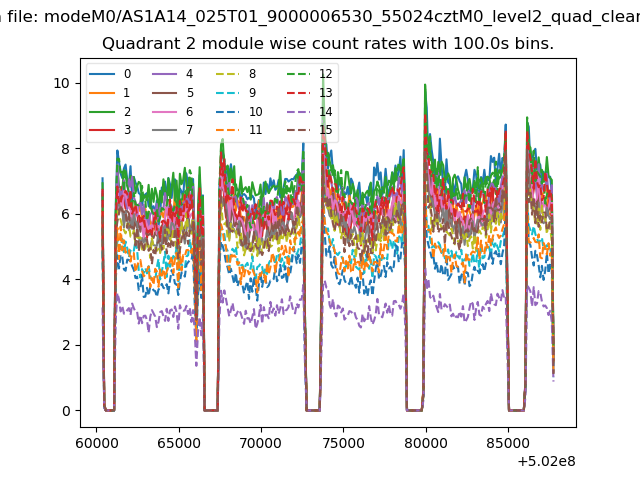
| Module-wise count rates for Quadrant B Data is divided into 100 sec bins |
 |
 |
| Module-wise count rates for Quadrant C Data is divided into 100 sec bins |
 |
 |
| Module-wise count rates for Quadrant D Data is divided into 100 sec bins |
 |
 |
| Parameter | Plot |
|---|---|
| CZT HV Monitor | 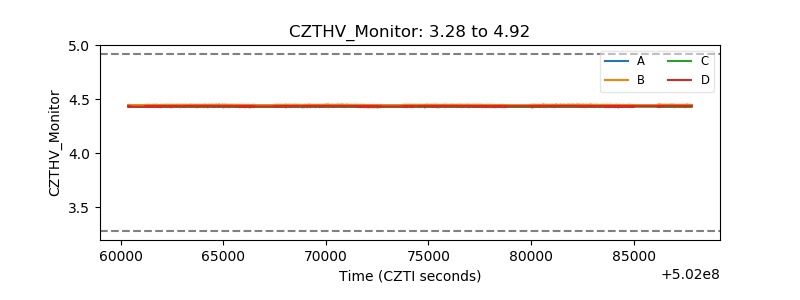 |
| D_VDD | 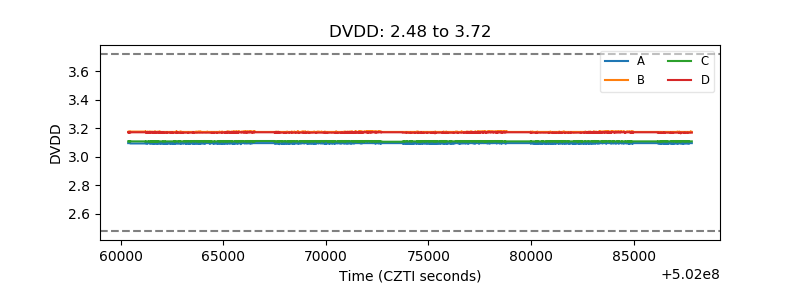 |
| Temperature 1 | 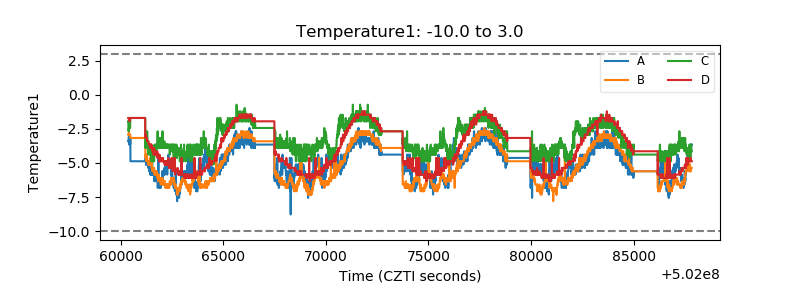 |
| Veto HV Monitor | 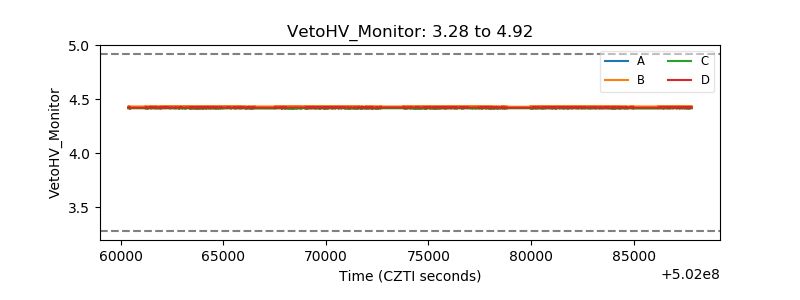 |
| Veto LLD | 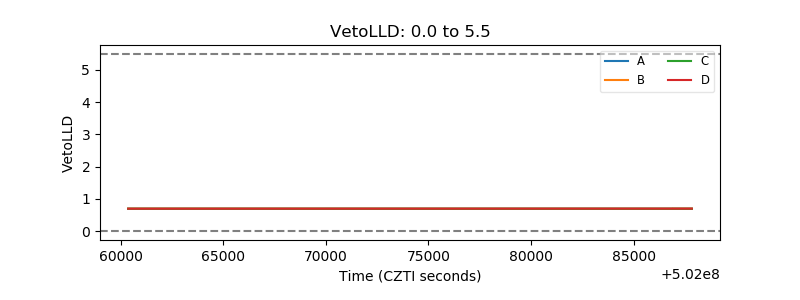 |
| Alpha Counter | 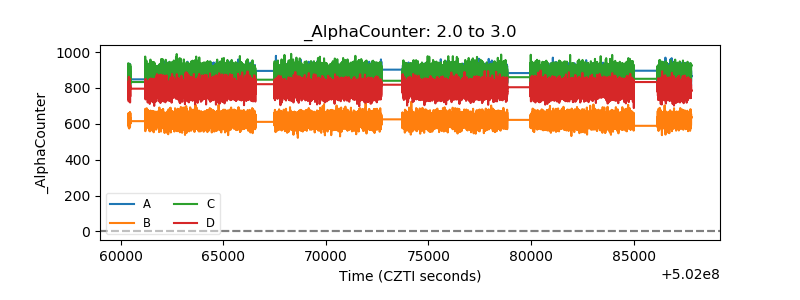 |
| _CPM_Rate | 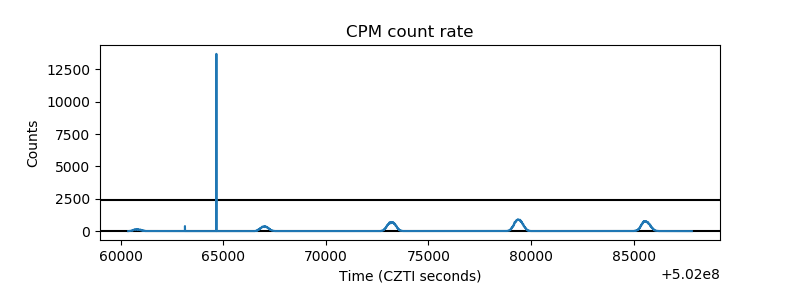 |
| CZT Counter | 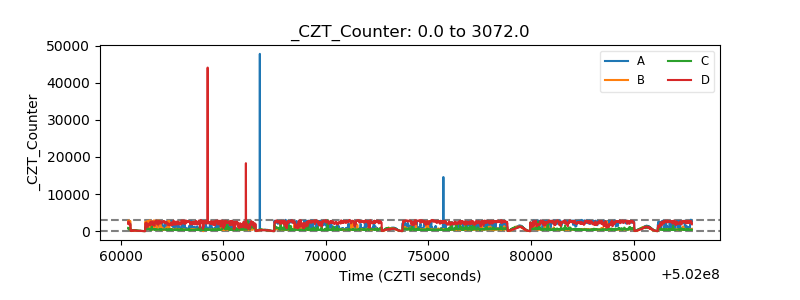 |
| +2.5 Volts monitor |  |
| +5 Volts monitor |  |
| _ROLL_ROT | 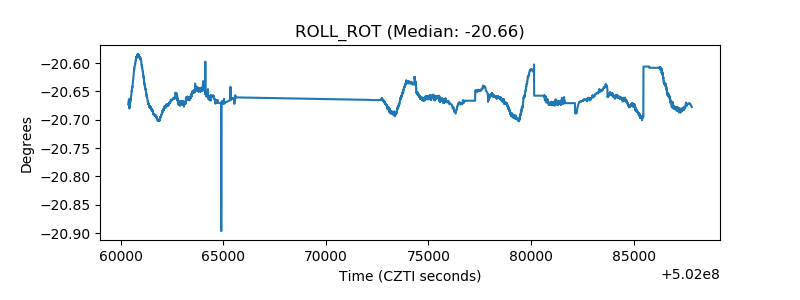 |
| _Roll_DEC | 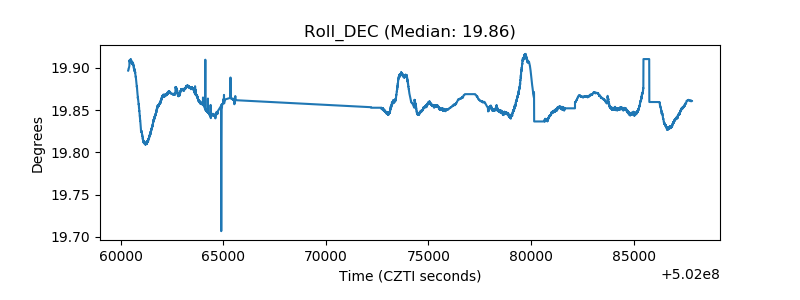 |
| _Roll_RA | 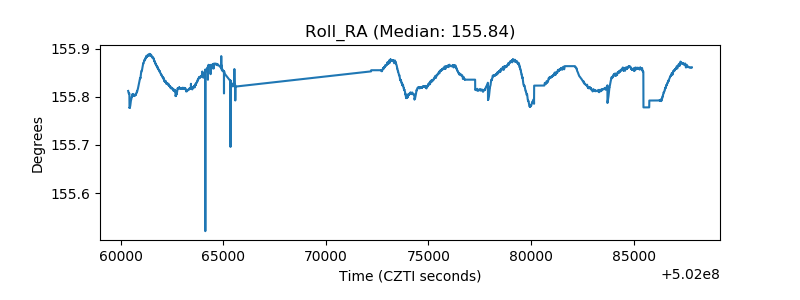 |
| Veto Counter | 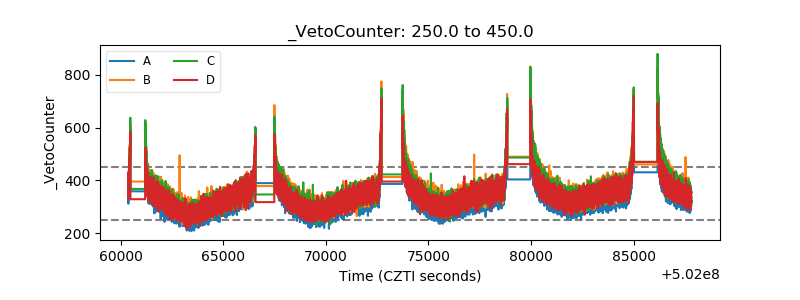 |