| Param | Original file | Final file |
|---|---|---|
| Filename | modeM0/AS1A14_025T01_9000006530_55025cztM0_level2.fits | modeM0/AS1A14_025T01_9000006530_55025cztM0_level2_quad_clean.evt |
| Size (bytes) | 893,727,360 | 69,958,080 |
| Size | 852.3 MB | 66.7 MB |
| Events in quadrant A | 11,578,329 | 301,528 |
| Events in quadrant B | 3,193,132 | 702,783 |
| Events in quadrant C | 3,091,465 | 621,267 |
| Events in quadrant D | 14,711,182 | 35,950 |
| Mode M0 | |||
|---|---|---|---|
| Quadrant | BADHDUFLAG | Total packets | Discarded packets |
| A | 0 | 38881 | 1 |
| B | 0 | 14201 | 1 |
| C | 0 | 14044 | 1 |
| D | 0 | 48201 | 6 |
| Mode SS | |||
|---|---|---|---|
| Quadrant | BADHDUFLAG | Total packets | Discarded packets |
| A | 0 | 132 | 0 |
| B | 0 | 132 | 0 |
| C | 0 | 132 | 0 |
| D | 0 | 132 | 0 |
| Mode M9 | |||
|---|---|---|---|
| Quadrant | BADHDUFLAG | Total packets | Discarded packets |
| A | 0 | 12 | 0 |
| B | 0 | 12 | 0 |
| C | 0 | 12 | 0 |
| D | 0 | 12 | 0 |
| Quadrant | Total seconds | Saturated seconds | Saturation percentage |
|---|---|---|---|
| A | 6550 | 3775 | 57.633588% |
| B | 6550 | 113 | 1.725191% |
| C | 6551 | 75 | 1.144863% |
| D | 6550 | 6234 | 95.175573% |
Noise dominated data is calculated using 1-second bins in cleaned event files. If a bin has >2000 counts, and if more than 50% of those come from <1% of pixels, then it is considered to be noise-dominated and hence unusable.
| Quadrant | # 1 sec bins | Bins with >0 counts | Bins with >2000 counts | High rate bins dominated by noise | Noise dominated (total time) | Noise dominated (detector-on time) | Marked lightcurve |
|---|---|---|---|---|---|---|---|
| A | 7680 | 6551 | 3200 | 3200 | 41.67% | 48.85% | 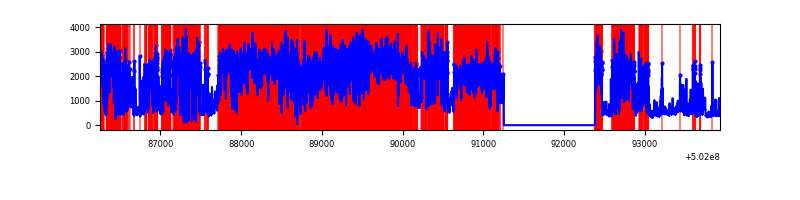 |
| B | 7680 | 6551 | 19 | 19 | 0.25% | 0.29% | 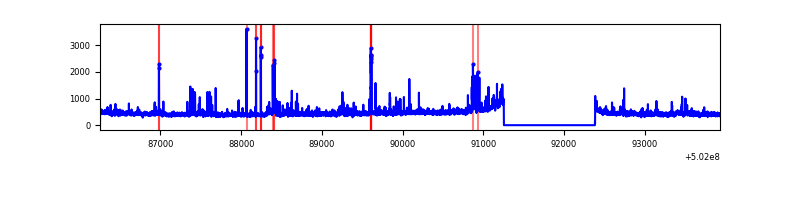 |
| C | 7681 | 6552 | 22 | 22 | 0.29% | 0.34% | 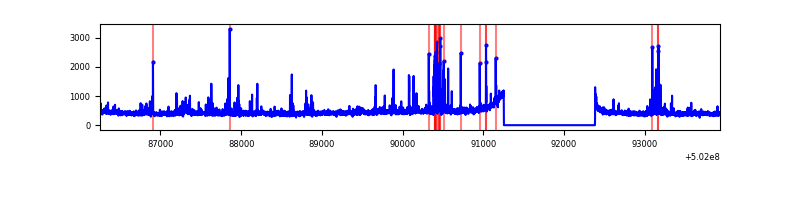 |
| D | 7680 | 6551 | 4780 | 4780 | 62.24% | 72.97% | 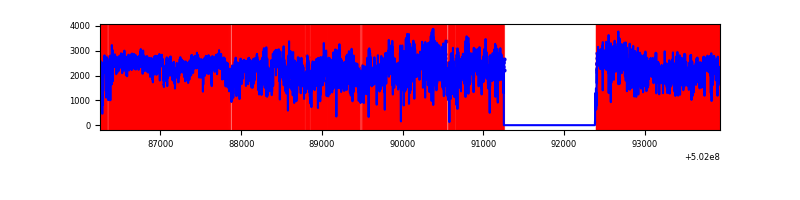 |
Top three noisy pixels from each quadrant. If the there are fewer than three noisy pixels in the level2.evt file, extra rows are filled as -1
| Pixel properties | Quadrant properties | ||||||
|---|---|---|---|---|---|---|---|
| Quadrant | DetID | PixID | Counts | Sigma | Mean | Median | Sigma |
| A | 15 | 32 | 9501715 | 77028.06 | 500 | 488 | 123.3 |
| A | 4 | 78 | 79658 | 641.84 | 500 | 488 | 123.3 |
| A | 3 | 45 | 17260 | 135.97 | 500 | 488 | 123.3 |
| B | 5 | 236 | 149010 | 964.81 | 713 | 686 | 153.7 |
| B | 10 | 245 | 110790 | 716.2 | 713 | 686 | 153.7 |
| B | 5 | 185 | 43018 | 275.36 | 713 | 686 | 153.7 |
| C | 6 | 223 | 126636 | 645.71 | 704 | 695 | 195.0 |
| C | 1 | 16 | 59002 | 298.95 | 704 | 695 | 195.0 |
| C | 14 | 254 | 32969 | 165.47 | 704 | 695 | 195.0 |
| D | 15 | 94 | 11409506 | 166891.95 | 234 | 223 | 68.4 |
| D | 15 | 93 | 1044282 | 15272.22 | 234 | 223 | 68.4 |
| D | 15 | 110 | 830842 | 12150.07 | 234 | 223 | 68.4 |
Histogram calculated using DETX and DETY for each event in the final _common_clean file
| Quadrant A |  |
 |
Quadrant B |
|---|---|---|---|
| Quadrant D |  |
 |
Quadrant C |
| Plot type | Count rate plots | Images |
|---|---|---|
| Comparison with Poisson distribution Blue bars denote a histogram of data divided into 1 sec bins. Red curve is a Poisson curve with rate = median count rate of data. |
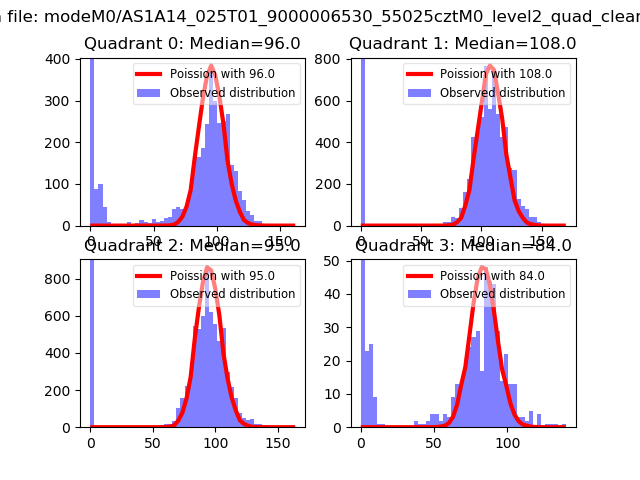 |
 |
| Quadrant-wise count rates Data is divided into 100 sec bins |
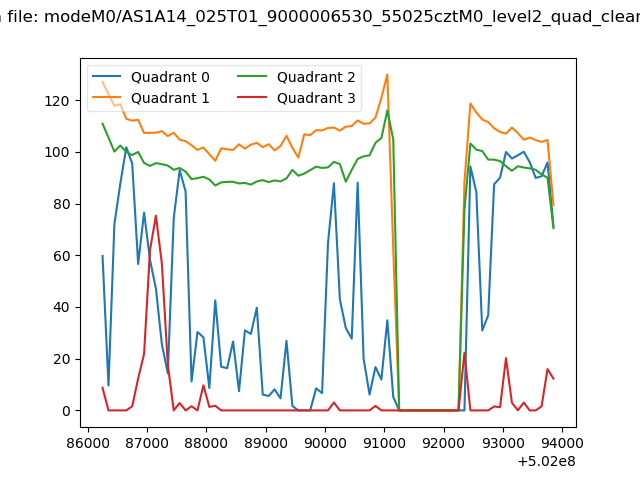 |
|
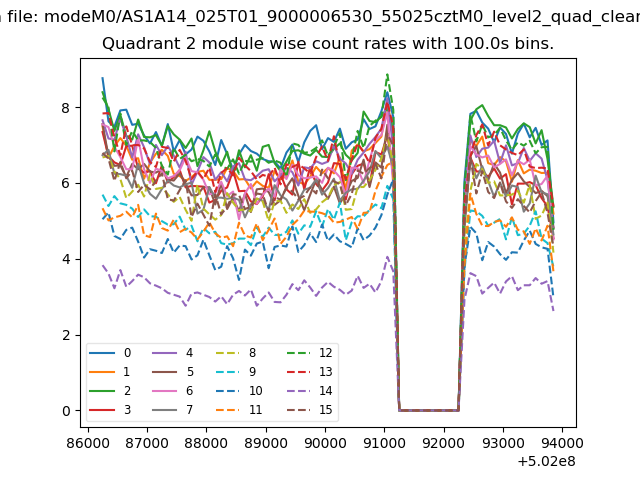
| Module-wise count rates for Quadrant A Data is divided into 100 sec bins |
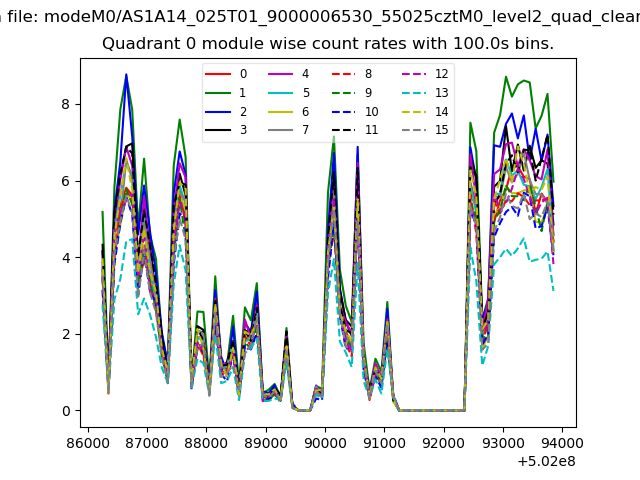 |
 |
| Module-wise count rates for Quadrant B Data is divided into 100 sec bins |
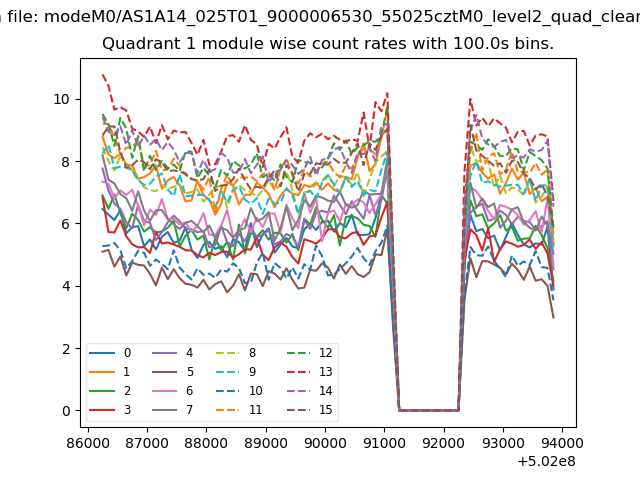 |
 |
| Module-wise count rates for Quadrant C Data is divided into 100 sec bins |
 |
 |
| Module-wise count rates for Quadrant D Data is divided into 100 sec bins |
 |
 |
| Parameter | Plot |
|---|---|
| CZT HV Monitor | 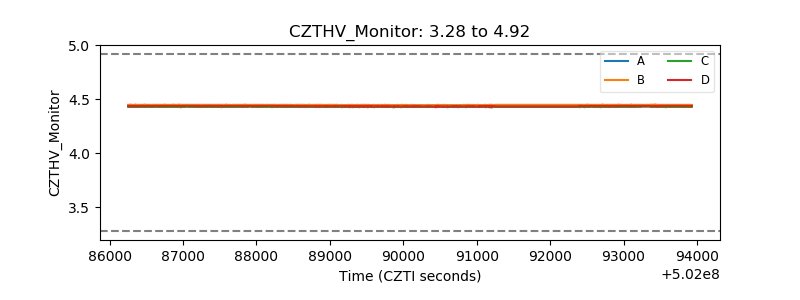 |
| D_VDD |  |
| Temperature 1 |  |
| Veto HV Monitor |  |
| Veto LLD |  |
| Alpha Counter | 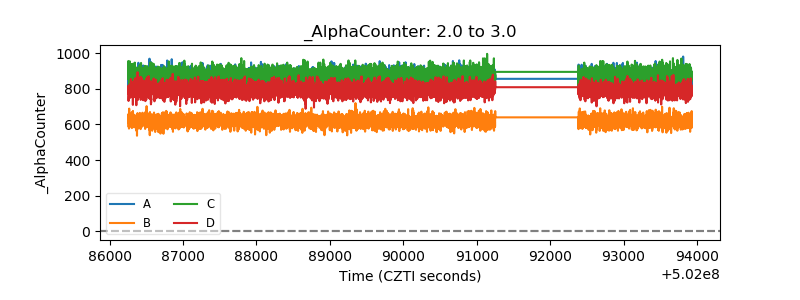 |
| _CPM_Rate | 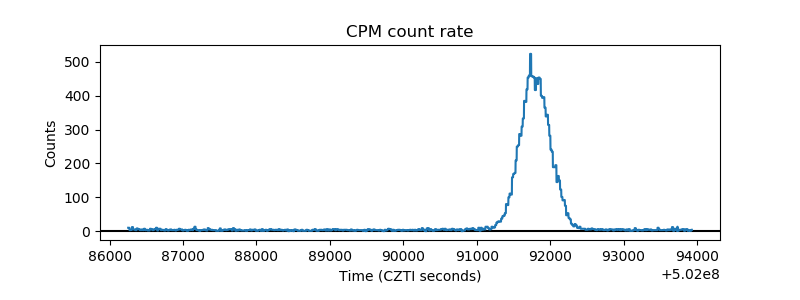 |
| CZT Counter |  |
| +2.5 Volts monitor |  |
| +5 Volts monitor |  |
| _ROLL_ROT |  |
| _Roll_DEC |  |
| _Roll_RA |  |
| Veto Counter |  |