| Param | Original file | Final file |
|---|---|---|
| Filename | modeM0/AS1A14_025T01_9000006530_55026cztM0_level2.fits | modeM0/AS1A14_025T01_9000006530_55026cztM0_level2_quad_clean.evt |
| Size (bytes) | 2,791,477,440 | 254,577,600 |
| Size | 2.6 GB | 242.8 MB |
| Events in quadrant A | 27,066,745 | 1,585,220 |
| Events in quadrant B | 13,128,526 | 2,226,583 |
| Events in quadrant C | 12,149,949 | 2,047,964 |
| Events in quadrant D | 49,234,064 | 287,049 |
| Mode M0 | |||
|---|---|---|---|
| Quadrant | BADHDUFLAG | Total packets | Discarded packets |
| A | 0 | 103605 | 7248 |
| B | 0 | 59490 | 3445 |
| C | 0 | 56357 | 3335 |
| D | 0 | 178641 | 17159 |
| Mode SS | |||
|---|---|---|---|
| Quadrant | BADHDUFLAG | Total packets | Discarded packets |
| A | 0 | 491 | 29 |
| B | 0 | 490 | 26 |
| C | 0 | 491 | 29 |
| D | 0 | 493 | 29 |
| Mode M9 | |||
|---|---|---|---|
| Quadrant | BADHDUFLAG | Total packets | Discarded packets |
| A | 0 | 48 | 0 |
| B | 0 | 48 | 0 |
| C | 0 | 48 | 0 |
| D | 0 | 48 | 0 |
| Quadrant | Total seconds | Saturated seconds | Saturation percentage |
|---|---|---|---|
| A | 22671 | 5831 | 25.720083% |
| B | 22905 | 1312 | 5.728007% |
| C | 22937 | 452 | 1.970615% |
| D | 22159 | 19078 | 86.095943% |
Noise dominated data is calculated using 1-second bins in cleaned event files. If a bin has >2000 counts, and if more than 50% of those come from <1% of pixels, then it is considered to be noise-dominated and hence unusable.
| Quadrant | # 1 sec bins | Bins with >0 counts | Bins with >2000 counts | High rate bins dominated by noise | Noise dominated (total time) | Noise dominated (detector-on time) | Marked lightcurve |
|---|---|---|---|---|---|---|---|
| A | 43500 | 23197 | 5291 | 5291 | 12.16% | 22.81% | 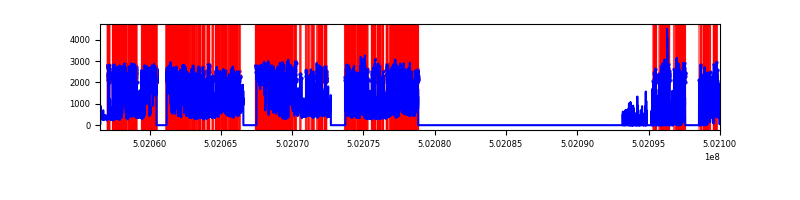 |
| B | 43500 | 23363 | 1056 | 1056 | 2.43% | 4.52% | 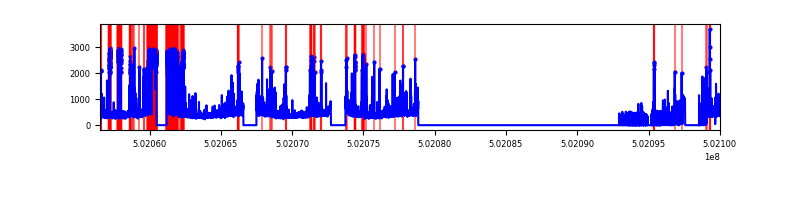 |
| C | 43500 | 23408 | 304 | 304 | 0.70% | 1.30% | 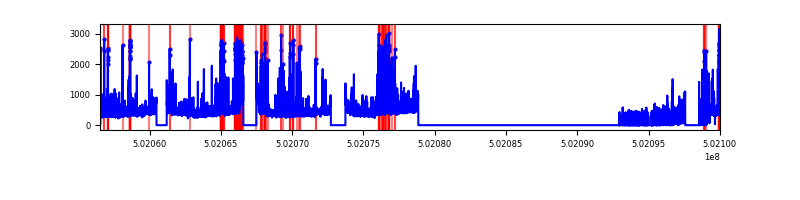 |
| D | 43500 | 22526 | 15836 | 15836 | 36.40% | 70.30% | 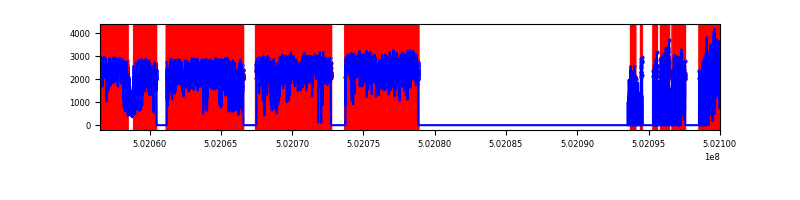 |
Top three noisy pixels from each quadrant. If the there are fewer than three noisy pixels in the level2.evt file, extra rows are filled as -1
| Pixel properties | Quadrant properties | ||||||
|---|---|---|---|---|---|---|---|
| Quadrant | DetID | PixID | Counts | Sigma | Mean | Median | Sigma |
| A | 15 | 32 | 13329293 | 25793.43 | 2087 | 2037 | 516.7 |
| A | 12 | 115 | 2819501 | 5452.89 | 2087 | 2037 | 516.7 |
| A | 0 | 250 | 1741895 | 3367.3 | 2087 | 2037 | 516.7 |
| B | 0 | 183 | 2490718 | 4965.71 | 2343 | 2258 | 501.1 |
| B | 10 | 245 | 398226 | 790.15 | 2343 | 2258 | 501.1 |
| B | 5 | 185 | 285331 | 564.87 | 2343 | 2258 | 501.1 |
| C | 4 | 5 | 1219631 | 1862.62 | 2385 | 2361 | 653.5 |
| C | 1 | 16 | 552865 | 842.36 | 2385 | 2361 | 653.5 |
| C | 6 | 223 | 380497 | 578.61 | 2385 | 2361 | 653.5 |
| D | 15 | 94 | 38203136 | 157740.18 | 842 | 801 | 242.2 |
| D | 11 | 129 | 5995191 | 24751.27 | 842 | 801 | 242.2 |
| D | 10 | 181 | 654742 | 2700.17 | 842 | 801 | 242.2 |
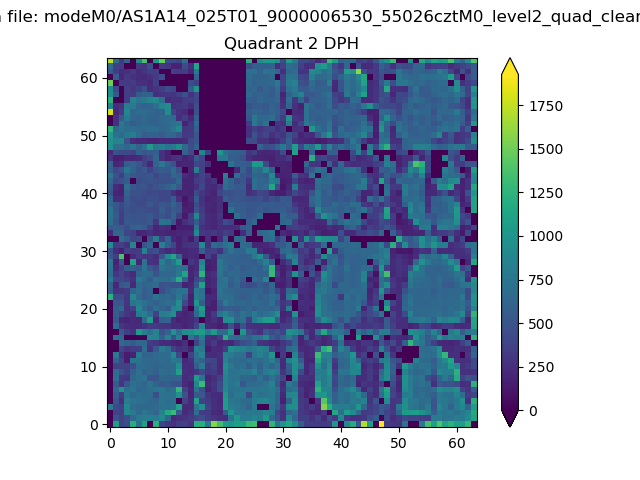
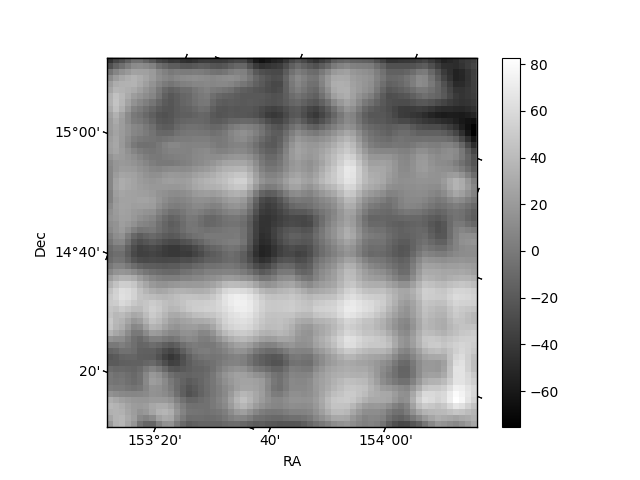
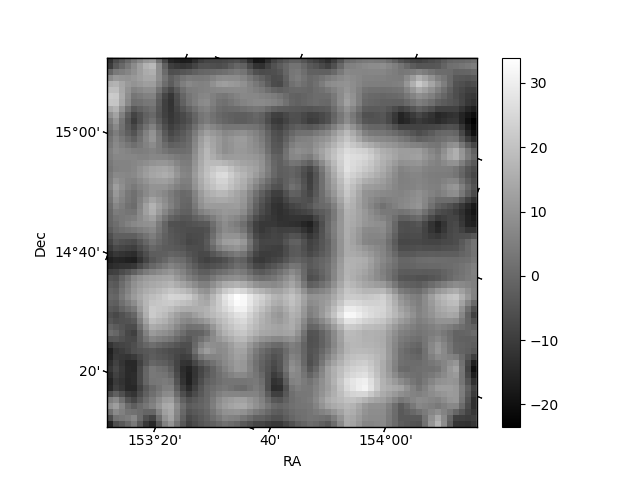
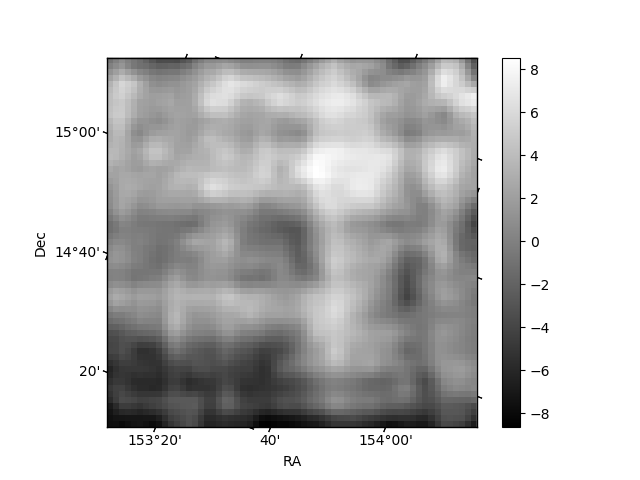
Histogram calculated using DETX and DETY for each event in the final _common_clean file
| Quadrant A | 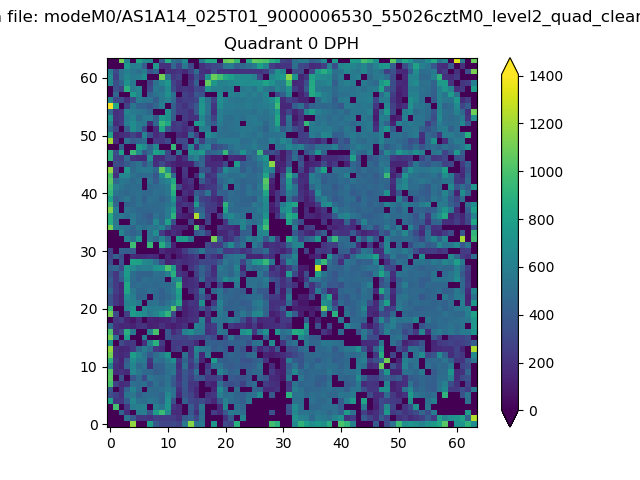 |
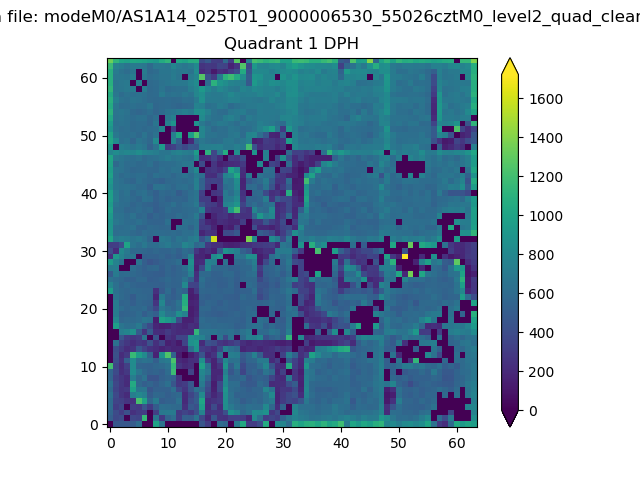 |
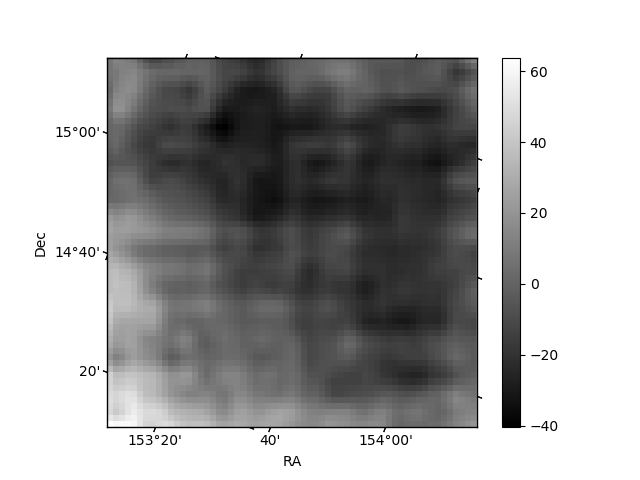
Quadrant B |
|---|---|---|---|
| Quadrant D | 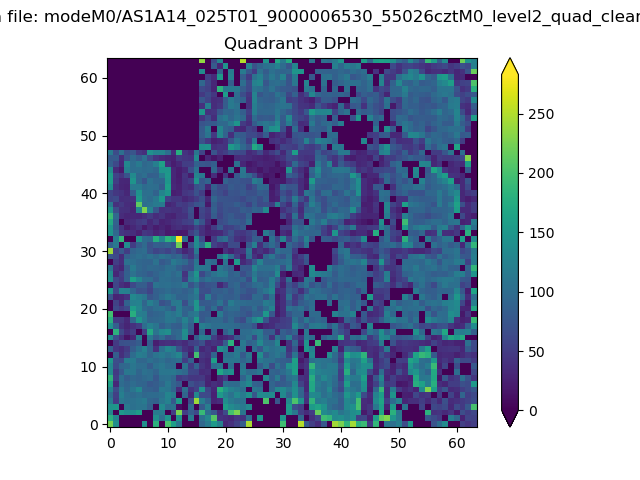 |
 |
Quadrant C |
| Plot type | Count rate plots | Images |
|---|---|---|
| Comparison with Poisson distribution Blue bars denote a histogram of data divided into 1 sec bins. Red curve is a Poisson curve with rate = median count rate of data. |
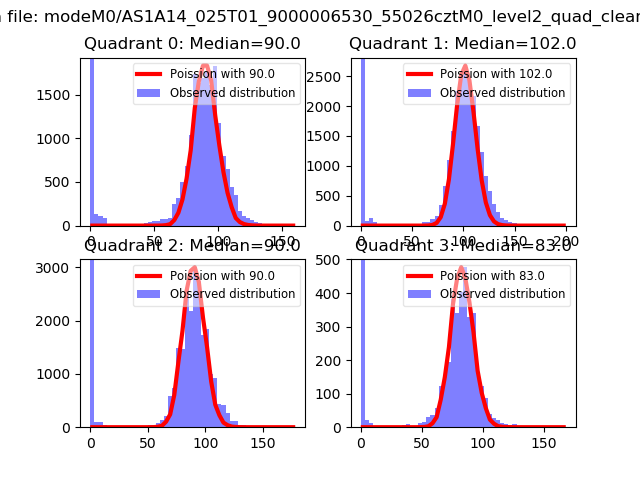 |
 |
| Quadrant-wise count rates Data is divided into 100 sec bins |
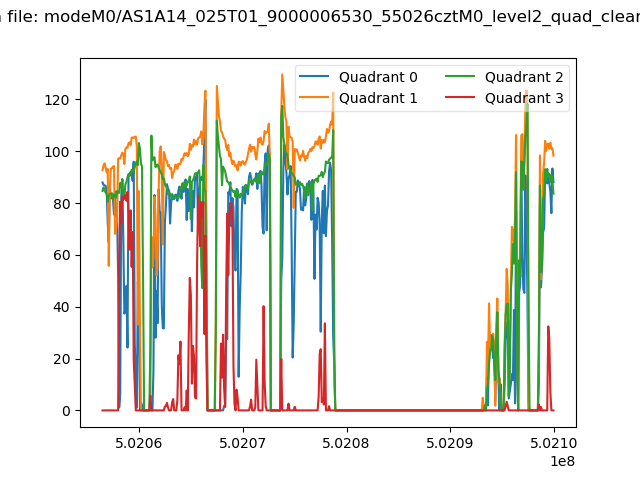 |
|
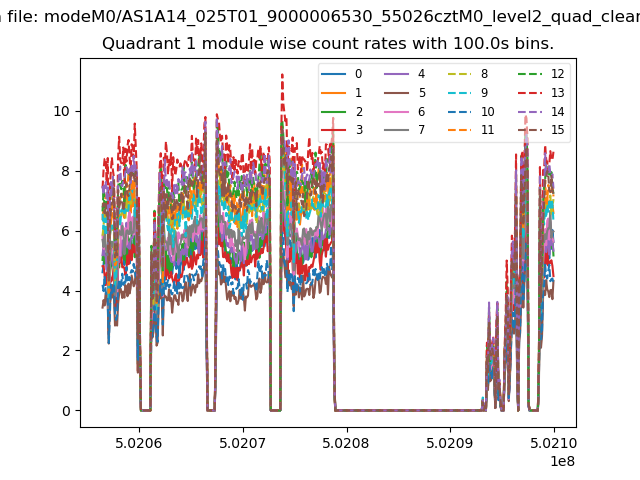
| Module-wise count rates for Quadrant A Data is divided into 100 sec bins |
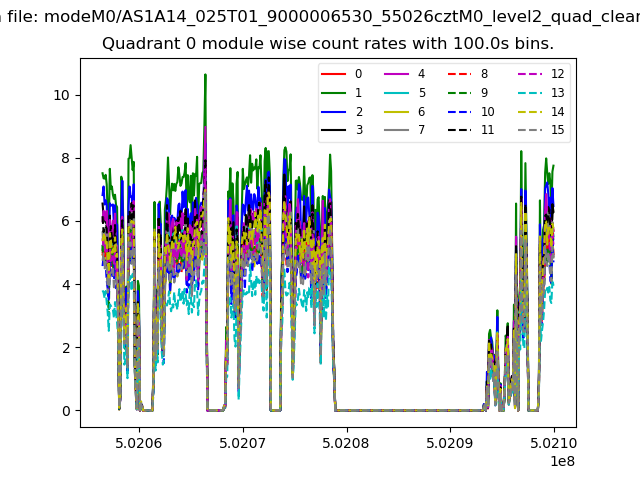 |
 |
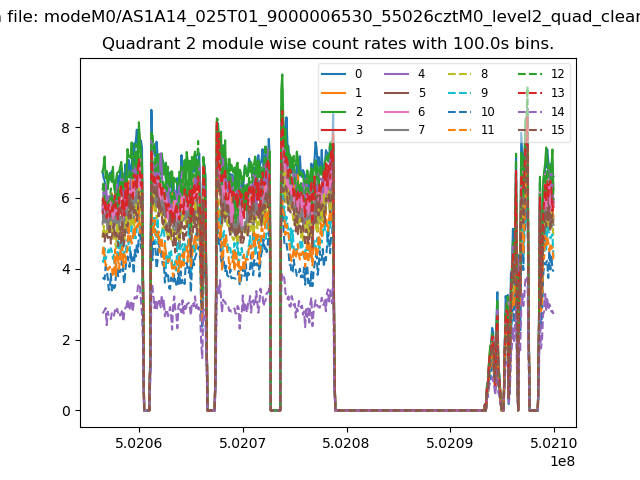
| Module-wise count rates for Quadrant B Data is divided into 100 sec bins |
 |
 |
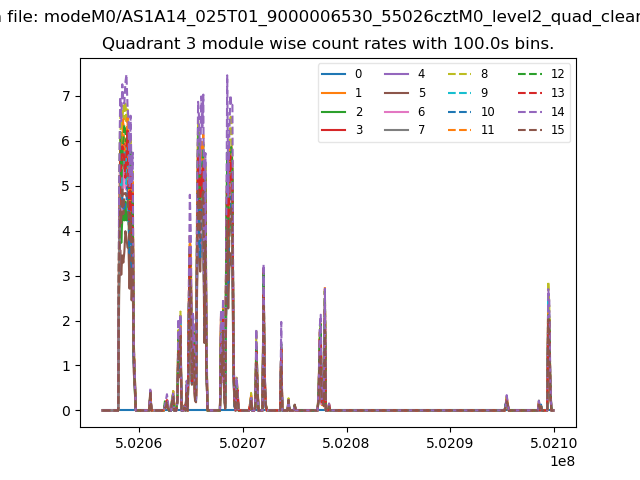
| Module-wise count rates for Quadrant C Data is divided into 100 sec bins |
 |
 |
| Module-wise count rates for Quadrant D Data is divided into 100 sec bins |
 |
 |
| Parameter | Plot |
|---|---|
| CZT HV Monitor | 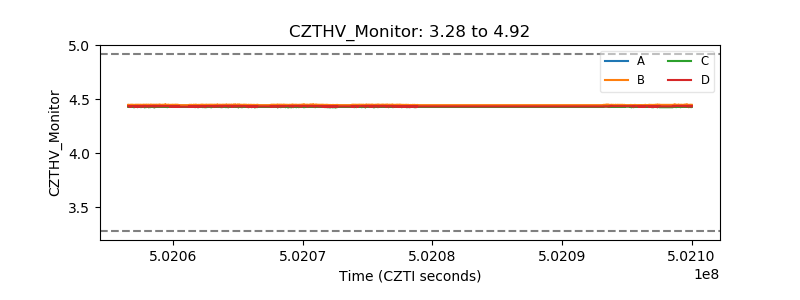 |
| D_VDD | 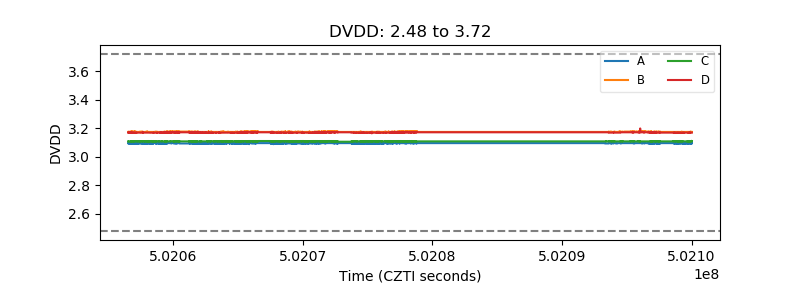 |
| Temperature 1 | 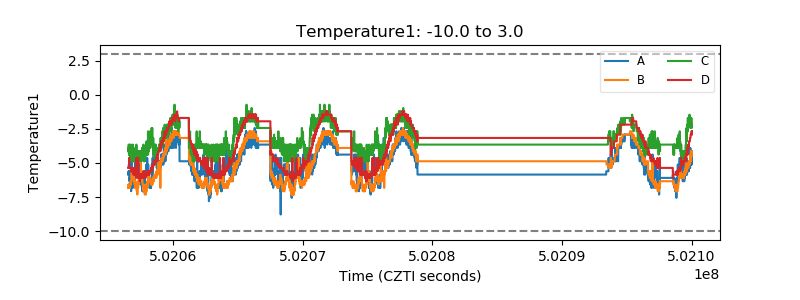 |
| Veto HV Monitor | 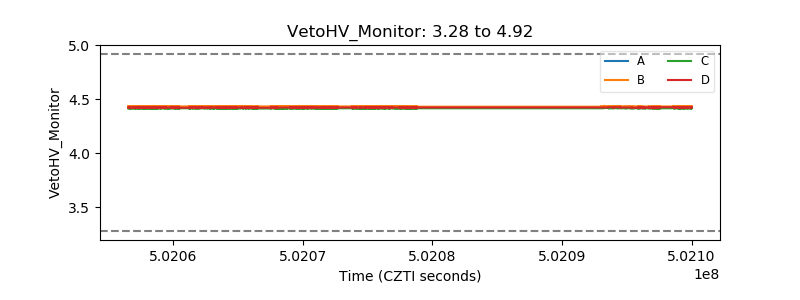 |
| Veto LLD | 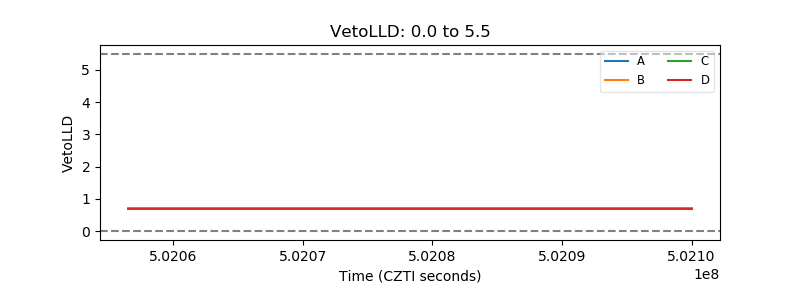 |
| Alpha Counter | 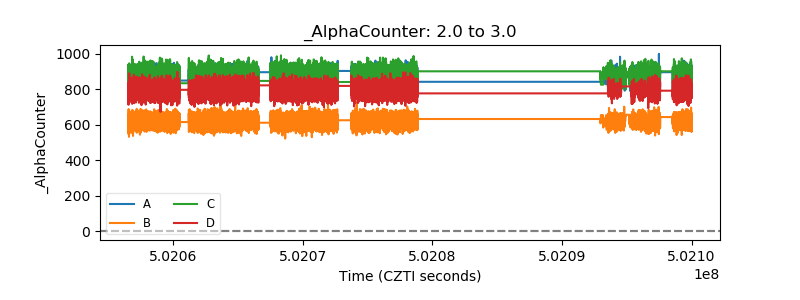 |
| _CPM_Rate | 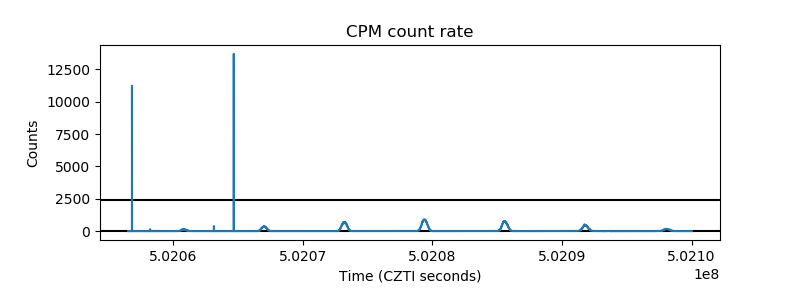 |
| CZT Counter | 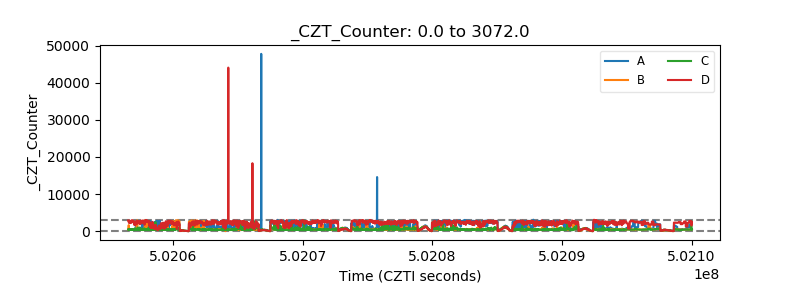 |
| +2.5 Volts monitor |  |
| +5 Volts monitor |  |
| _ROLL_ROT | 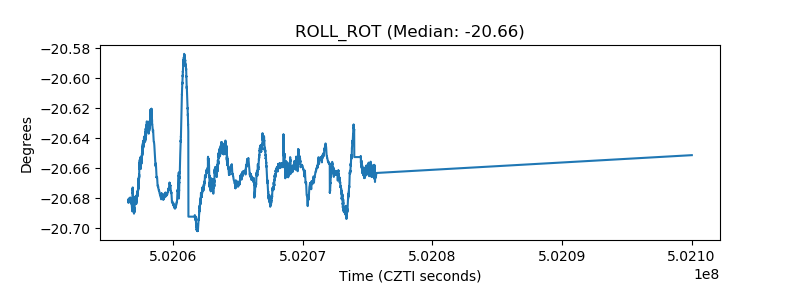 |
| _Roll_DEC | 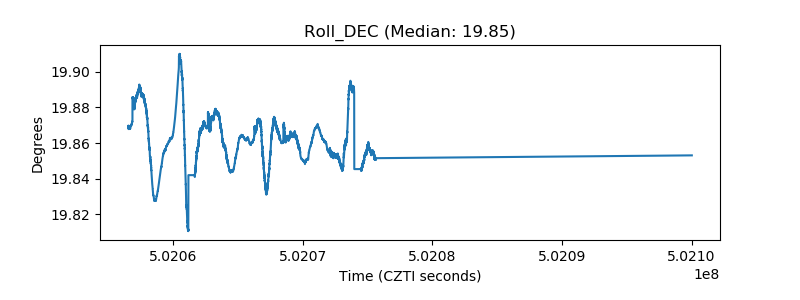 |
| _Roll_RA | 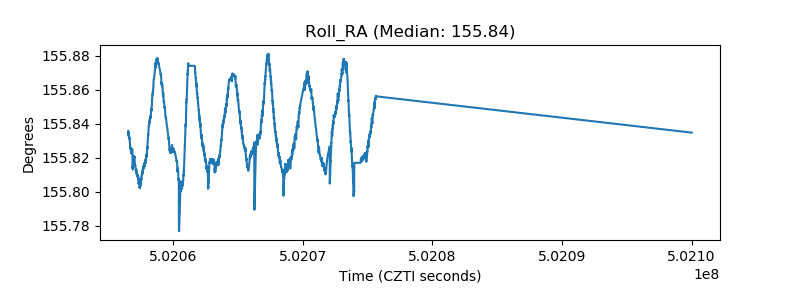 |
| Veto Counter | 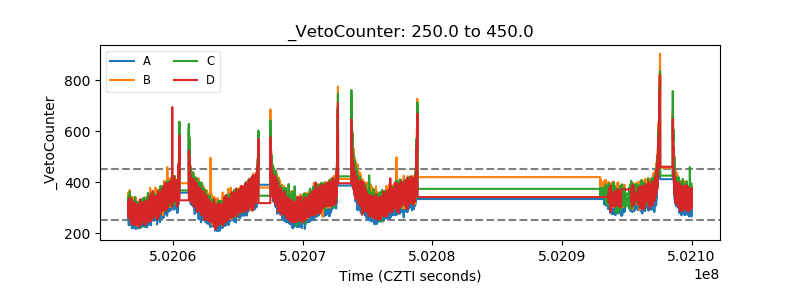 |