| Param | Original file | Final file |
|---|---|---|
| Filename | modeM0/AS1A14_025T01_9000006530_55027cztM0_level2.fits | modeM0/AS1A14_025T01_9000006530_55027cztM0_level2_quad_clean.evt |
| Size (bytes) | 1,790,953,920 | 168,583,680 |
| Size | 1.7 GB | 160.8 MB |
| Events in quadrant A | 17,279,287 | 1,098,012 |
| Events in quadrant B | 7,697,168 | 1,487,223 |
| Events in quadrant C | 7,996,753 | 1,333,005 |
| Events in quadrant D | 32,175,678 | 162,381 |
| Mode M0 | |||
|---|---|---|---|
| Quadrant | BADHDUFLAG | Total packets | Discarded packets |
| A | 0 | 68555 | 6980 |
| B | 0 | 38603 | 4629 |
| C | 0 | 39261 | 4238 |
| D | 0 | 125306 | 19862 |
| Mode SS | |||
|---|---|---|---|
| Quadrant | BADHDUFLAG | Total packets | Discarded packets |
| A | 0 | 341 | 39 |
| B | 0 | 344 | 38 |
| C | 0 | 344 | 40 |
| D | 0 | 344 | 36 |
| Mode M9 | |||
|---|---|---|---|
| Quadrant | BADHDUFLAG | Total packets | Discarded packets |
| A | 0 | 27 | 0 |
| B | 0 | 27 | 0 |
| C | 0 | 27 | 0 |
| D | 0 | 27 | 0 |
| Quadrant | Total seconds | Saturated seconds | Saturation percentage |
|---|---|---|---|
| A | 14821 | 3335 | 22.501855% |
| B | 15013 | 458 | 3.050689% |
| C | 15045 | 358 | 2.379528% |
| D | 14362 | 12700 | 88.427796% |
Noise dominated data is calculated using 1-second bins in cleaned event files. If a bin has >2000 counts, and if more than 50% of those come from <1% of pixels, then it is considered to be noise-dominated and hence unusable.
| Quadrant | # 1 sec bins | Bins with >0 counts | Bins with >2000 counts | High rate bins dominated by noise | Noise dominated (total time) | Noise dominated (detector-on time) | Marked lightcurve |
|---|---|---|---|---|---|---|---|
| A | 44655 | 15306 | 3032 | 3032 | 6.79% | 19.81% | 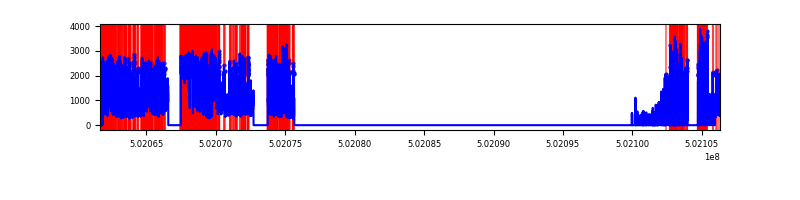 |
| B | 44654 | 15438 | 265 | 265 | 0.59% | 1.72% | 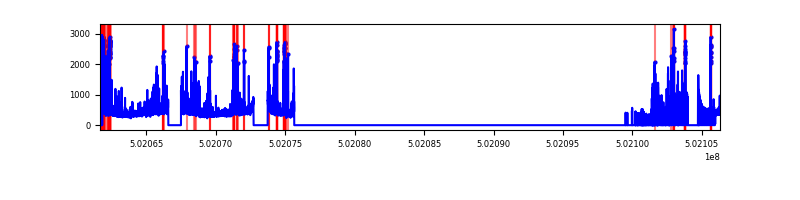 |
| C | 44655 | 15461 | 236 | 236 | 0.53% | 1.53% | 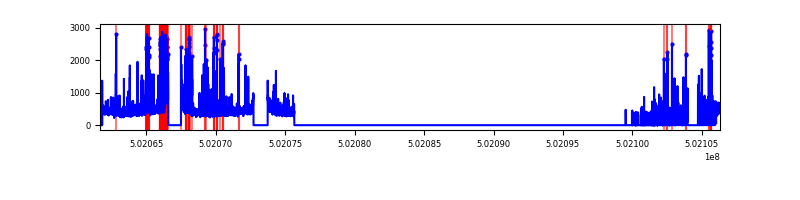 |
| D | 44627 | 14714 | 10259 | 10259 | 22.99% | 69.72% | 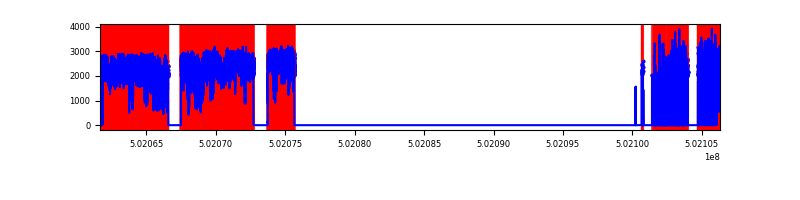 |
Top three noisy pixels from each quadrant. If the there are fewer than three noisy pixels in the level2.evt file, extra rows are filled as -1
| Pixel properties | Quadrant properties | ||||||
|---|---|---|---|---|---|---|---|
| Quadrant | DetID | PixID | Counts | Sigma | Mean | Median | Sigma |
| A | 15 | 32 | 6537938 | 18627.0 | 1408 | 1372 | 350.9 |
| A | 12 | 115 | 2737568 | 7797.23 | 1408 | 1372 | 350.9 |
| A | 0 | 250 | 1739459 | 4952.96 | 1408 | 1372 | 350.9 |
| B | 0 | 183 | 422747 | 1252.69 | 1571 | 1515 | 336.3 |
| B | 10 | 245 | 292173 | 864.38 | 1571 | 1515 | 336.3 |
| B | 5 | 185 | 250741 | 741.16 | 1571 | 1515 | 336.3 |
| C | 4 | 5 | 1087110 | 2524.27 | 1557 | 1541 | 430.1 |
| C | 1 | 16 | 246890 | 570.51 | 1557 | 1541 | 430.1 |
| C | 13 | 3 | 230022 | 531.29 | 1557 | 1541 | 430.1 |
| D | 15 | 94 | 23332889 | 146260.73 | 546 | 518 | 159.5 |
| D | 11 | 129 | 5301217 | 33227.83 | 546 | 518 | 159.5 |
| D | 10 | 181 | 408600 | 2558.09 | 546 | 518 | 159.5 |
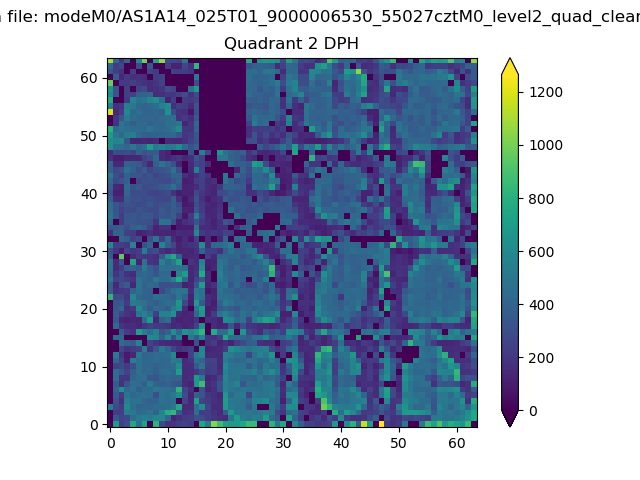
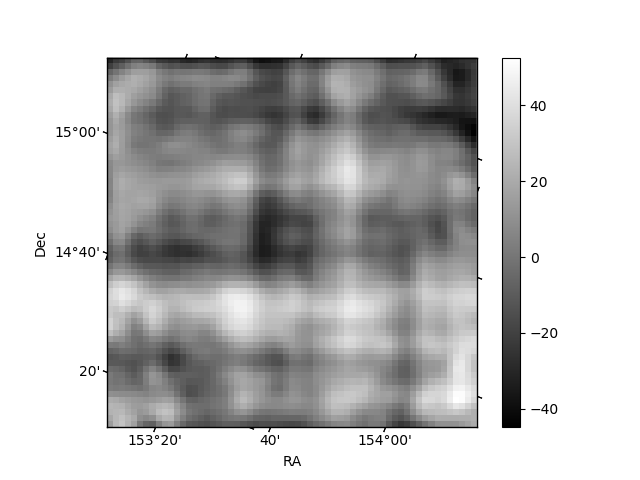
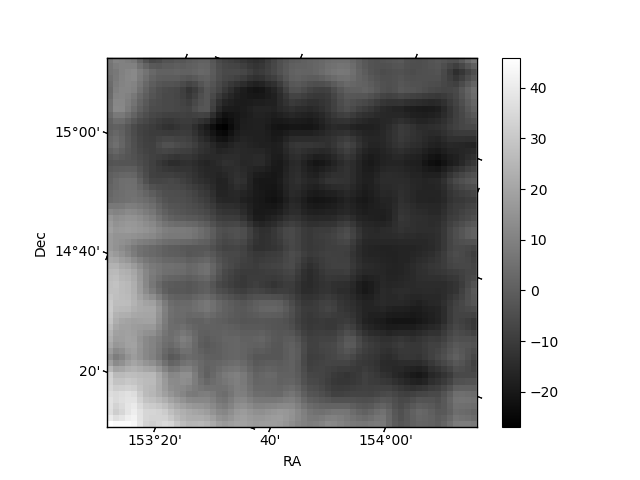
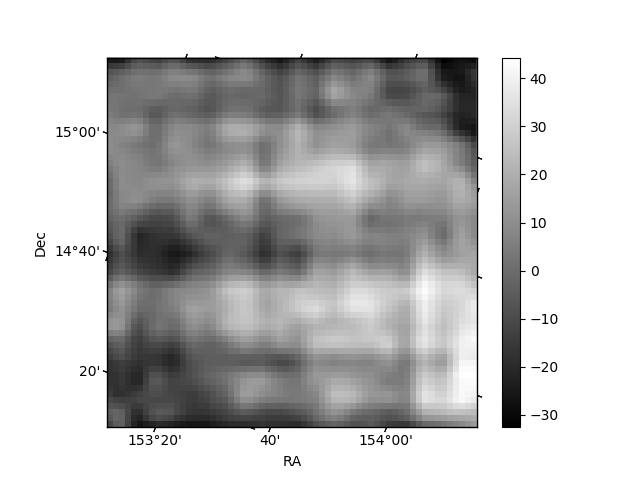
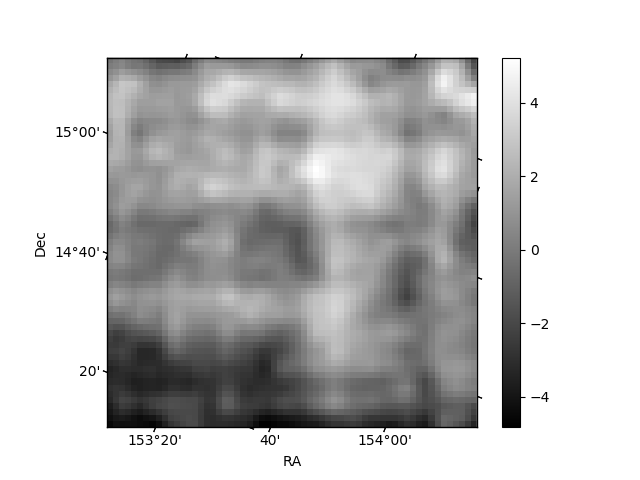
Histogram calculated using DETX and DETY for each event in the final _common_clean file
| Quadrant A | 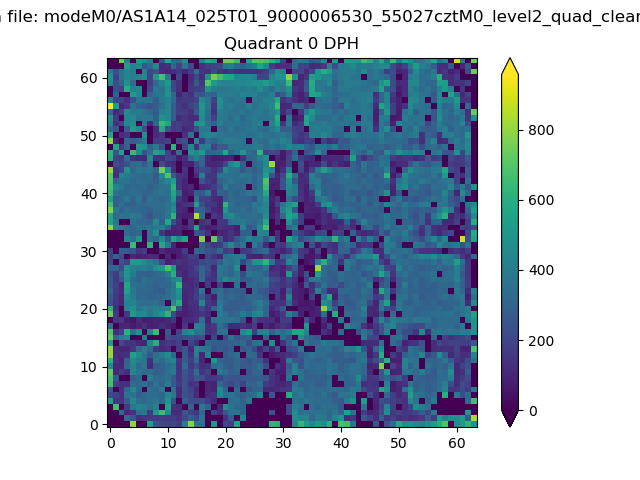 |
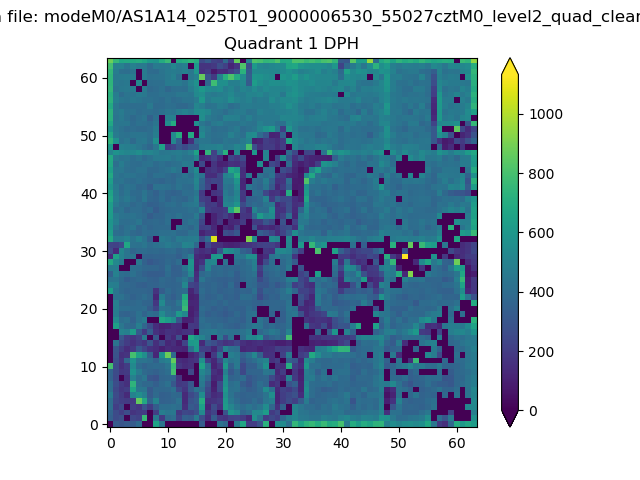 |
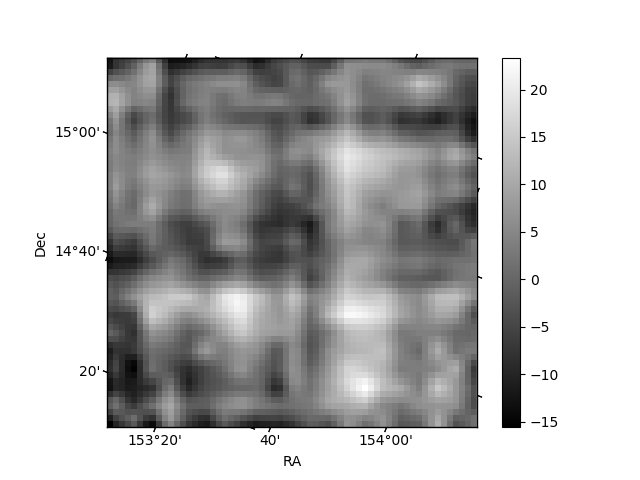
Quadrant B |
|---|---|---|---|
| Quadrant D | 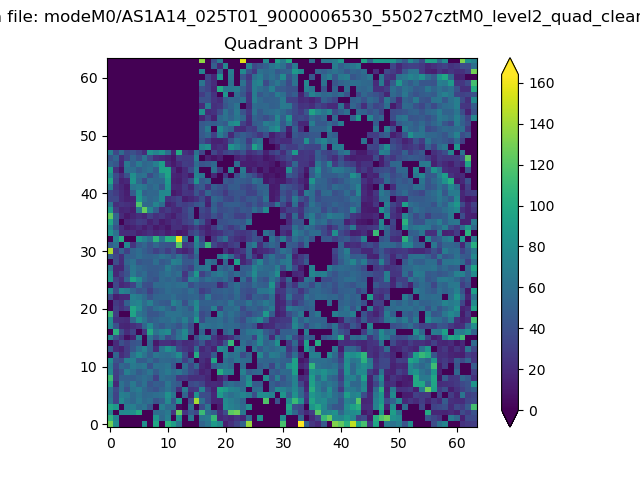 |
 |
Quadrant C |
| Plot type | Count rate plots | Images |
|---|---|---|
| Comparison with Poisson distribution Blue bars denote a histogram of data divided into 1 sec bins. Red curve is a Poisson curve with rate = median count rate of data. |
 |
 |
| Quadrant-wise count rates Data is divided into 100 sec bins |
 |
|
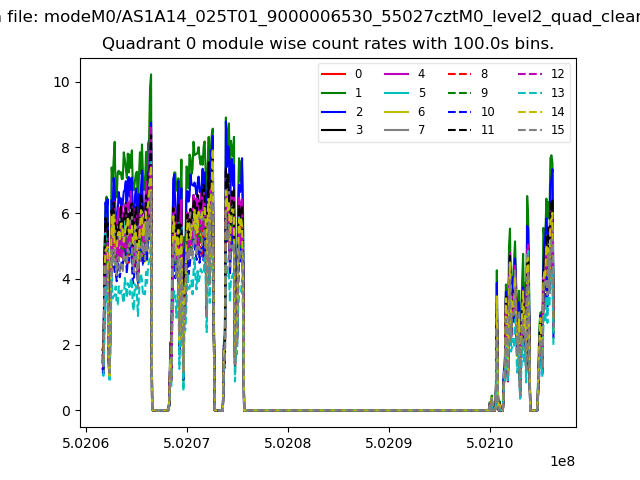
| Module-wise count rates for Quadrant A Data is divided into 100 sec bins |
 |
 |
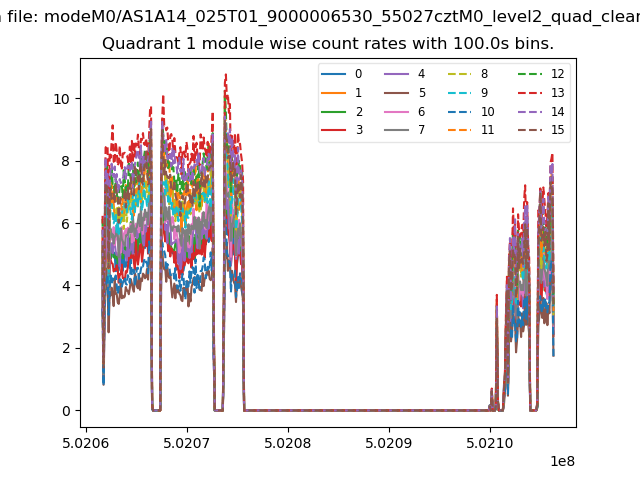
| Module-wise count rates for Quadrant B Data is divided into 100 sec bins |
 |
 |
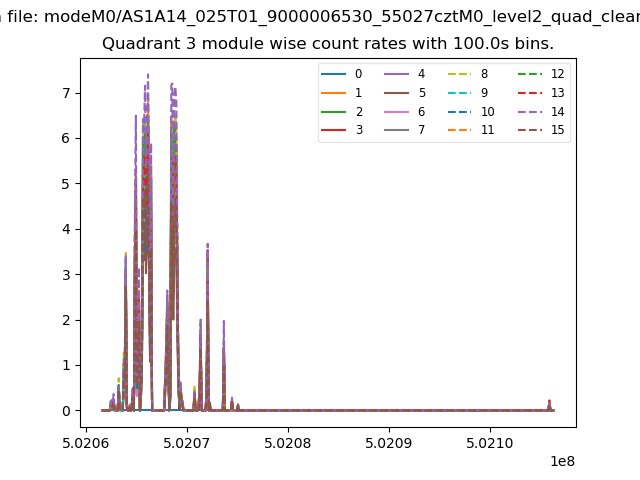
| Module-wise count rates for Quadrant C Data is divided into 100 sec bins |
 |
 |
| Module-wise count rates for Quadrant D Data is divided into 100 sec bins |
 |
 |
| Parameter | Plot |
|---|---|
| CZT HV Monitor |  |
| D_VDD | 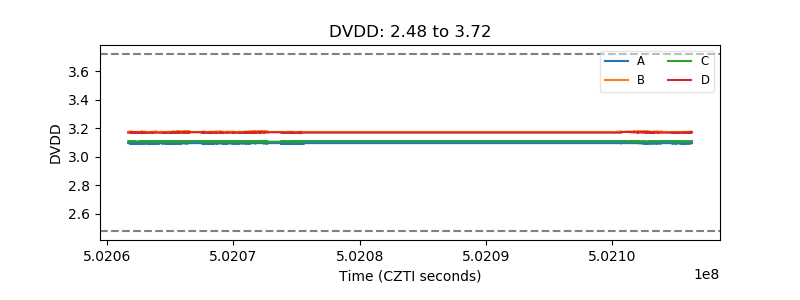 |
| Temperature 1 | 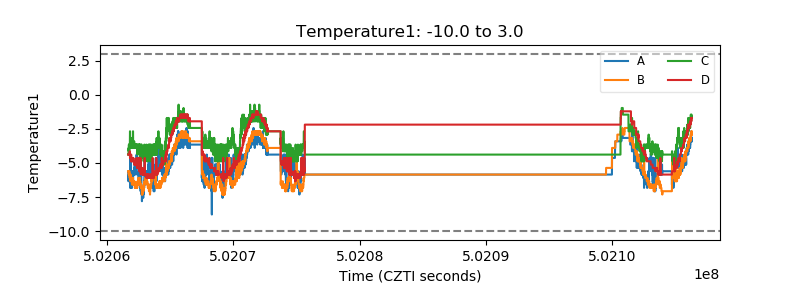 |
| Veto HV Monitor | 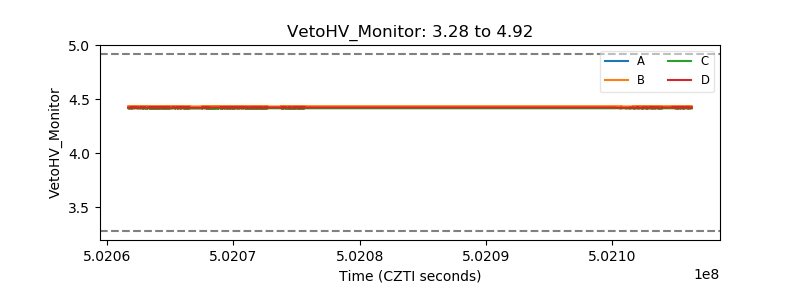 |
| Veto LLD | 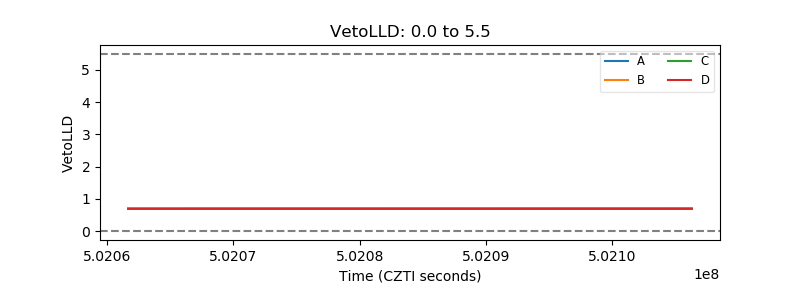 |
| Alpha Counter |  |
| _CPM_Rate | 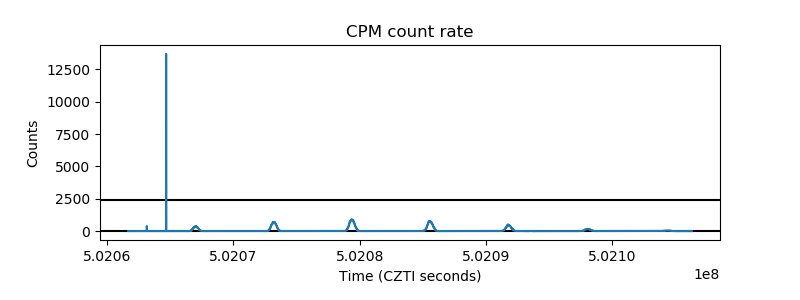 |
| CZT Counter | 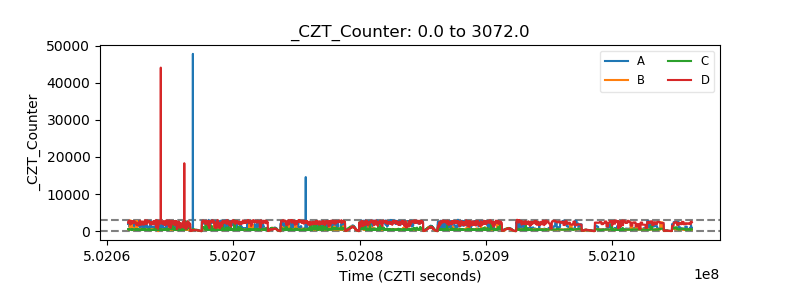 |
| +2.5 Volts monitor |  |
| +5 Volts monitor |  |
| _ROLL_ROT | 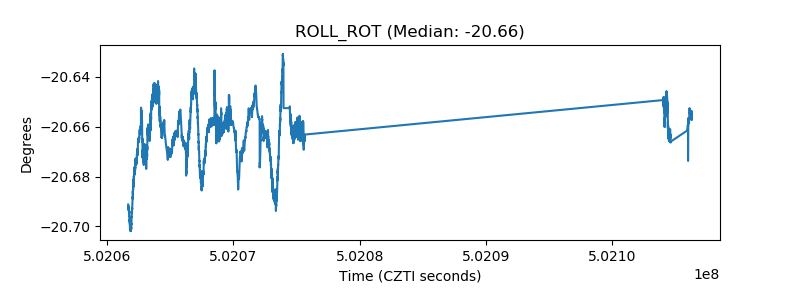 |
| _Roll_DEC | 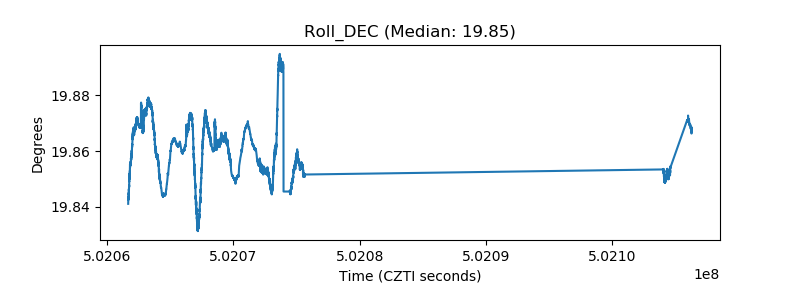 |
| _Roll_RA | 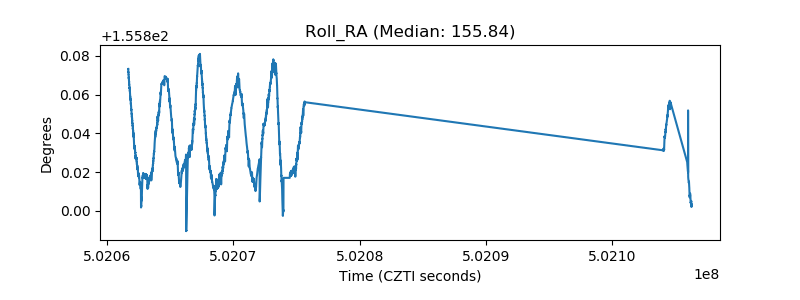 |
| Veto Counter | 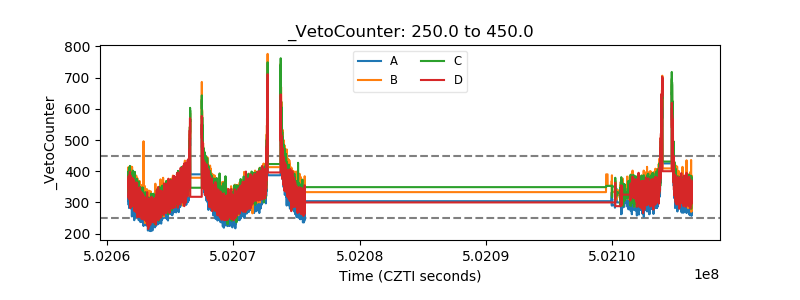 |