| Param | Original file | Final file |
|---|---|---|
| Filename | modeM0/AS1A14_025T01_9000006530_55028cztM0_level2.fits | modeM0/AS1A14_025T01_9000006530_55028cztM0_level2_quad_clean.evt |
| Size (bytes) | 833,837,760 | 74,522,880 |
| Size | 795.2 MB | 71.1 MB |
| Events in quadrant A | 8,137,078 | 457,626 |
| Events in quadrant B | 3,662,144 | 688,071 |
| Events in quadrant C | 3,506,107 | 617,193 |
| Events in quadrant D | 15,011,922 | 2,789 |
| Mode M0 | |||
|---|---|---|---|
| Quadrant | BADHDUFLAG | Total packets | Discarded packets |
| A | 0 | 29166 | 145 |
| B | 0 | 16014 | 56 |
| C | 0 | 15612 | 97 |
| D | 0 | 49863 | 455 |
| Mode SS | |||
|---|---|---|---|
| Quadrant | BADHDUFLAG | Total packets | Discarded packets |
| A | 0 | 142 | 0 |
| B | 0 | 142 | 0 |
| C | 0 | 142 | 0 |
| D | 0 | 142 | 0 |
| Quadrant | Total seconds | Saturated seconds | Saturation percentage |
|---|---|---|---|
| A | 7046 | 2408 | 34.175419% |
| B | 7057 | 444 | 6.291625% |
| C | 7044 | 288 | 4.088586% |
| D | 7014 | 6989 | 99.643570% |
Noise dominated data is calculated using 1-second bins in cleaned event files. If a bin has >2000 counts, and if more than 50% of those come from <1% of pixels, then it is considered to be noise-dominated and hence unusable.
| Quadrant | # 1 sec bins | Bins with >0 counts | Bins with >2000 counts | High rate bins dominated by noise | Noise dominated (total time) | Noise dominated (detector-on time) | Marked lightcurve |
|---|---|---|---|---|---|---|---|
| A | 7085 | 7073 | 1630 | 1630 | 23.01% | 23.05% | 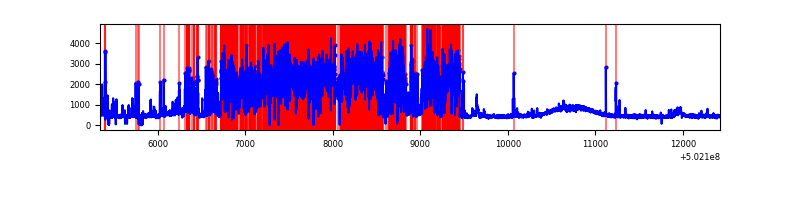 |
| B | 7085 | 7073 | 73 | 73 | 1.03% | 1.03% | 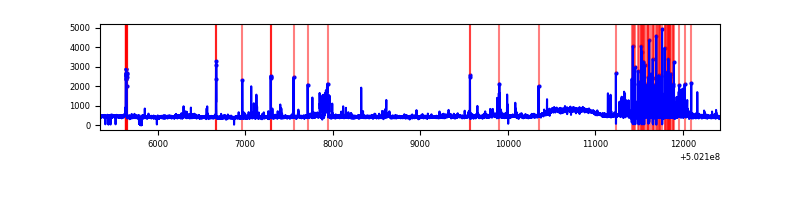 |
| C | 7086 | 7066 | 16 | 16 | 0.23% | 0.23% | 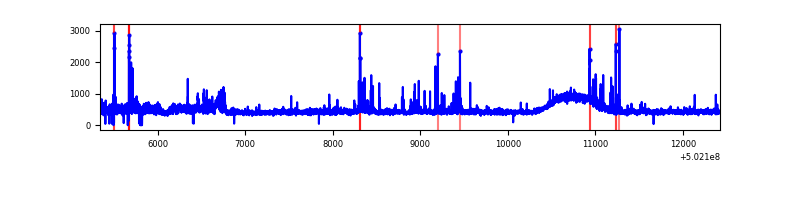 |
| D | 7086 | 7034 | 4303 | 4303 | 60.73% | 61.17% | 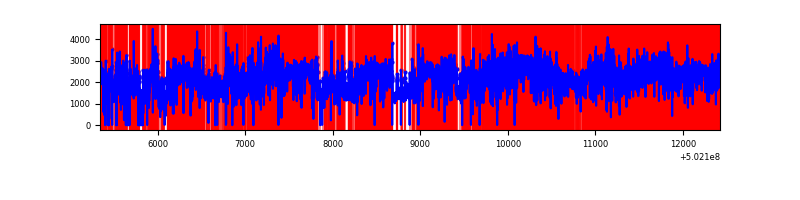 |
Top three noisy pixels from each quadrant. If the there are fewer than three noisy pixels in the level2.evt file, extra rows are filled as -1
| Pixel properties | Quadrant properties | ||||||
|---|---|---|---|---|---|---|---|
| Quadrant | DetID | PixID | Counts | Sigma | Mean | Median | Sigma |
| A | 15 | 32 | 5498628 | 34585.24 | 651 | 634 | 159.0 |
| A | 3 | 45 | 20323 | 123.85 | 651 | 634 | 159.0 |
| A | 0 | 8 | 19710 | 120.0 | 651 | 634 | 159.0 |
| B | 5 | 236 | 375373 | 2203.46 | 778 | 748 | 170.0 |
| B | 5 | 185 | 75253 | 438.22 | 778 | 748 | 170.0 |
| B | 10 | 245 | 51153 | 296.47 | 778 | 748 | 170.0 |
| C | 1 | 16 | 194246 | 895.33 | 785 | 776 | 216.1 |
| C | 6 | 223 | 116562 | 535.83 | 785 | 776 | 216.1 |
| C | 12 | 252 | 64597 | 295.34 | 785 | 776 | 216.1 |
| D | 15 | 94 | 9704362 | 185193.38 | 177 | 167 | 52.4 |
| D | 15 | 93 | 1466713 | 27987.34 | 177 | 167 | 52.4 |
| D | 11 | 129 | 1168527 | 22296.8 | 177 | 167 | 52.4 |
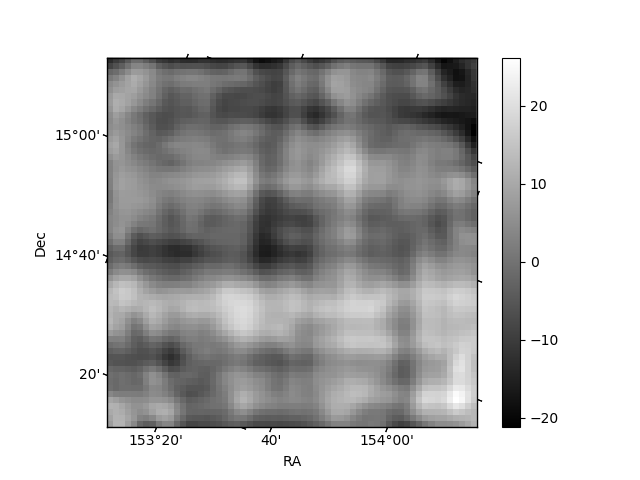
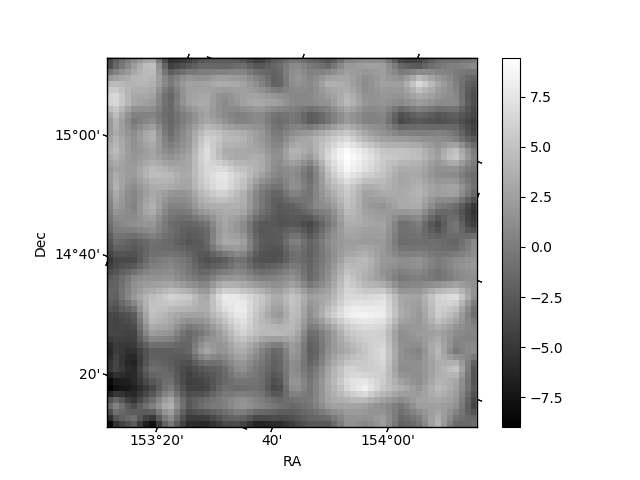
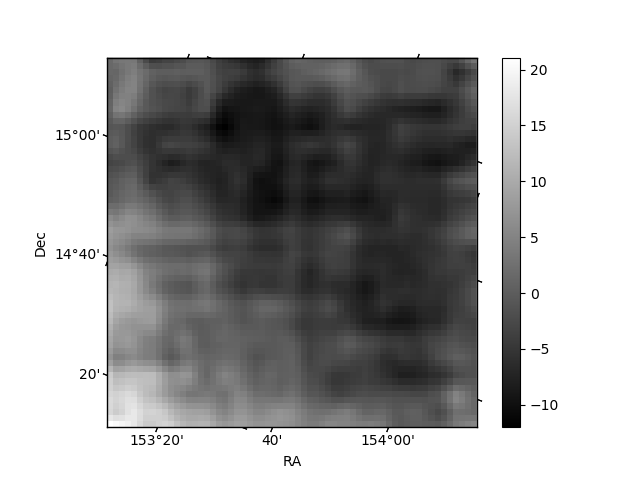
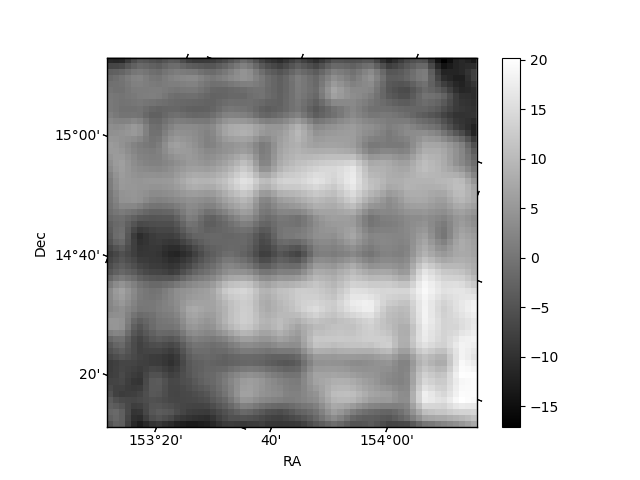
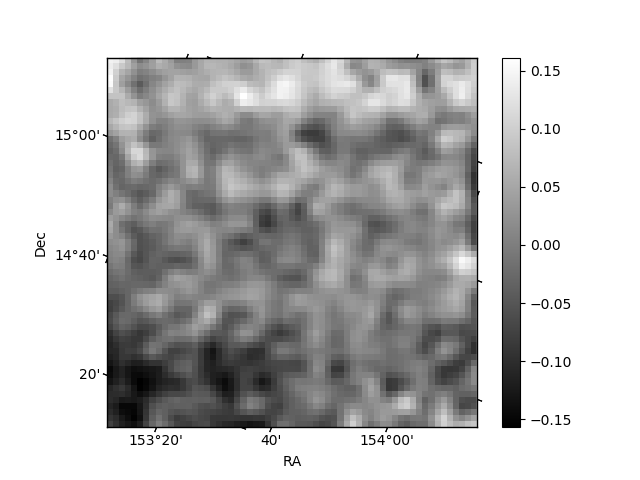
Histogram calculated using DETX and DETY for each event in the final _common_clean file
| Quadrant A | 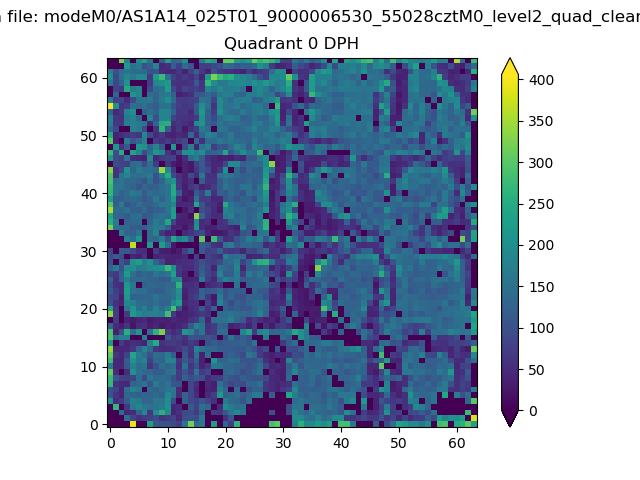 |
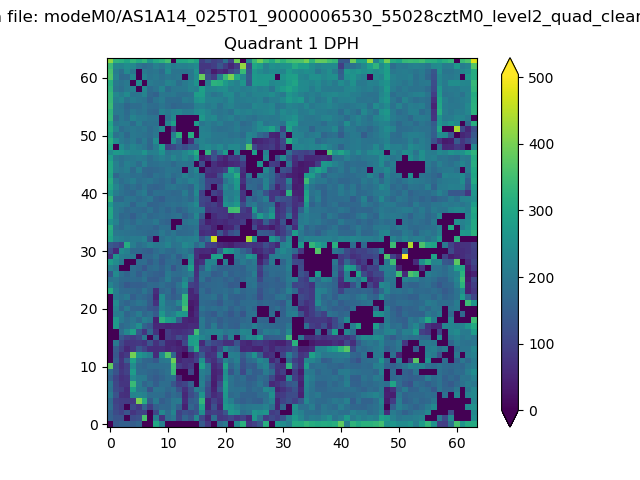 |
Quadrant B |
|---|---|---|---|
| Quadrant D | 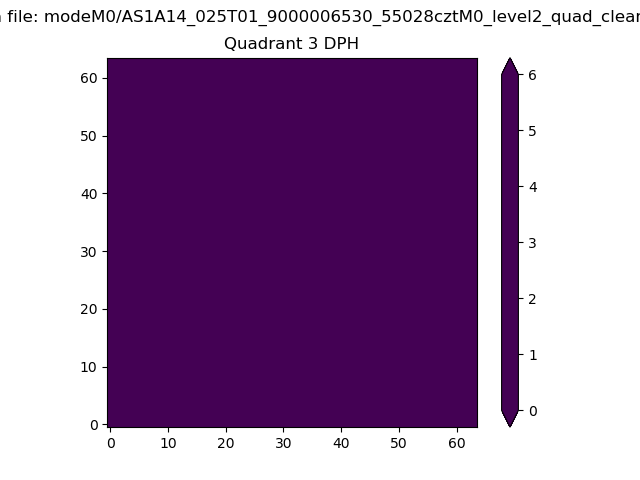 |
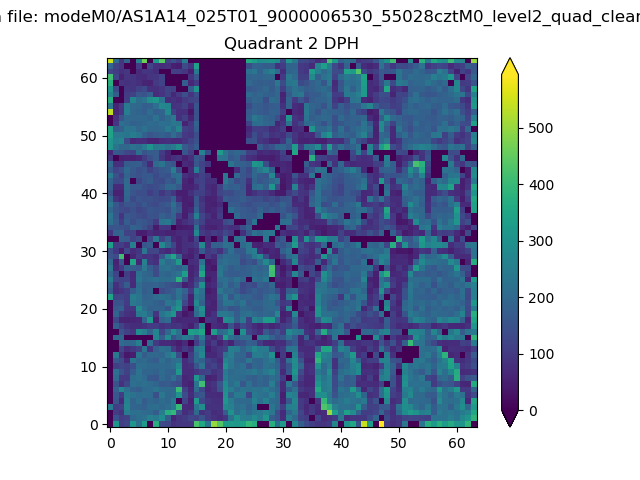 |
Quadrant C |
| Plot type | Count rate plots | Images |
|---|---|---|
| Comparison with Poisson distribution Blue bars denote a histogram of data divided into 1 sec bins. Red curve is a Poisson curve with rate = median count rate of data. |
 |
 |
| Quadrant-wise count rates Data is divided into 100 sec bins |
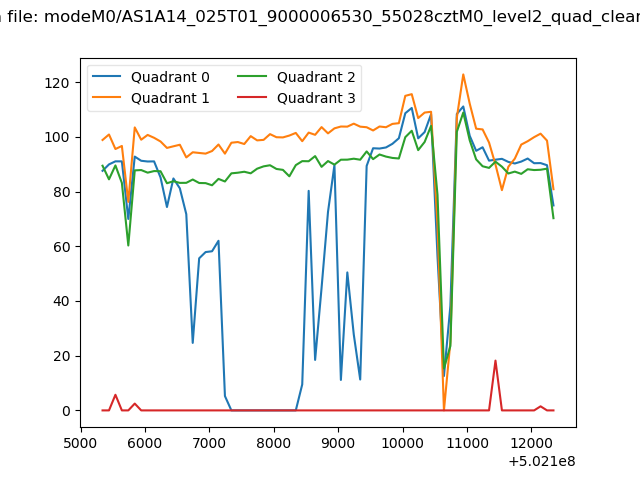 |
|
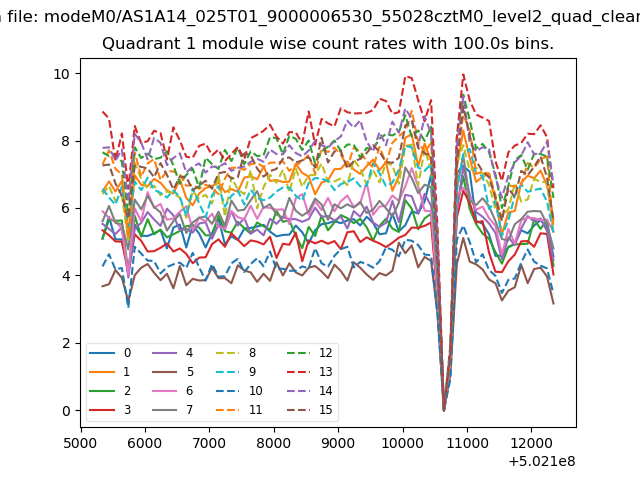
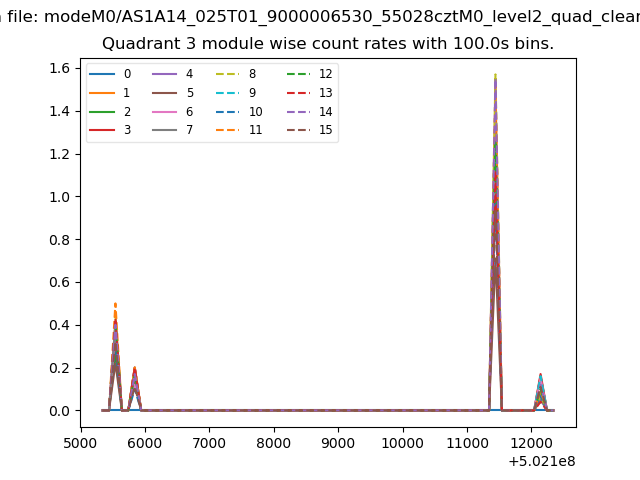
| Module-wise count rates for Quadrant A Data is divided into 100 sec bins |
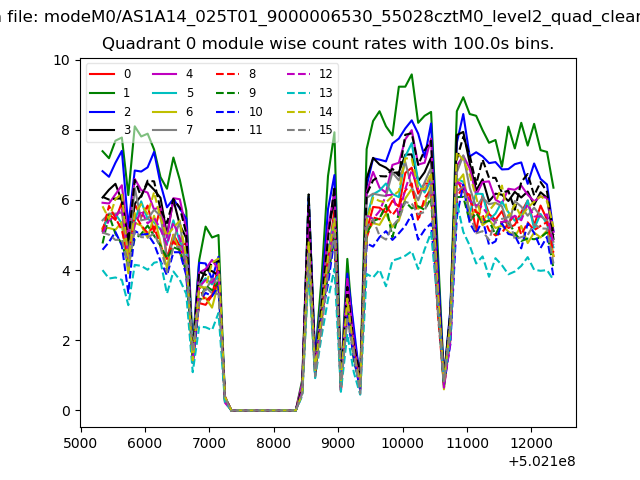 |
 |
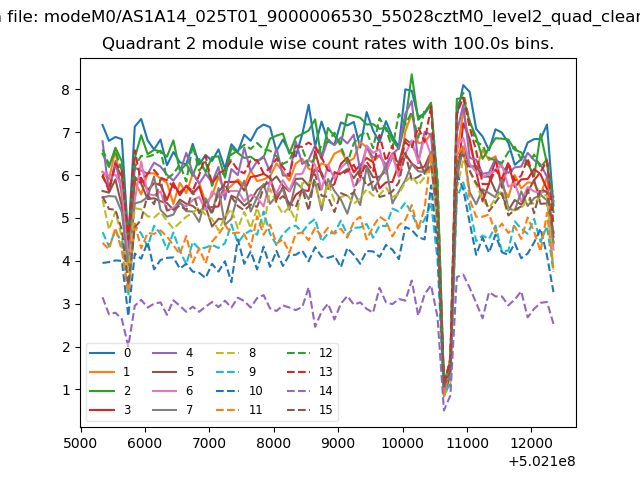
| Module-wise count rates for Quadrant B Data is divided into 100 sec bins |
 |
 |
| Module-wise count rates for Quadrant C Data is divided into 100 sec bins |
 |
 |
| Module-wise count rates for Quadrant D Data is divided into 100 sec bins |
 |
 |
| Parameter | Plot |
|---|---|
| CZT HV Monitor | 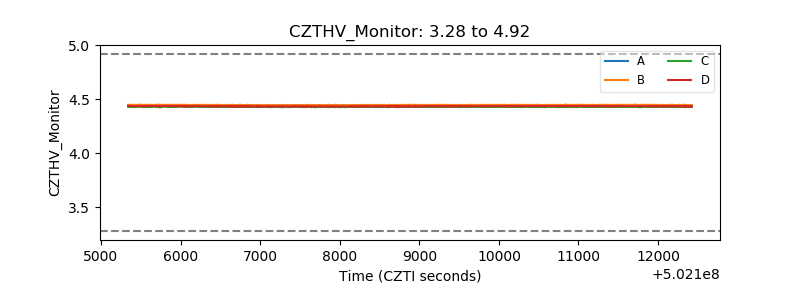 |
| D_VDD | 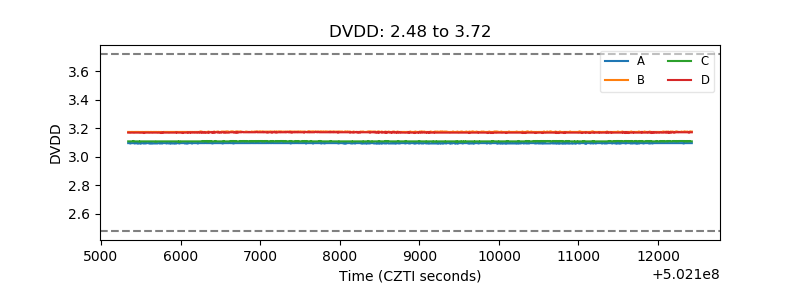 |
| Temperature 1 | 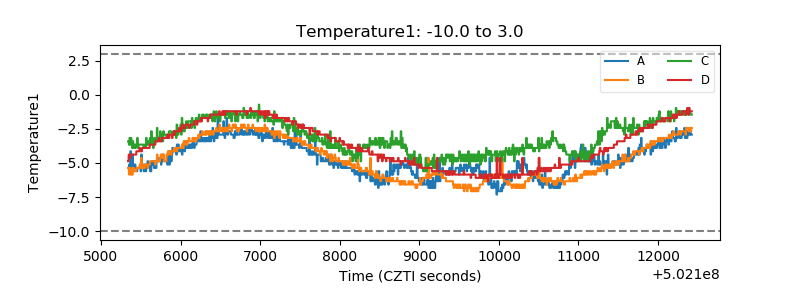 |
| Veto HV Monitor |  |
| Veto LLD | 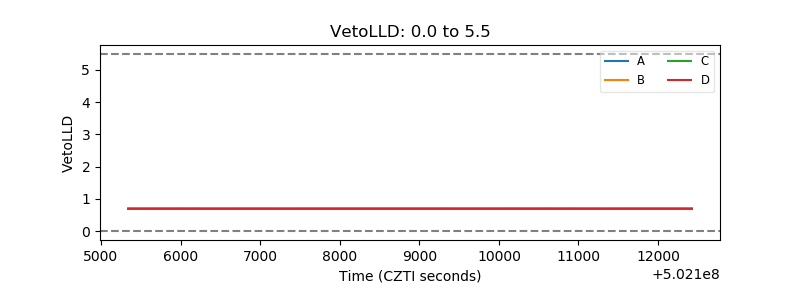 |
| Alpha Counter |  |
| _CPM_Rate | 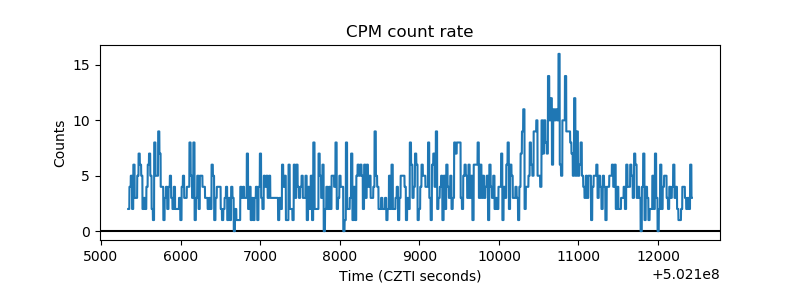 |
| CZT Counter | 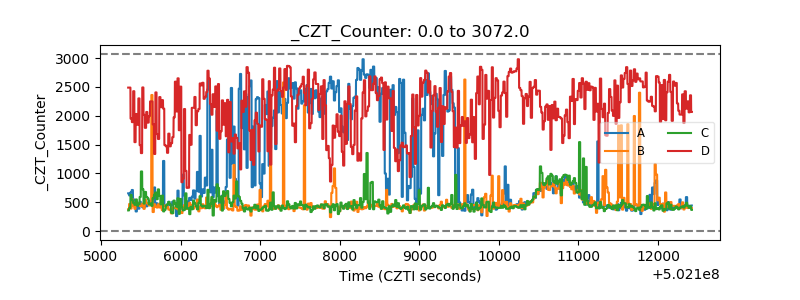 |
| +2.5 Volts monitor |  |
| +5 Volts monitor |  |
| _ROLL_ROT | 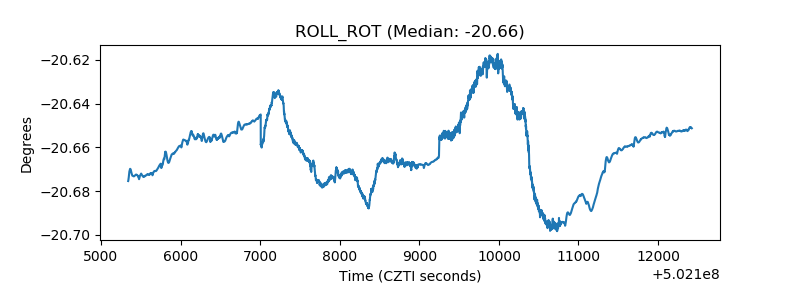 |
| _Roll_DEC | 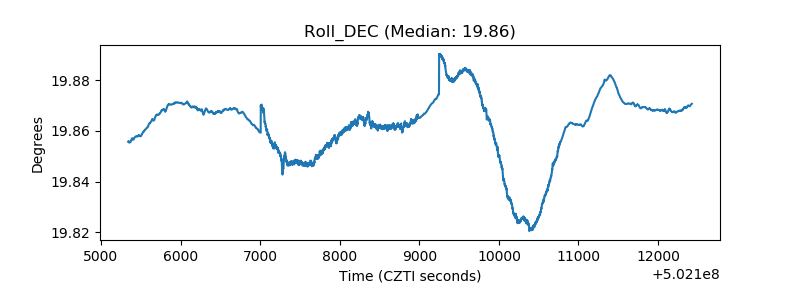 |
| _Roll_RA | 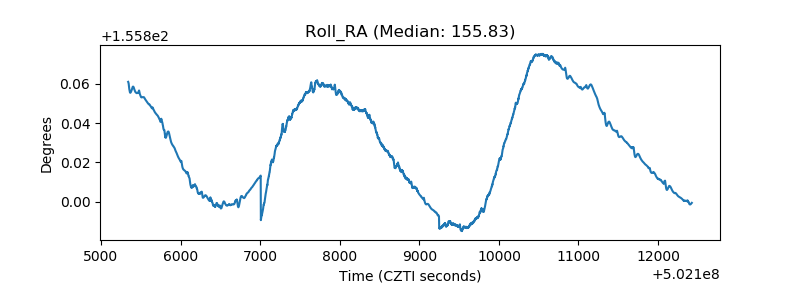 |
| Veto Counter | 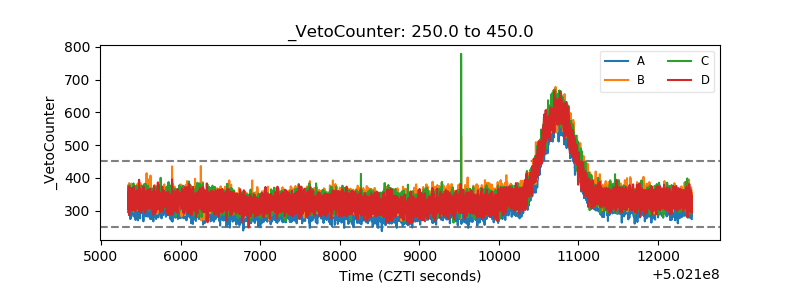 |