| Param | Original file | Final file |
|---|---|---|
| Filename | modeM0/AS1A14_025T01_9000006530_55035cztM0_level2.fits | modeM0/AS1A14_025T01_9000006530_55035cztM0_level2_quad_clean.evt |
| Size (bytes) | 1,313,896,320 | 149,647,680 |
| Size | 1.2 GB | 142.7 MB |
| Events in quadrant A | 10,519,977 | 1,022,810 |
| Events in quadrant B | 5,945,017 | 1,235,506 |
| Events in quadrant C | 5,507,718 | 1,103,115 |
| Events in quadrant D | 25,719,350 | 326,332 |
| Mode M0 | |||
|---|---|---|---|
| Quadrant | BADHDUFLAG | Total packets | Discarded packets |
| A | 0 | 39979 | 33 |
| B | 0 | 26558 | 9 |
| C | 0 | 25488 | 11 |
| D | 0 | 84803 | 70 |
| Mode SS | |||
|---|---|---|---|
| Quadrant | BADHDUFLAG | Total packets | Discarded packets |
| A | 0 | 248 | 0 |
| B | 0 | 248 | 0 |
| C | 0 | 248 | 0 |
| D | 0 | 248 | 0 |
| Mode M9 | |||
|---|---|---|---|
| Quadrant | BADHDUFLAG | Total packets | Discarded packets |
| A | 0 | 18 | 0 |
| B | 0 | 18 | 0 |
| C | 0 | 18 | 0 |
| D | 0 | 18 | 0 |
| Quadrant | Total seconds | Saturated seconds | Saturation percentage |
|---|---|---|---|
| A | 12188 | 1494 | 12.257959% |
| B | 12194 | 166 | 1.361325% |
| C | 12193 | 76 | 0.623308% |
| D | 12189 | 8782 | 72.048568% |
Noise dominated data is calculated using 1-second bins in cleaned event files. If a bin has >2000 counts, and if more than 50% of those come from <1% of pixels, then it is considered to be noise-dominated and hence unusable.
| Quadrant | # 1 sec bins | Bins with >0 counts | Bins with >2000 counts | High rate bins dominated by noise | Noise dominated (total time) | Noise dominated (detector-on time) | Marked lightcurve |
|---|---|---|---|---|---|---|---|
| A | 13997 | 12199 | 1197 | 1197 | 8.55% | 9.81% | 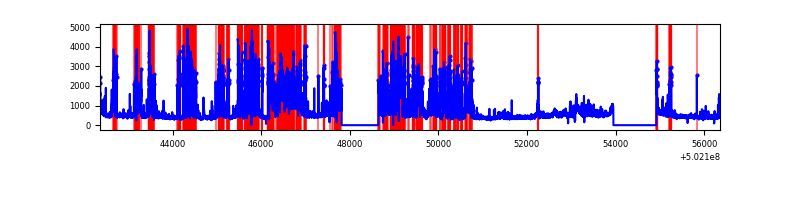 |
| B | 13997 | 12199 | 52 | 52 | 0.37% | 0.43% | 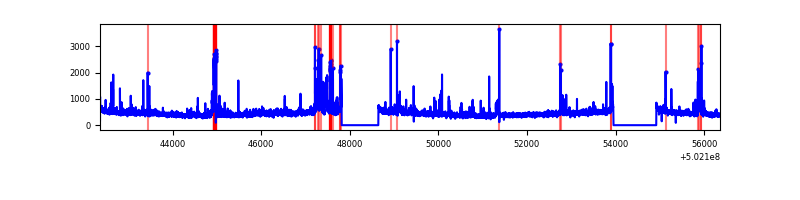 |
| C | 13997 | 12199 | 23 | 23 | 0.16% | 0.19% | 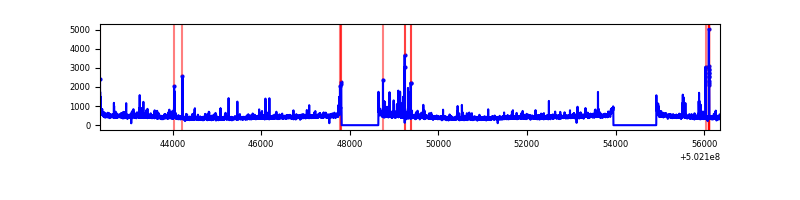 |
| D | 13998 | 12197 | 7237 | 7237 | 51.70% | 59.33% | 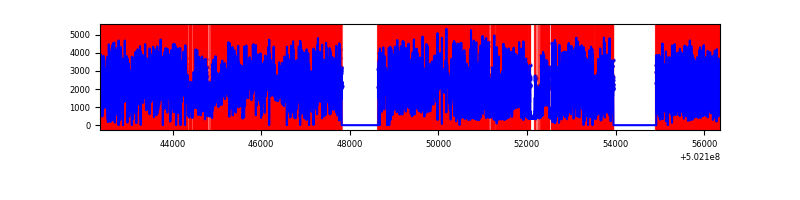 |
Top three noisy pixels from each quadrant. If the there are fewer than three noisy pixels in the level2.evt file, extra rows are filled as -1
| Pixel properties | Quadrant properties | ||||||
|---|---|---|---|---|---|---|---|
| Quadrant | DetID | PixID | Counts | Sigma | Mean | Median | Sigma |
| A | 15 | 32 | 4530120 | 14890.23 | 1237 | 1209 | 304.2 |
| A | 0 | 8 | 906125 | 2975.2 | 1237 | 1209 | 304.2 |
| A | 3 | 45 | 98896 | 321.18 | 1237 | 1209 | 304.2 |
| B | 4 | 81 | 225862 | 816.44 | 1289 | 1241 | 275.1 |
| B | 5 | 236 | 191471 | 691.43 | 1289 | 1241 | 275.1 |
| B | 2 | 249 | 99458 | 356.99 | 1289 | 1241 | 275.1 |
| C | 1 | 16 | 149931 | 421.71 | 1275 | 1264 | 352.5 |
| C | 12 | 252 | 142456 | 400.5 | 1275 | 1264 | 352.5 |
| C | 14 | 254 | 98436 | 275.64 | 1275 | 1264 | 352.5 |
| D | 11 | 129 | 9380143 | 46667.76 | 691 | 658 | 201.0 |
| D | 15 | 94 | 7700866 | 38312.5 | 691 | 658 | 201.0 |
| D | 15 | 93 | 2009810 | 9996.56 | 691 | 658 | 201.0 |
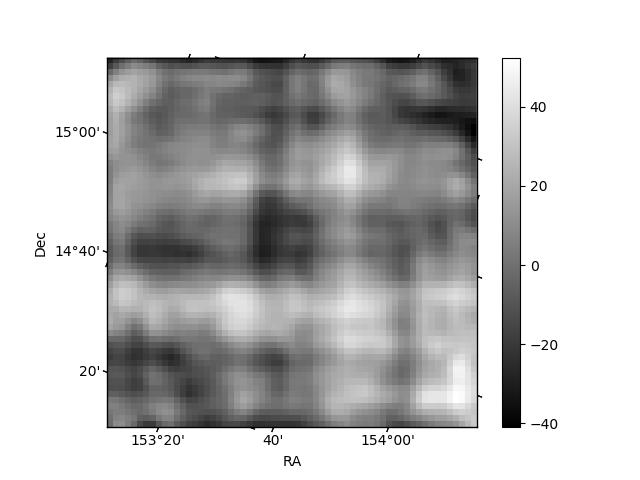
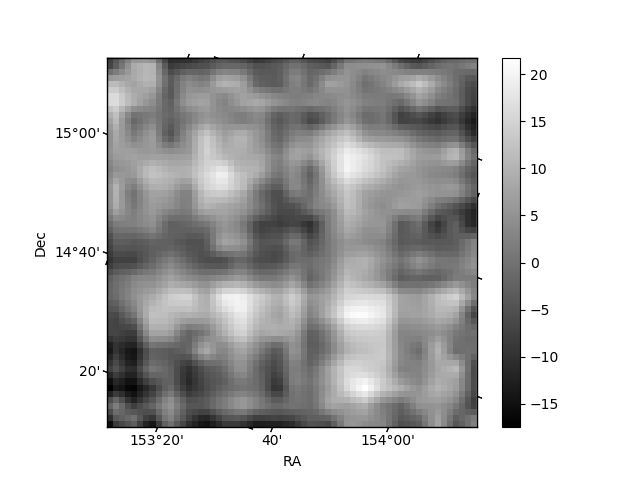
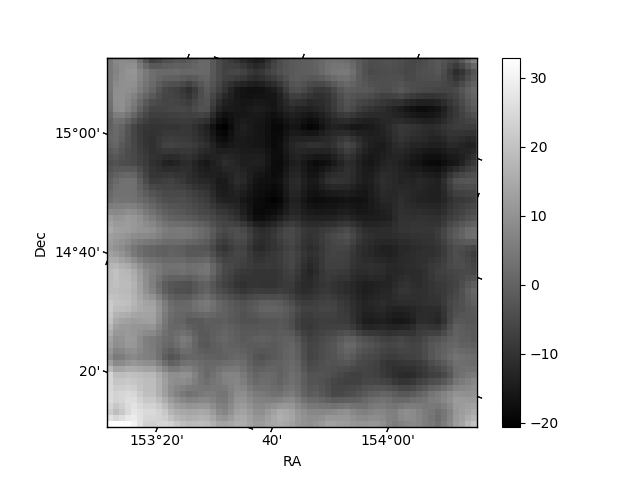
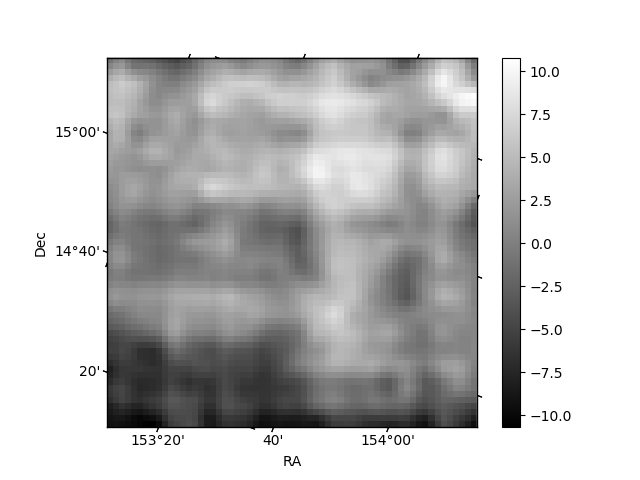
Histogram calculated using DETX and DETY for each event in the final _common_clean file
| Quadrant A | 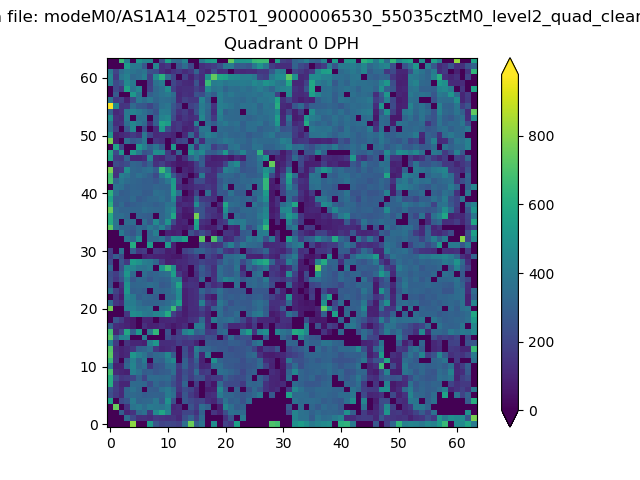 |
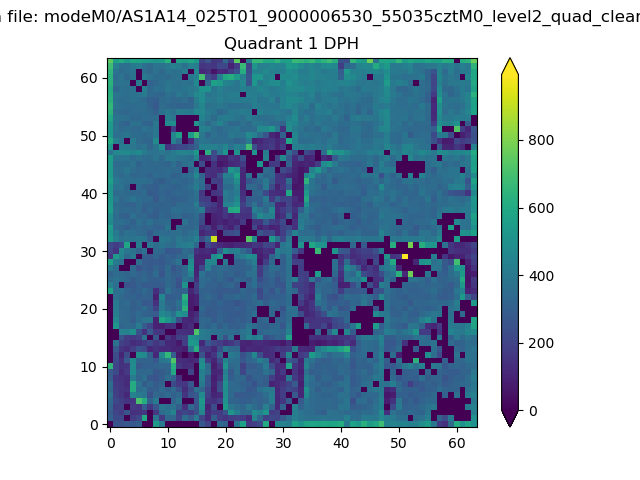 |
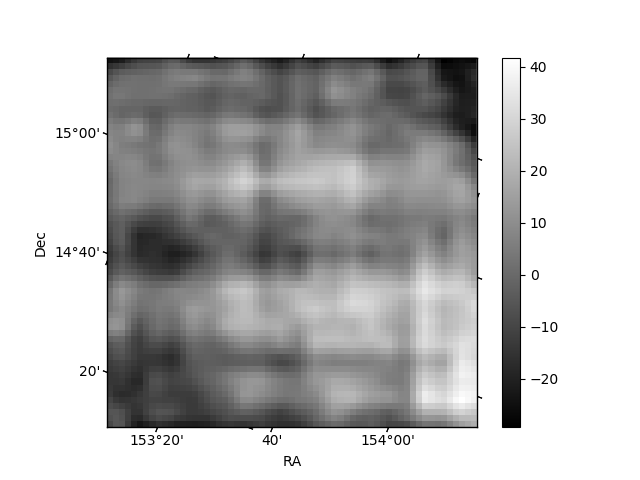
Quadrant B |
|---|---|---|---|
| Quadrant D |  |
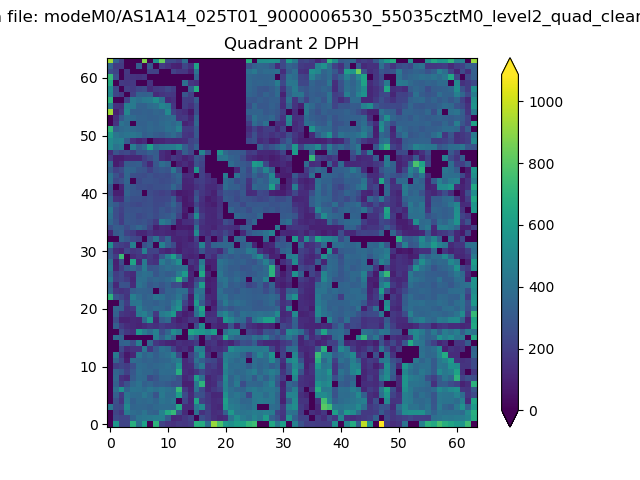 |
Quadrant C |
| Plot type | Count rate plots | Images |
|---|---|---|
| Comparison with Poisson distribution Blue bars denote a histogram of data divided into 1 sec bins. Red curve is a Poisson curve with rate = median count rate of data. |
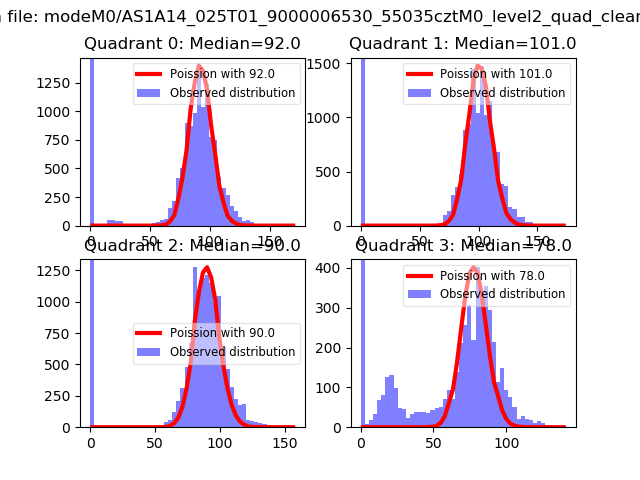 |
 |
| Quadrant-wise count rates Data is divided into 100 sec bins |
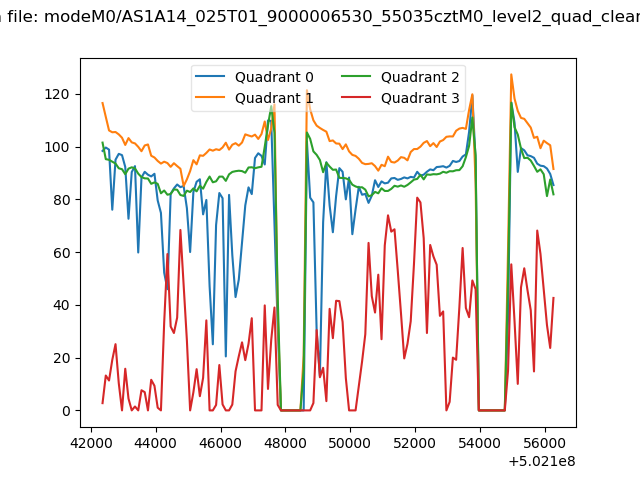 |
|
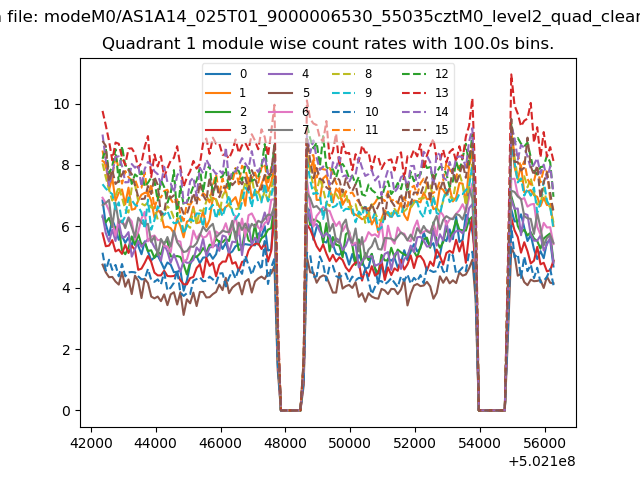
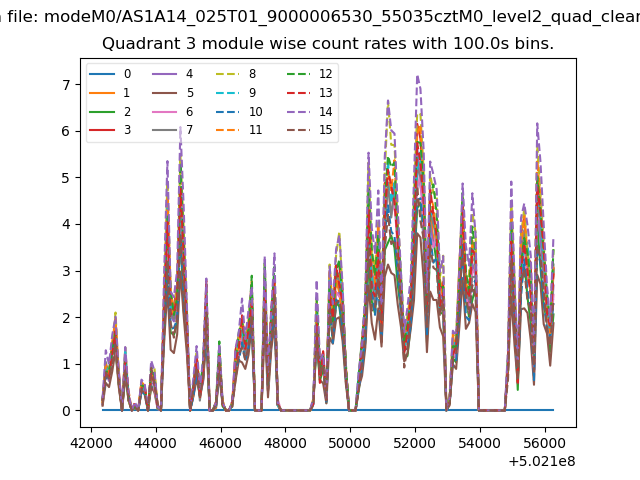
| Module-wise count rates for Quadrant A Data is divided into 100 sec bins |
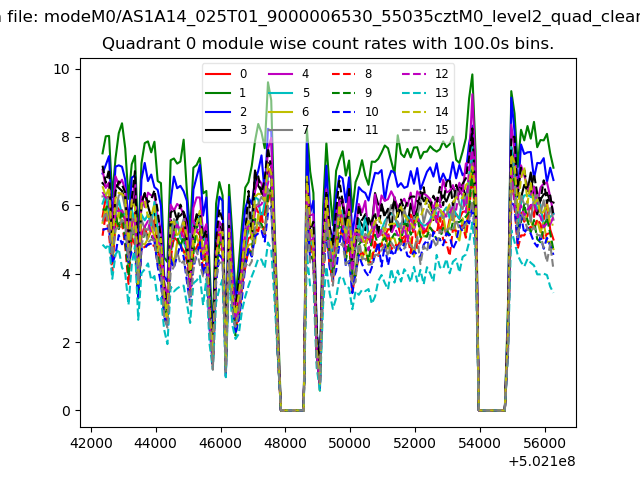 |
 |
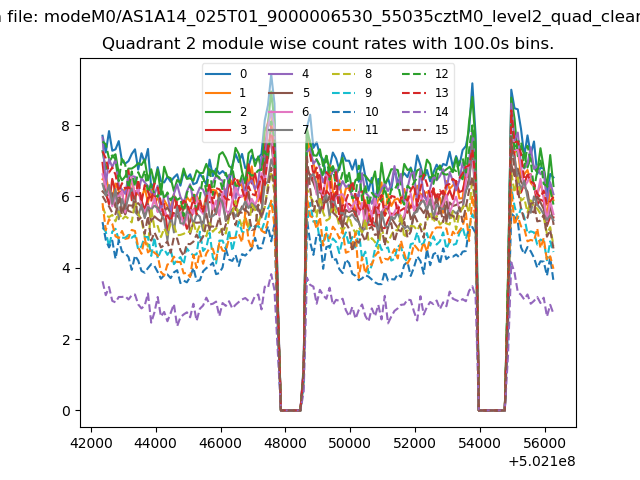
| Module-wise count rates for Quadrant B Data is divided into 100 sec bins |
 |
 |
| Module-wise count rates for Quadrant C Data is divided into 100 sec bins |
 |
 |
| Module-wise count rates for Quadrant D Data is divided into 100 sec bins |
 |
 |
| Parameter | Plot |
|---|---|
| CZT HV Monitor | 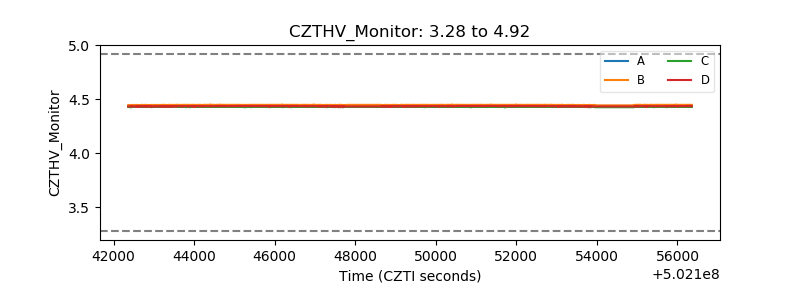 |
| D_VDD | 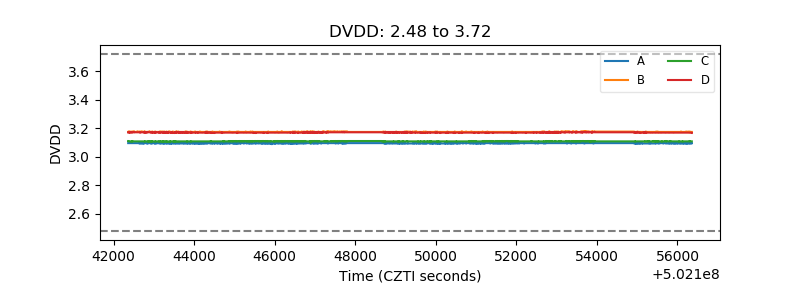 |
| Temperature 1 | 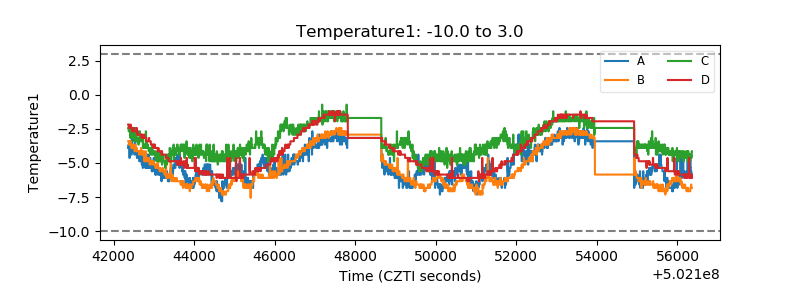 |
| Veto HV Monitor | 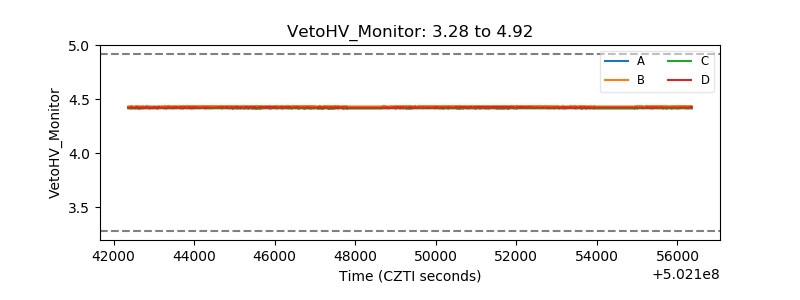 |
| Veto LLD | 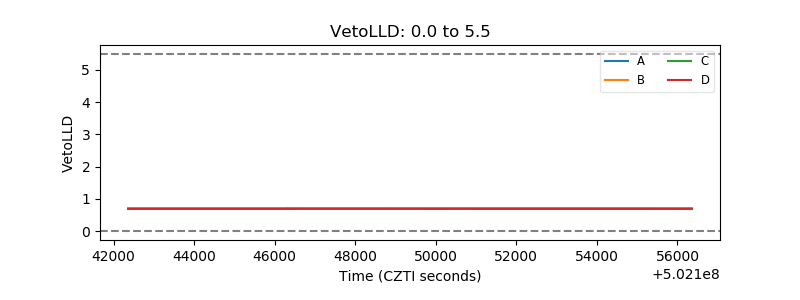 |
| Alpha Counter | 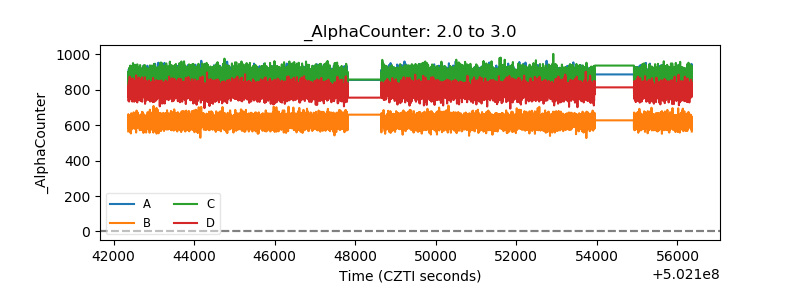 |
| _CPM_Rate | 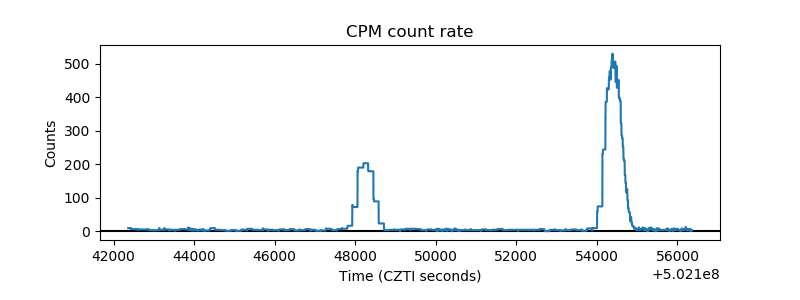 |
| CZT Counter |  |
| +2.5 Volts monitor |  |
| +5 Volts monitor |  |
| _ROLL_ROT | 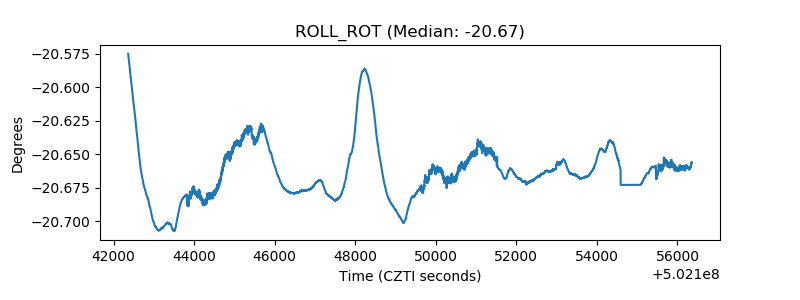 |
| _Roll_DEC | 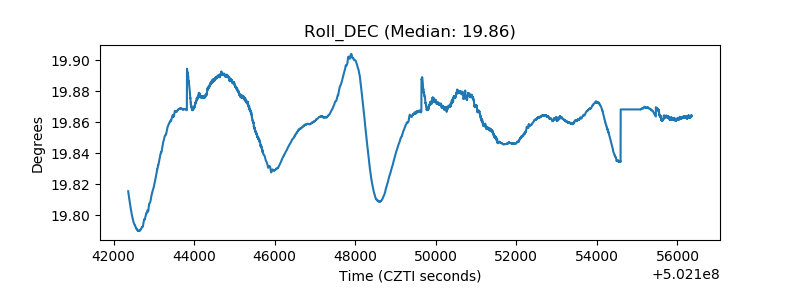 |
| _Roll_RA |  |
| Veto Counter | 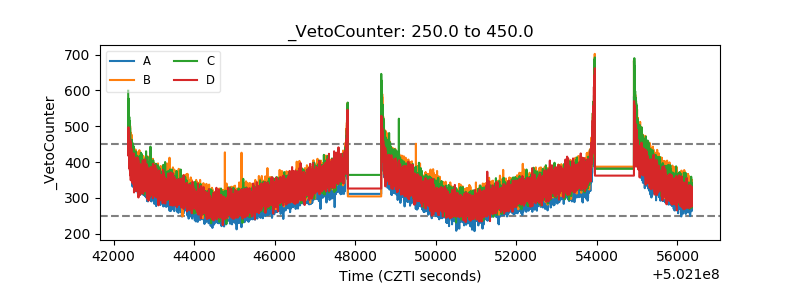 |