| Param | Original file | Final file |
|---|---|---|
| Filename | modeM0/AS1A14_025T01_9000006530_55037cztM0_level2.fits | modeM0/AS1A14_025T01_9000006530_55037cztM0_level2_quad_clean.evt |
| Size (bytes) | 723,559,680 | 87,275,520 |
| Size | 690.0 MB | 83.2 MB |
| Events in quadrant A | 7,272,224 | 549,062 |
| Events in quadrant B | 3,205,687 | 712,940 |
| Events in quadrant C | 3,074,933 | 626,550 |
| Events in quadrant D | 12,706,417 | 282,418 |
| Mode M0 | |||
|---|---|---|---|
| Quadrant | BADHDUFLAG | Total packets | Discarded packets |
| A | 0 | 26372 | 17 |
| B | 0 | 14496 | 2 |
| C | 0 | 14330 | 6 |
| D | 0 | 42461 | 34 |
| Mode SS | |||
|---|---|---|---|
| Quadrant | BADHDUFLAG | Total packets | Discarded packets |
| A | 0 | 138 | 0 |
| B | 0 | 138 | 0 |
| C | 0 | 138 | 0 |
| D | 0 | 138 | 0 |
| Mode M9 | |||
|---|---|---|---|
| Quadrant | BADHDUFLAG | Total packets | Discarded packets |
| A | 0 | 17 | 0 |
| B | 0 | 17 | 0 |
| C | 0 | 17 | 0 |
| D | 0 | 18 | 0 |
| Quadrant | Total seconds | Saturated seconds | Saturation percentage |
|---|---|---|---|
| A | 6757 | 1289 | 19.076513% |
| B | 6761 | 51 | 0.754326% |
| C | 6759 | 32 | 0.473443% |
| D | 6757 | 3843 | 56.874353% |
Noise dominated data is calculated using 1-second bins in cleaned event files. If a bin has >2000 counts, and if more than 50% of those come from <1% of pixels, then it is considered to be noise-dominated and hence unusable.
| Quadrant | # 1 sec bins | Bins with >0 counts | Bins with >2000 counts | High rate bins dominated by noise | Noise dominated (total time) | Noise dominated (detector-on time) | Marked lightcurve |
|---|---|---|---|---|---|---|---|
| A | 7871 | 6762 | 1138 | 1138 | 14.46% | 16.83% | 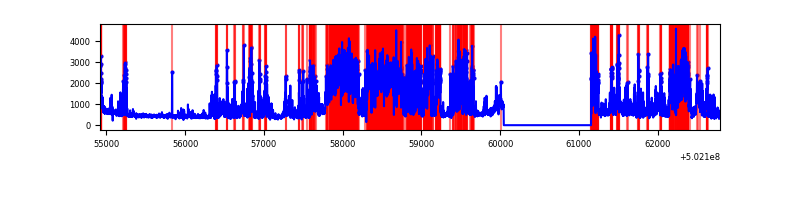 |
| B | 7871 | 6762 | 16 | 16 | 0.20% | 0.24% | 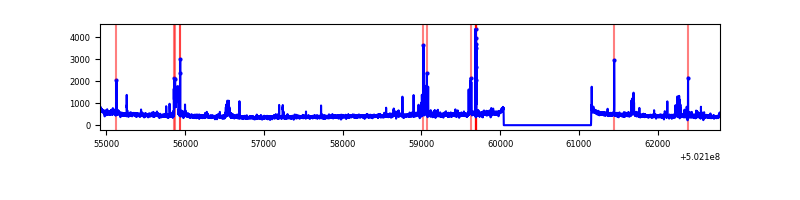 |
| C | 7871 | 6762 | 24 | 24 | 0.30% | 0.35% | 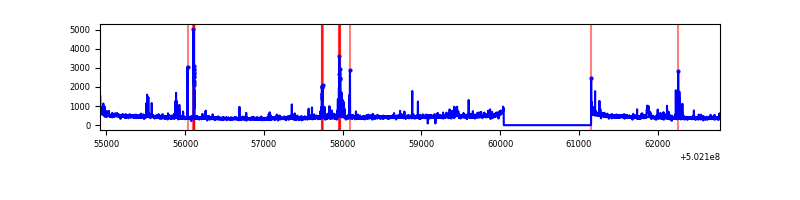 |
| D | 7871 | 6761 | 3071 | 3071 | 39.02% | 45.42% | 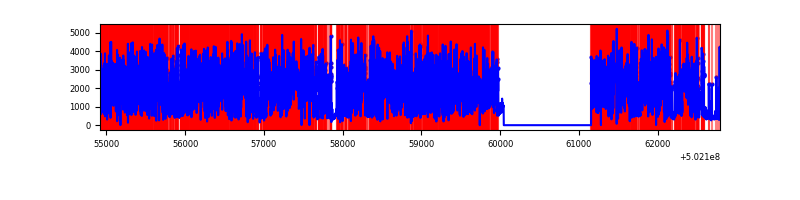 |
Top three noisy pixels from each quadrant. If the there are fewer than three noisy pixels in the level2.evt file, extra rows are filled as -1
| Pixel properties | Quadrant properties | ||||||
|---|---|---|---|---|---|---|---|
| Quadrant | DetID | PixID | Counts | Sigma | Mean | Median | Sigma |
| A | 15 | 32 | 4381440 | 26312.93 | 672 | 658 | 166.5 |
| A | 0 | 8 | 187943 | 1124.92 | 672 | 658 | 166.5 |
| A | 13 | 248 | 37291 | 220.03 | 672 | 658 | 166.5 |
| B | 5 | 185 | 119301 | 766.86 | 721 | 694 | 154.7 |
| B | 4 | 141 | 84561 | 542.25 | 721 | 694 | 154.7 |
| B | 10 | 247 | 73703 | 472.05 | 721 | 694 | 154.7 |
| C | 14 | 254 | 67655 | 341.57 | 706 | 700 | 196.0 |
| C | 9 | 237 | 65650 | 331.34 | 706 | 700 | 196.0 |
| C | 12 | 252 | 60109 | 303.08 | 706 | 700 | 196.0 |
| D | 11 | 129 | 6912270 | 50531.0 | 476 | 455 | 136.8 |
| D | 15 | 94 | 2765489 | 20214.65 | 476 | 455 | 136.8 |
| D | 10 | 181 | 295559 | 2157.45 | 476 | 455 | 136.8 |
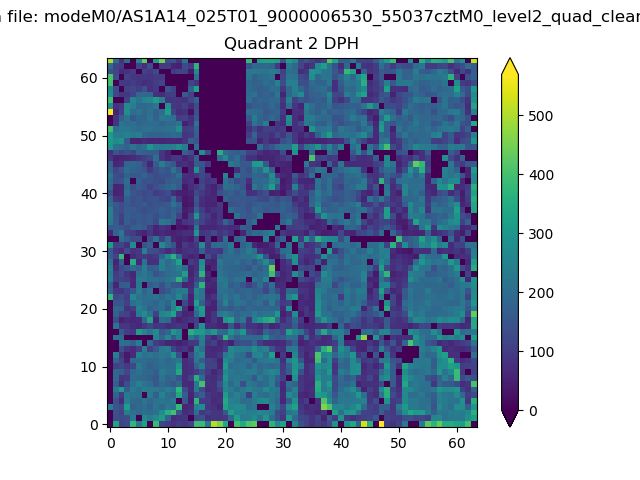
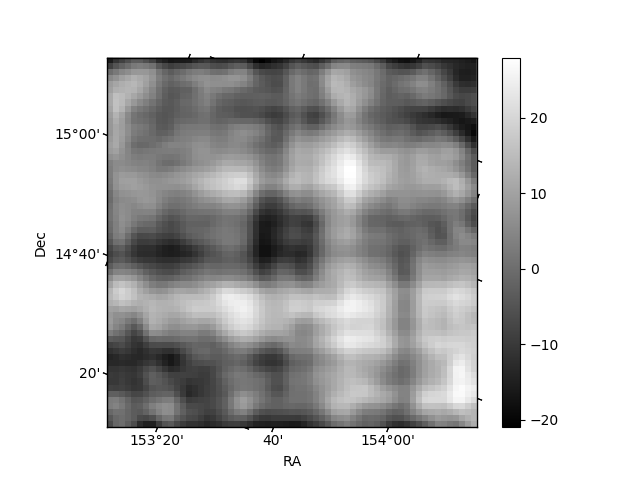
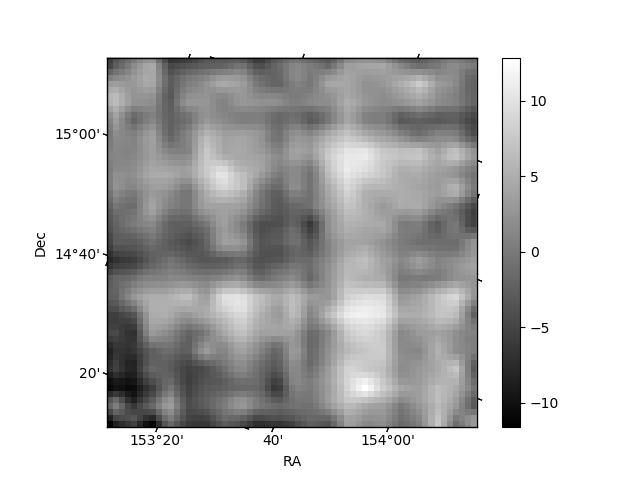
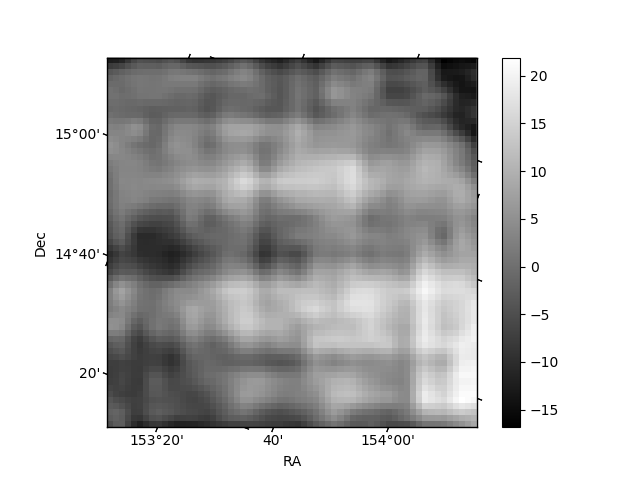
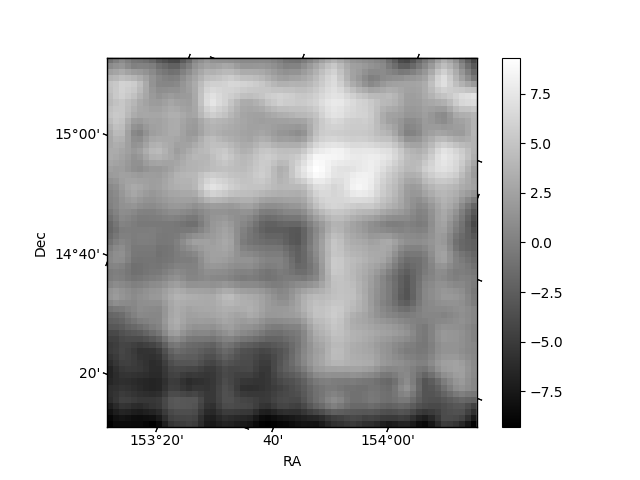
Histogram calculated using DETX and DETY for each event in the final _common_clean file
| Quadrant A | 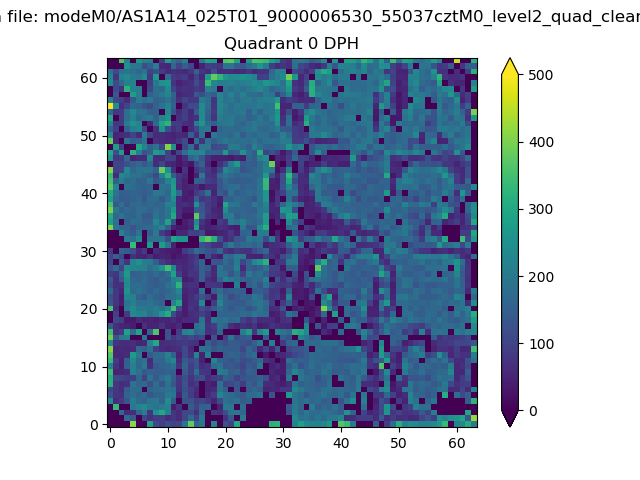 |
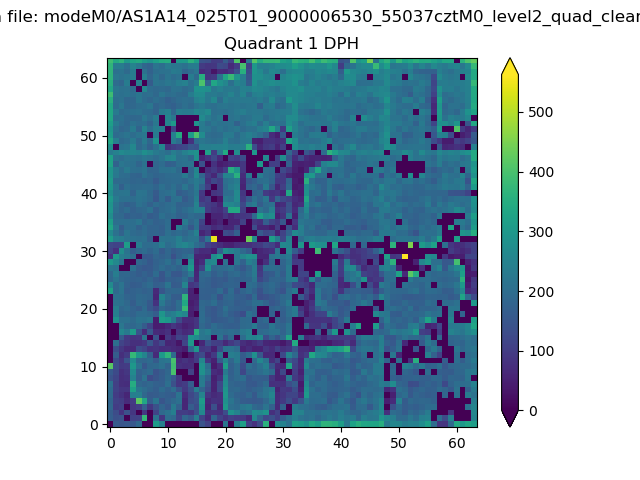 |
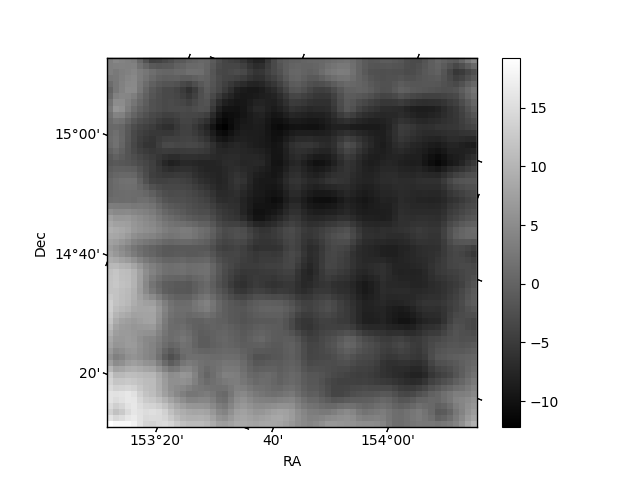
Quadrant B |
|---|---|---|---|
| Quadrant D | 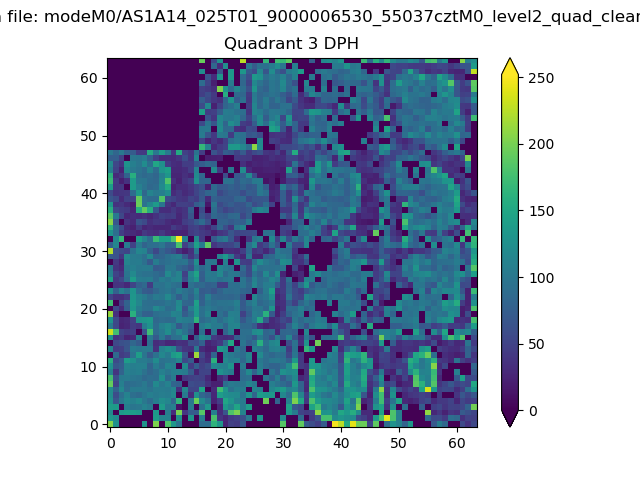 |
 |
Quadrant C |
| Plot type | Count rate plots | Images |
|---|---|---|
| Comparison with Poisson distribution Blue bars denote a histogram of data divided into 1 sec bins. Red curve is a Poisson curve with rate = median count rate of data. |
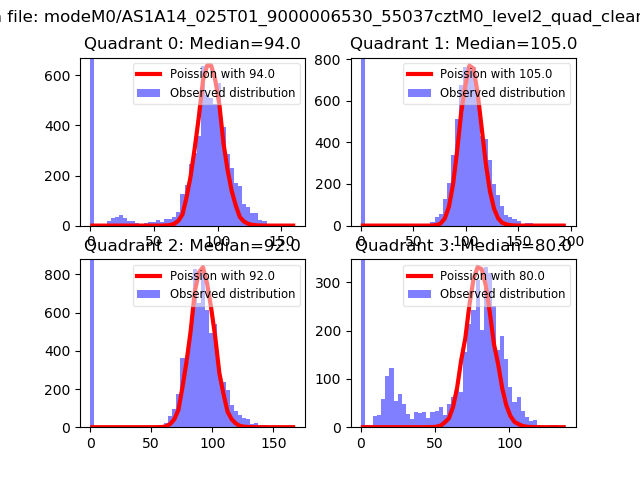 |
 |
| Quadrant-wise count rates Data is divided into 100 sec bins |
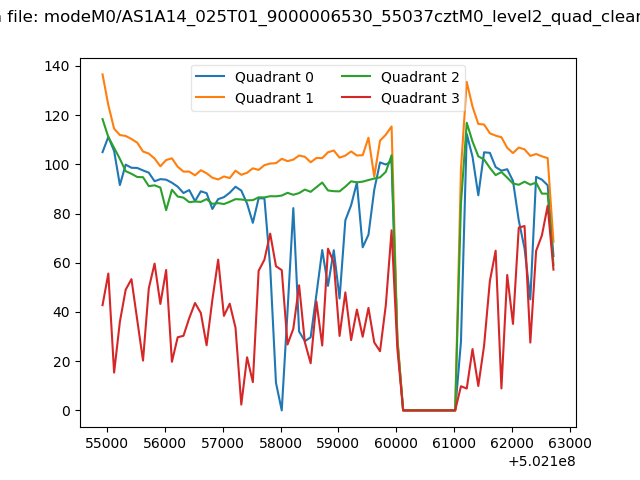 |
|
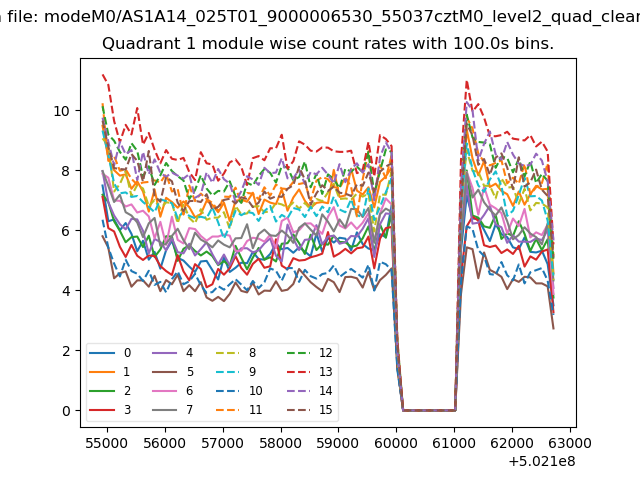
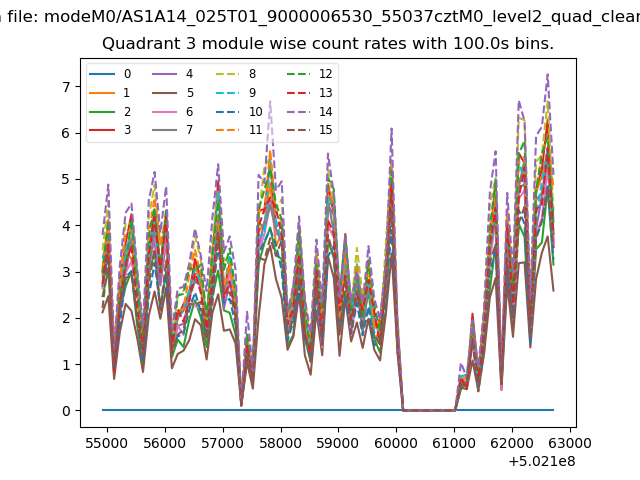
| Module-wise count rates for Quadrant A Data is divided into 100 sec bins |
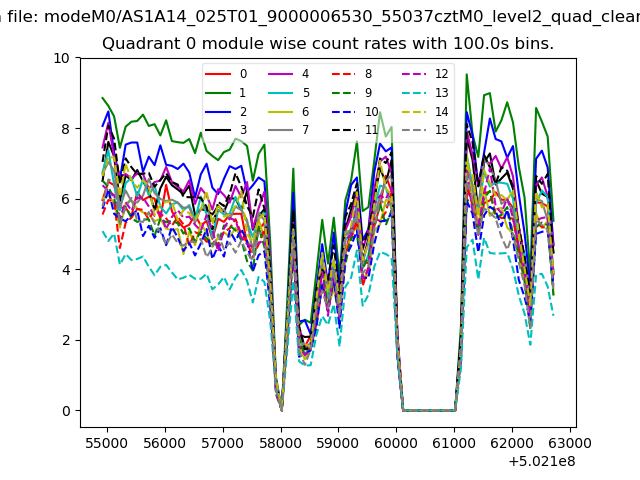 |
 |
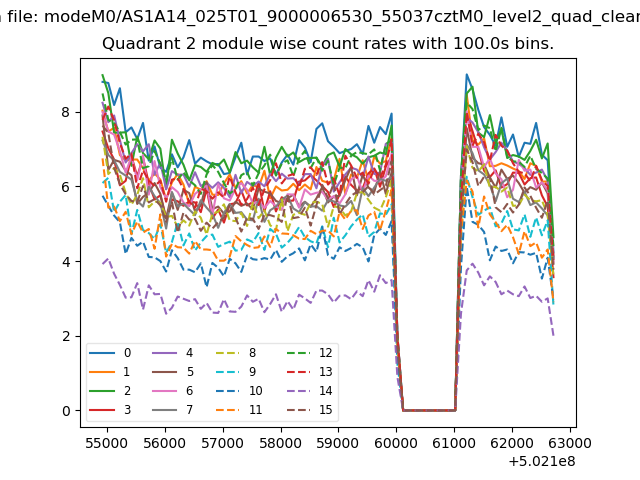
| Module-wise count rates for Quadrant B Data is divided into 100 sec bins |
 |
 |
| Module-wise count rates for Quadrant C Data is divided into 100 sec bins |
 |
 |
| Module-wise count rates for Quadrant D Data is divided into 100 sec bins |
 |
 |
| Parameter | Plot |
|---|---|
| CZT HV Monitor | 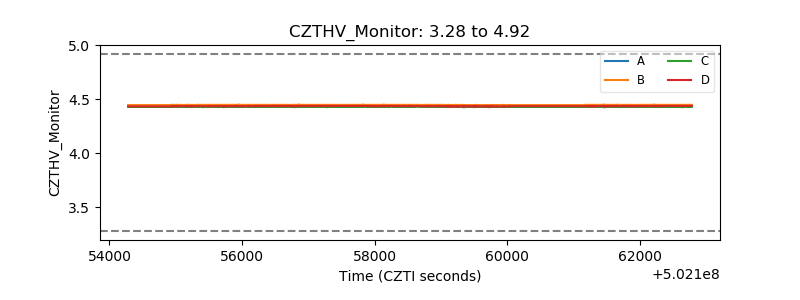 |
| D_VDD | 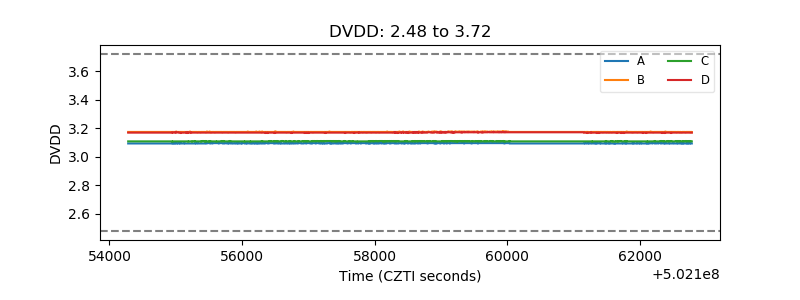 |
| Temperature 1 | 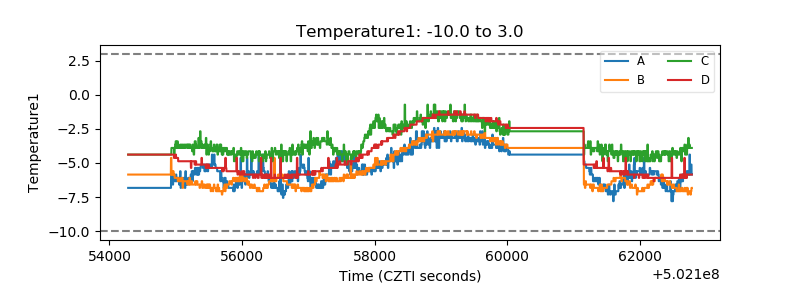 |
| Veto HV Monitor | 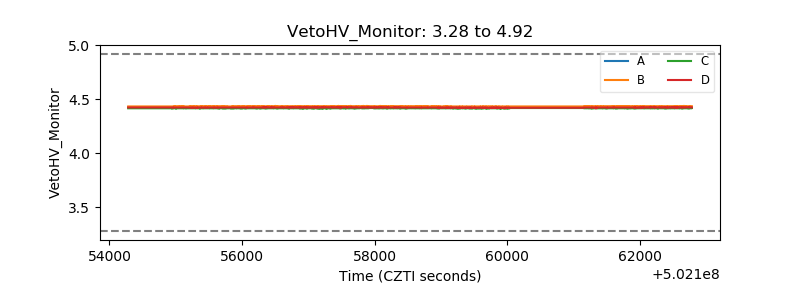 |
| Veto LLD | 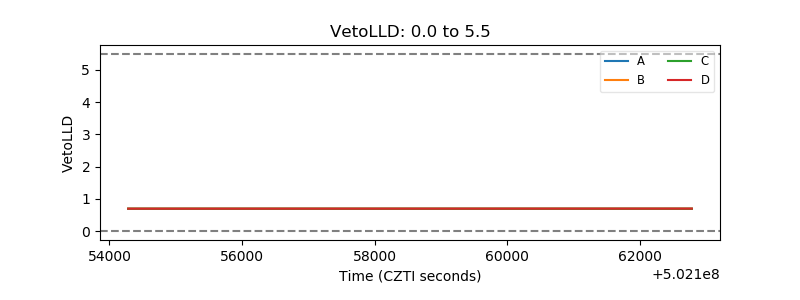 |
| Alpha Counter | 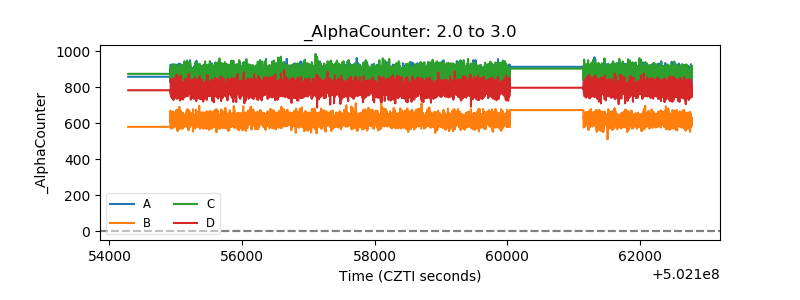 |
| _CPM_Rate | 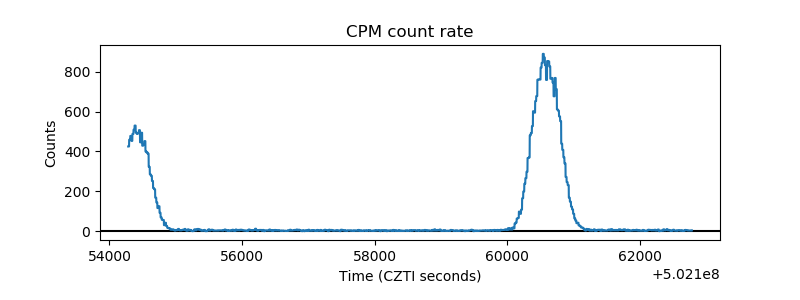 |
| CZT Counter | 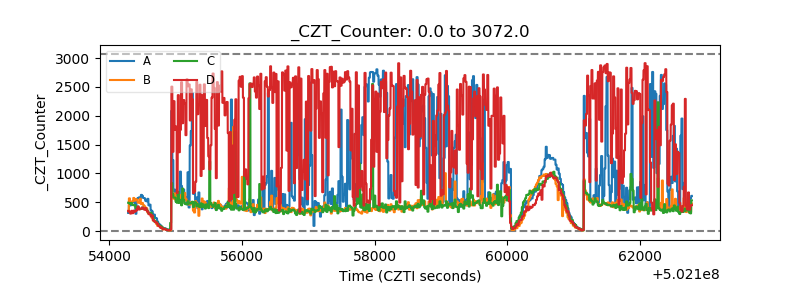 |
| +2.5 Volts monitor |  |
| +5 Volts monitor |  |
| _ROLL_ROT | 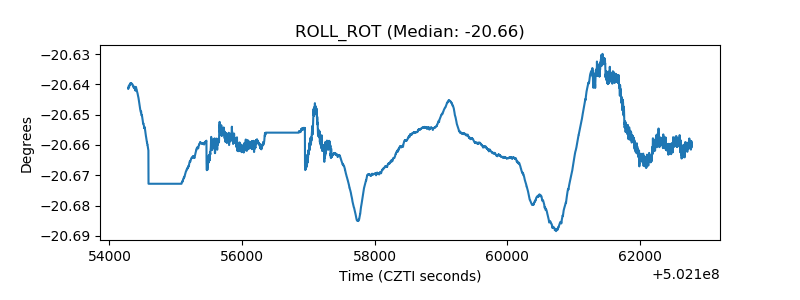 |
| _Roll_DEC | 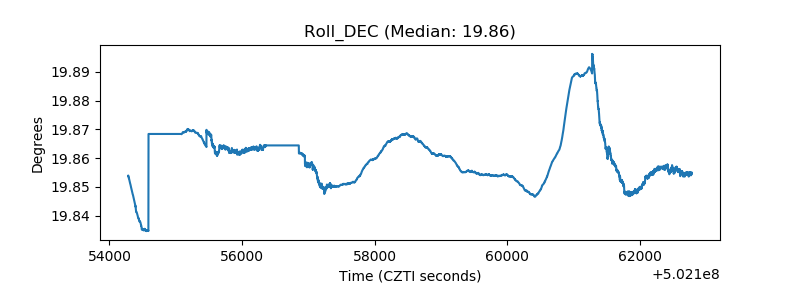 |
| _Roll_RA | 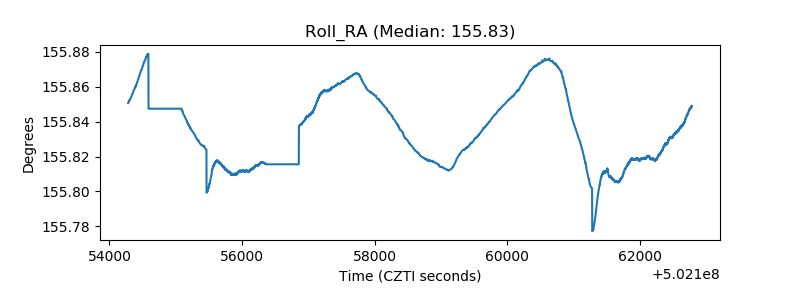 |
| Veto Counter | 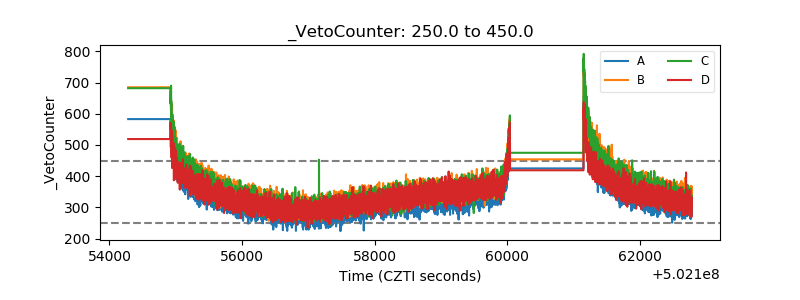 |