| Param | Original file | Final file |
|---|---|---|
| Filename | modeM0/AS1A14_025T01_9000006530_55038cztM0_level2.fits | modeM0/AS1A14_025T01_9000006530_55038cztM0_level2_quad_clean.evt |
| Size (bytes) | 715,432,320 | 88,859,520 |
| Size | 682.3 MB | 84.7 MB |
| Events in quadrant A | 6,574,263 | 600,787 |
| Events in quadrant B | 3,192,286 | 725,633 |
| Events in quadrant C | 3,075,976 | 638,027 |
| Events in quadrant D | 13,121,073 | 258,881 |
| Mode M0 | |||
|---|---|---|---|
| Quadrant | BADHDUFLAG | Total packets | Discarded packets |
| A | 0 | 24242 | 16 |
| B | 0 | 14350 | 7 |
| C | 0 | 14230 | 6 |
| D | 0 | 43626 | 44 |
| Mode SS | |||
|---|---|---|---|
| Quadrant | BADHDUFLAG | Total packets | Discarded packets |
| A | 0 | 138 | 0 |
| B | 0 | 138 | 0 |
| C | 0 | 138 | 0 |
| D | 0 | 138 | 0 |
| Mode M9 | |||
|---|---|---|---|
| Quadrant | BADHDUFLAG | Total packets | Discarded packets |
| A | 0 | 14 | 0 |
| B | 0 | 14 | 0 |
| C | 0 | 14 | 0 |
| D | 0 | 15 | 0 |
| Quadrant | Total seconds | Saturated seconds | Saturation percentage |
|---|---|---|---|
| A | 6692 | 831 | 12.417812% |
| B | 6694 | 73 | 1.090529% |
| C | 6694 | 48 | 0.717060% |
| D | 6690 | 4046 | 60.478326% |
Noise dominated data is calculated using 1-second bins in cleaned event files. If a bin has >2000 counts, and if more than 50% of those come from <1% of pixels, then it is considered to be noise-dominated and hence unusable.
| Quadrant | # 1 sec bins | Bins with >0 counts | Bins with >2000 counts | High rate bins dominated by noise | Noise dominated (total time) | Noise dominated (detector-on time) | Marked lightcurve |
|---|---|---|---|---|---|---|---|
| A | 7841 | 6697 | 687 | 687 | 8.76% | 10.26% | 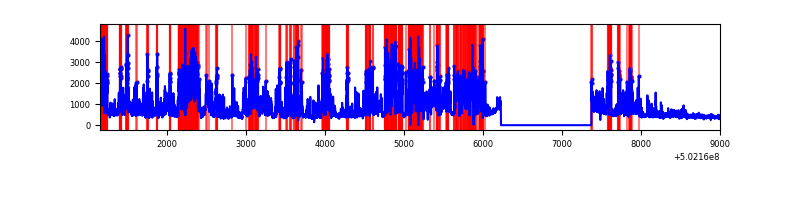 |
| B | 7841 | 6697 | 12 | 12 | 0.15% | 0.18% | 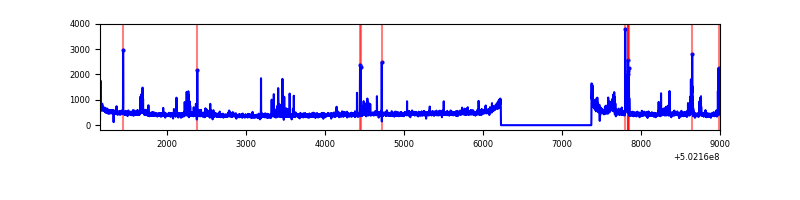 |
| C | 7841 | 6697 | 26 | 26 | 0.33% | 0.39% | 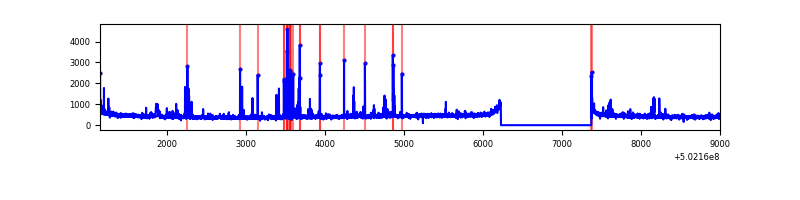 |
| D | 7840 | 6693 | 3367 | 3367 | 42.95% | 50.31% | 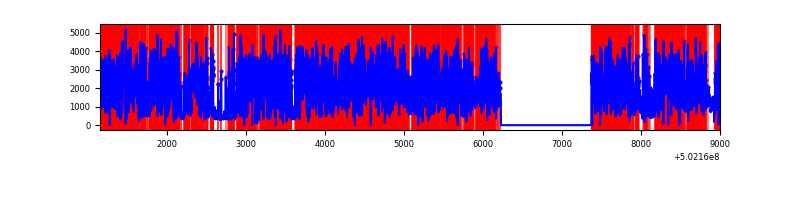 |
Top three noisy pixels from each quadrant. If the there are fewer than three noisy pixels in the level2.evt file, extra rows are filled as -1
| Pixel properties | Quadrant properties | ||||||
|---|---|---|---|---|---|---|---|
| Quadrant | DetID | PixID | Counts | Sigma | Mean | Median | Sigma |
| A | 15 | 32 | 3654340 | 20931.63 | 698 | 681 | 174.6 |
| A | 0 | 8 | 138705 | 790.73 | 698 | 681 | 174.6 |
| A | 3 | 45 | 25710 | 143.39 | 698 | 681 | 174.6 |
| B | 5 | 236 | 122975 | 784.42 | 728 | 701 | 155.9 |
| B | 5 | 185 | 85397 | 543.34 | 728 | 701 | 155.9 |
| B | 10 | 247 | 72710 | 461.95 | 728 | 701 | 155.9 |
| C | 6 | 223 | 83880 | 423.81 | 712 | 708 | 196.2 |
| C | 12 | 252 | 63436 | 319.64 | 712 | 708 | 196.2 |
| C | 13 | 3 | 51894 | 260.82 | 712 | 708 | 196.2 |
| D | 11 | 129 | 5563693 | 41845.93 | 460 | 438 | 132.9 |
| D | 15 | 94 | 4702576 | 35368.74 | 460 | 438 | 132.9 |
| D | 10 | 181 | 330707 | 2484.23 | 460 | 438 | 132.9 |
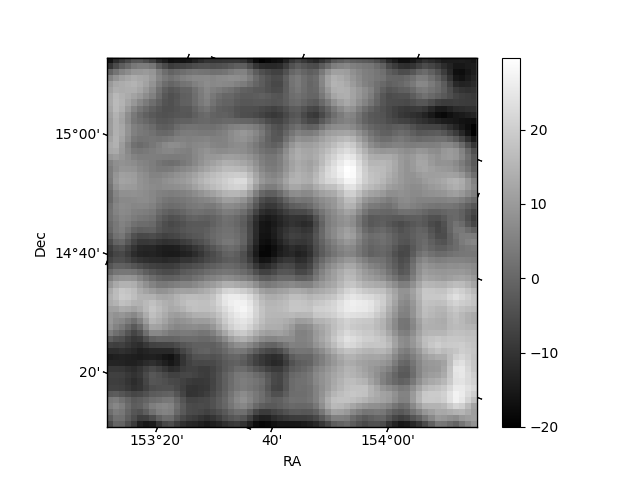
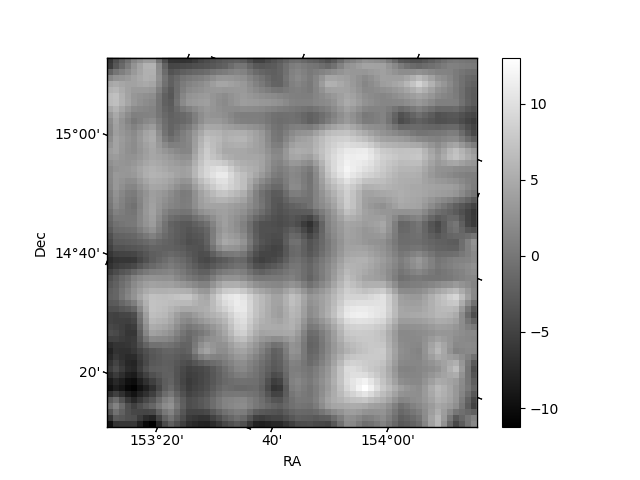
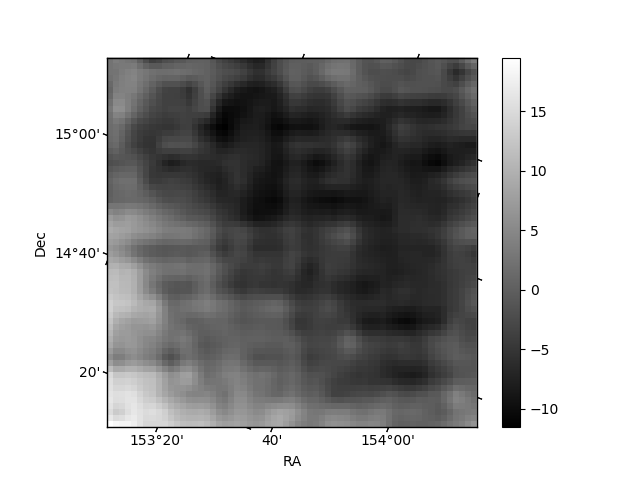
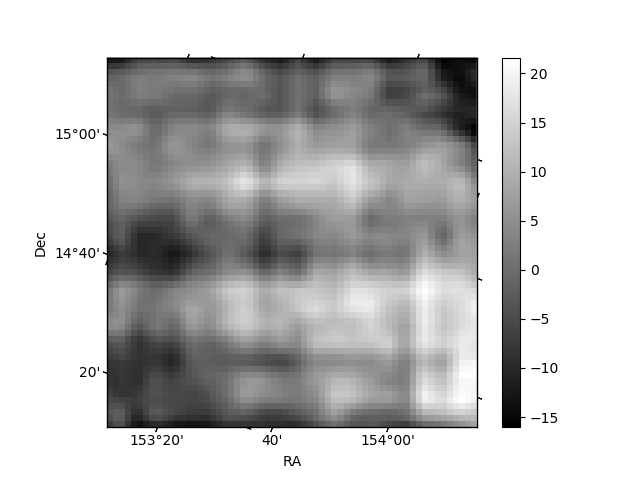
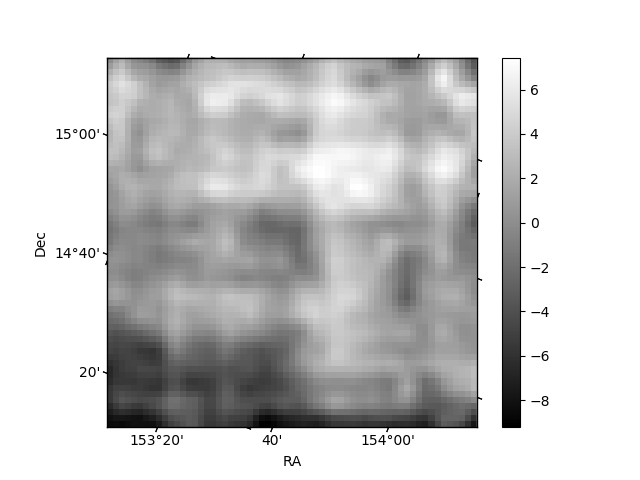
Histogram calculated using DETX and DETY for each event in the final _common_clean file
| Quadrant A | 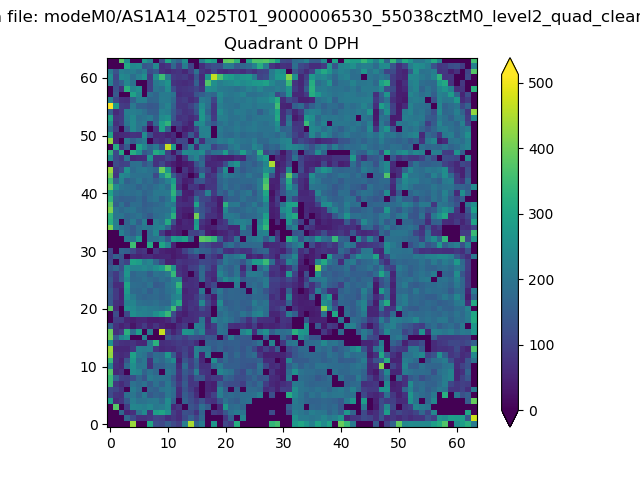 |
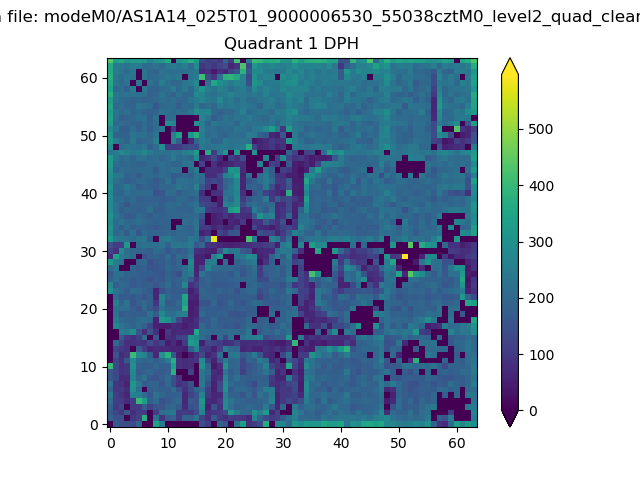 |
Quadrant B |
|---|---|---|---|
| Quadrant D | 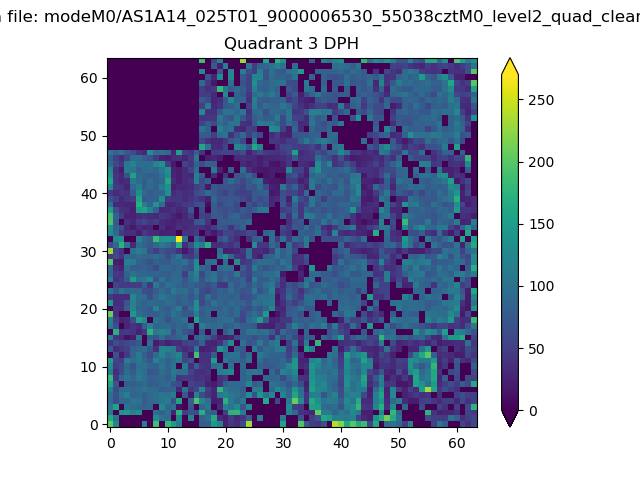 |
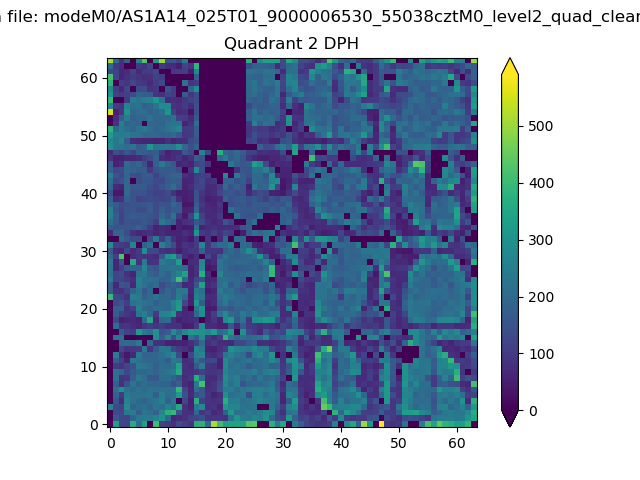 |
Quadrant C |
| Plot type | Count rate plots | Images |
|---|---|---|
| Comparison with Poisson distribution Blue bars denote a histogram of data divided into 1 sec bins. Red curve is a Poisson curve with rate = median count rate of data. |
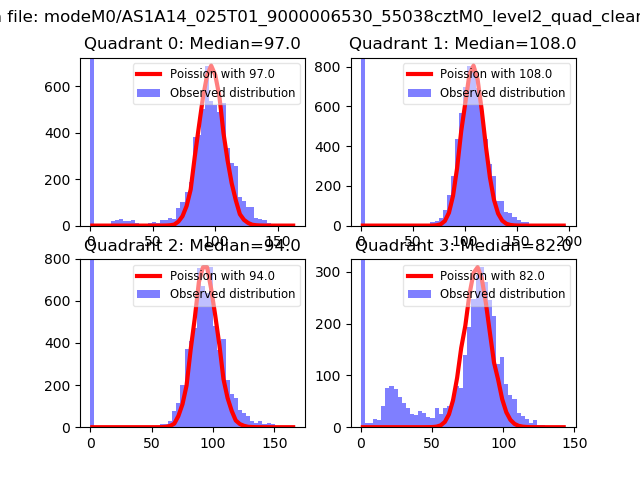 |
 |
| Quadrant-wise count rates Data is divided into 100 sec bins |
 |
|
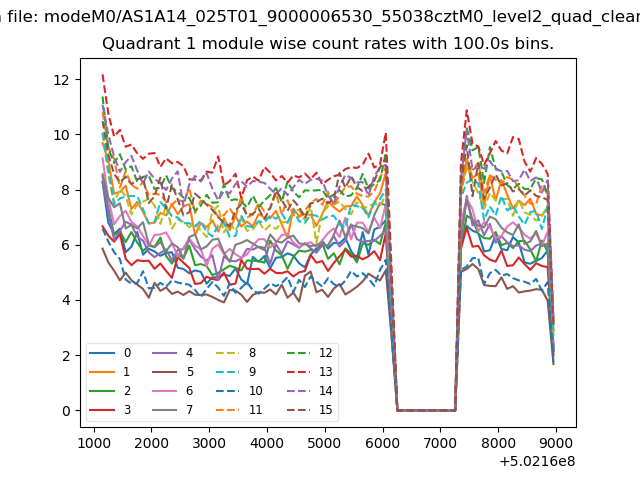
| Module-wise count rates for Quadrant A Data is divided into 100 sec bins |
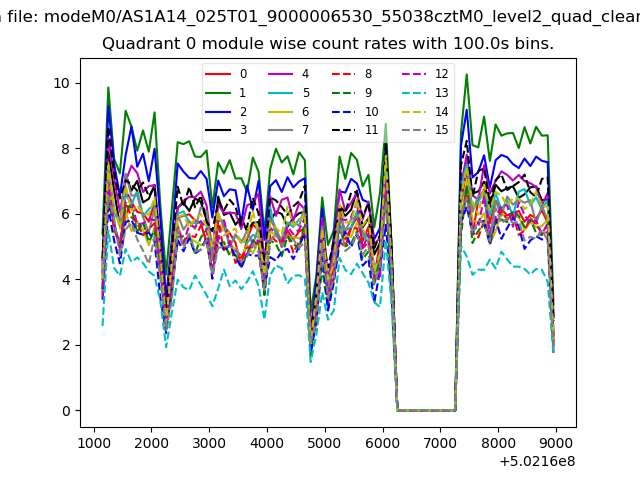 |
 |
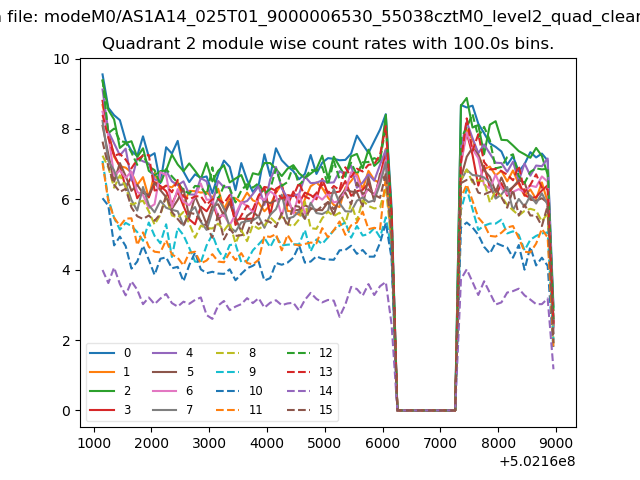
| Module-wise count rates for Quadrant B Data is divided into 100 sec bins |
 |
 |
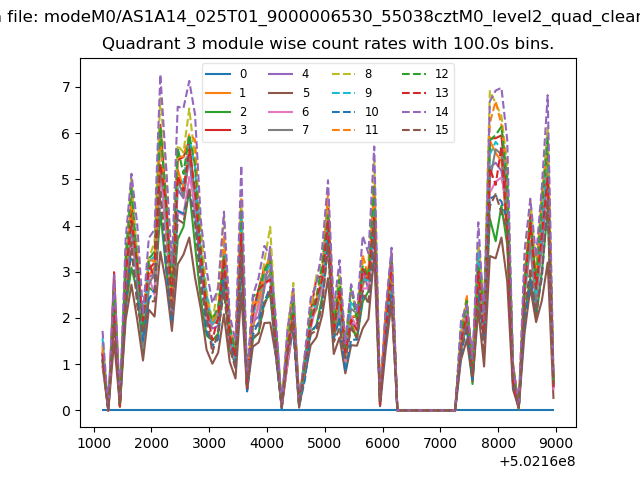
| Module-wise count rates for Quadrant C Data is divided into 100 sec bins |
 |
 |
| Module-wise count rates for Quadrant D Data is divided into 100 sec bins |
 |
 |
| Parameter | Plot |
|---|---|
| CZT HV Monitor | 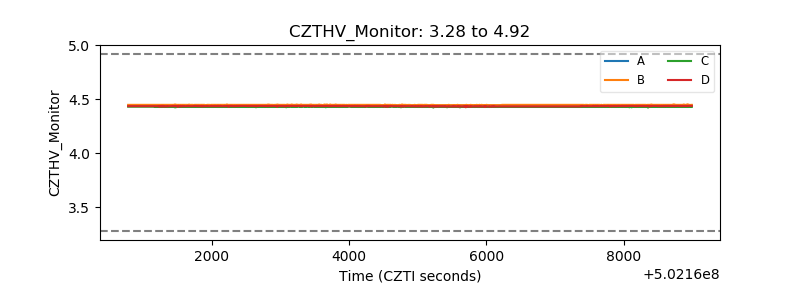 |
| D_VDD | 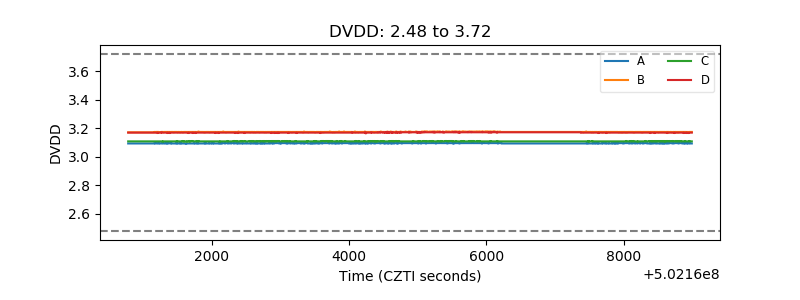 |
| Temperature 1 | 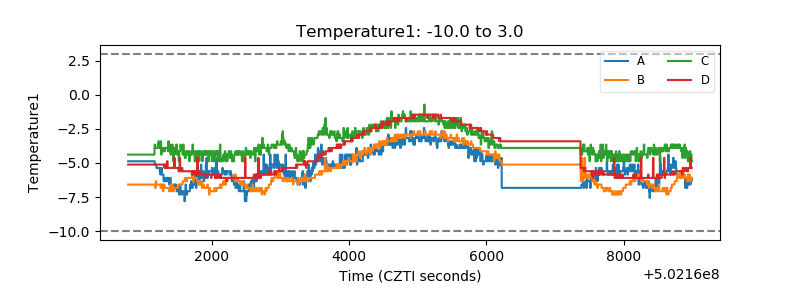 |
| Veto HV Monitor |  |
| Veto LLD |  |
| Alpha Counter |  |
| _CPM_Rate | 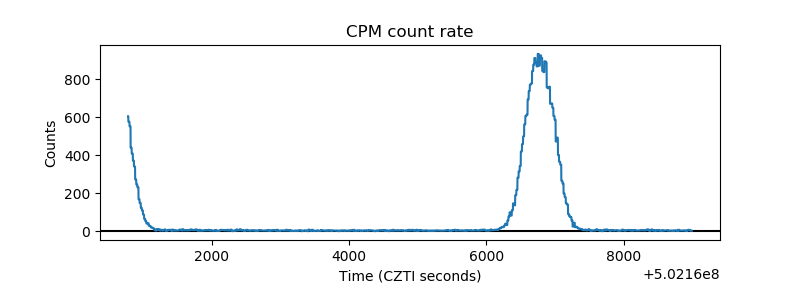 |
| CZT Counter | 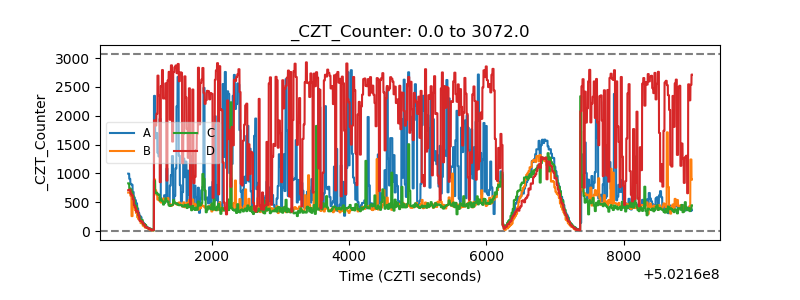 |
| +2.5 Volts monitor |  |
| +5 Volts monitor |  |
| _ROLL_ROT | 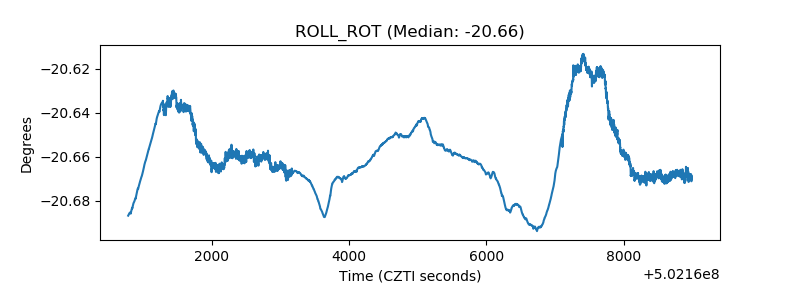 |
| _Roll_DEC | 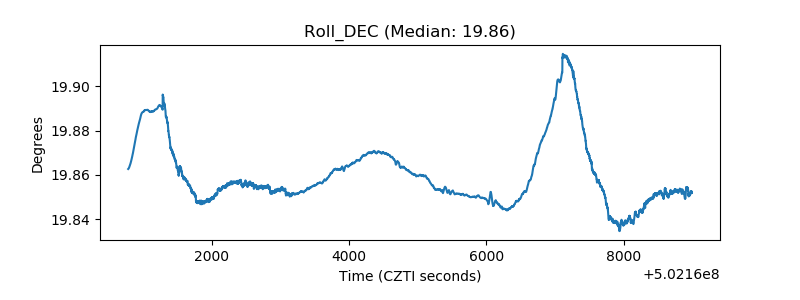 |
| _Roll_RA | 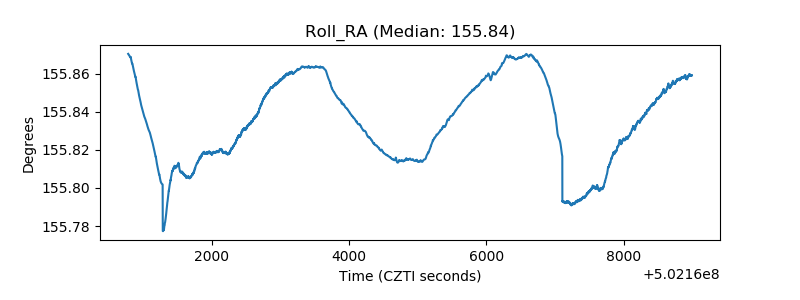 |
| Veto Counter | 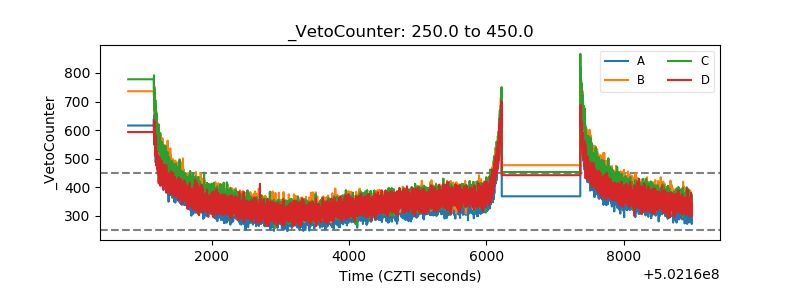 |