| Param | Original file | Final file |
|---|---|---|
| Filename | modeM0/AS1A14_025T01_9000006530_55039cztM0_level2.fits | modeM0/AS1A14_025T01_9000006530_55039cztM0_level2_quad_clean.evt |
| Size (bytes) | 703,719,360 | 87,059,520 |
| Size | 671.1 MB | 83.0 MB |
| Events in quadrant A | 4,083,453 | 657,152 |
| Events in quadrant B | 3,604,676 | 722,812 |
| Events in quadrant C | 3,239,761 | 641,399 |
| Events in quadrant D | 14,603,755 | 150,329 |
| Mode M0 | |||
|---|---|---|---|
| Quadrant | BADHDUFLAG | Total packets | Discarded packets |
| A | 0 | 16840 | 3 |
| B | 0 | 15283 | 1 |
| C | 0 | 14549 | 1 |
| D | 0 | 47905 | 1 |
| Mode SS | |||
|---|---|---|---|
| Quadrant | BADHDUFLAG | Total packets | Discarded packets |
| A | 0 | 136 | 0 |
| B | 0 | 136 | 0 |
| C | 0 | 136 | 0 |
| D | 0 | 136 | 0 |
| Mode M9 | |||
|---|---|---|---|
| Quadrant | BADHDUFLAG | Total packets | Discarded packets |
| A | 0 | 11 | 0 |
| B | 0 | 11 | 0 |
| C | 0 | 11 | 0 |
| D | 0 | 11 | 0 |
| Quadrant | Total seconds | Saturated seconds | Saturation percentage |
|---|---|---|---|
| A | 6658 | 180 | 2.703515% |
| B | 6659 | 110 | 1.651900% |
| C | 6659 | 58 | 0.871002% |
| D | 6660 | 5187 | 77.882883% |
Noise dominated data is calculated using 1-second bins in cleaned event files. If a bin has >2000 counts, and if more than 50% of those come from <1% of pixels, then it is considered to be noise-dominated and hence unusable.
| Quadrant | # 1 sec bins | Bins with >0 counts | Bins with >2000 counts | High rate bins dominated by noise | Noise dominated (total time) | Noise dominated (detector-on time) | Marked lightcurve |
|---|---|---|---|---|---|---|---|
| A | 7794 | 6660 | 112 | 112 | 1.44% | 1.68% | 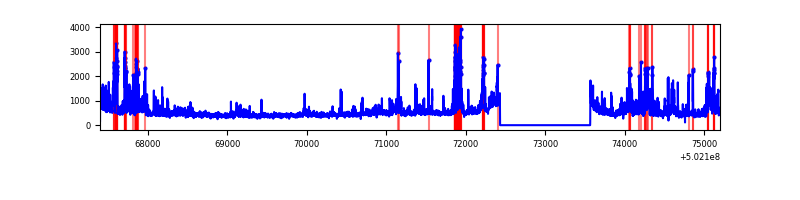 |
| B | 7794 | 6660 | 28 | 28 | 0.36% | 0.42% | 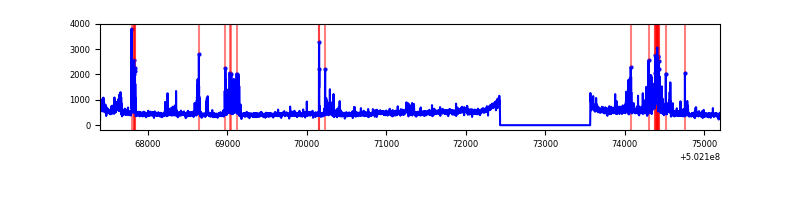 |
| C | 7794 | 6660 | 33 | 33 | 0.42% | 0.50% | 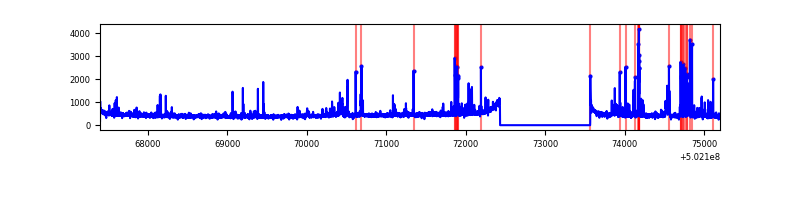 |
| D | 7794 | 6657 | 4278 | 4278 | 54.89% | 64.26% | 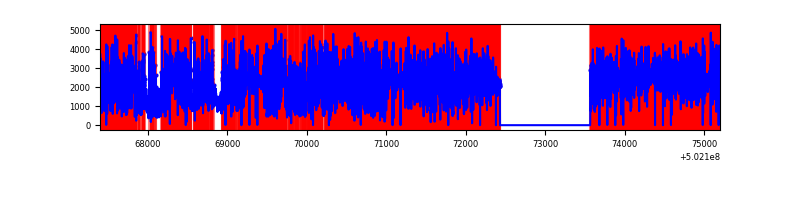 |
Top three noisy pixels from each quadrant. If the there are fewer than three noisy pixels in the level2.evt file, extra rows are filled as -1
| Pixel properties | Quadrant properties | ||||||
|---|---|---|---|---|---|---|---|
| Quadrant | DetID | PixID | Counts | Sigma | Mean | Median | Sigma |
| A | 15 | 32 | 1010003 | 5578.69 | 731 | 712 | 180.9 |
| A | 0 | 8 | 148601 | 817.43 | 731 | 712 | 180.9 |
| A | 3 | 95 | 38725 | 210.11 | 731 | 712 | 180.9 |
| B | 5 | 236 | 263611 | 1677.07 | 731 | 703 | 156.8 |
| B | 4 | 81 | 211997 | 1347.83 | 731 | 703 | 156.8 |
| B | 5 | 185 | 166151 | 1055.38 | 731 | 703 | 156.8 |
| C | 13 | 3 | 134449 | 677.82 | 716 | 711 | 197.3 |
| C | 12 | 252 | 91937 | 462.36 | 716 | 711 | 197.3 |
| C | 7 | 220 | 65642 | 329.09 | 716 | 711 | 197.3 |
| D | 15 | 94 | 6573037 | 64331.26 | 354 | 337 | 102.2 |
| D | 11 | 129 | 5196002 | 50853.33 | 354 | 337 | 102.2 |
| D | 15 | 93 | 459479 | 4493.92 | 354 | 337 | 102.2 |
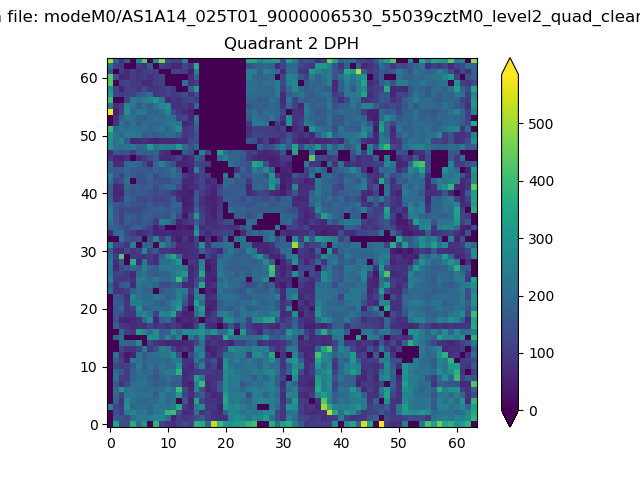
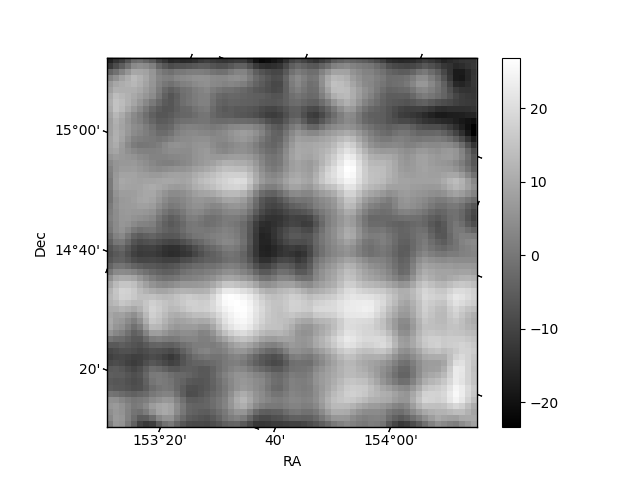
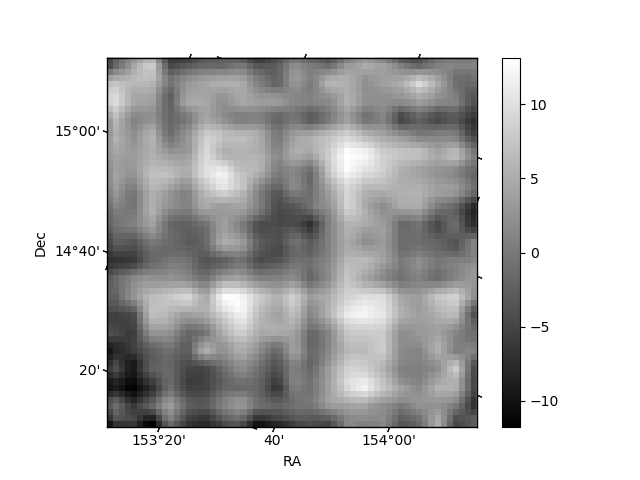
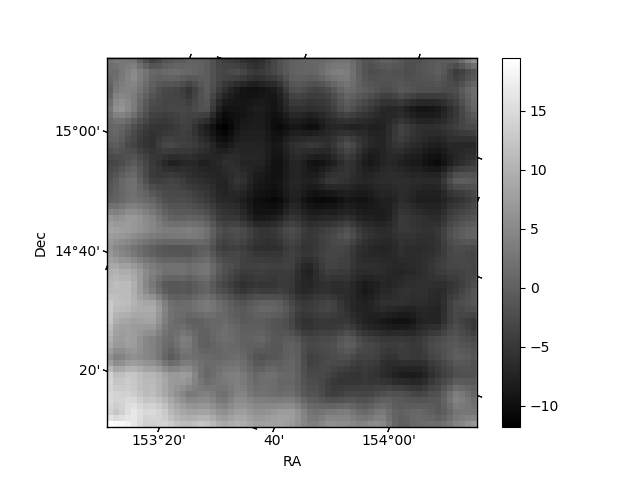
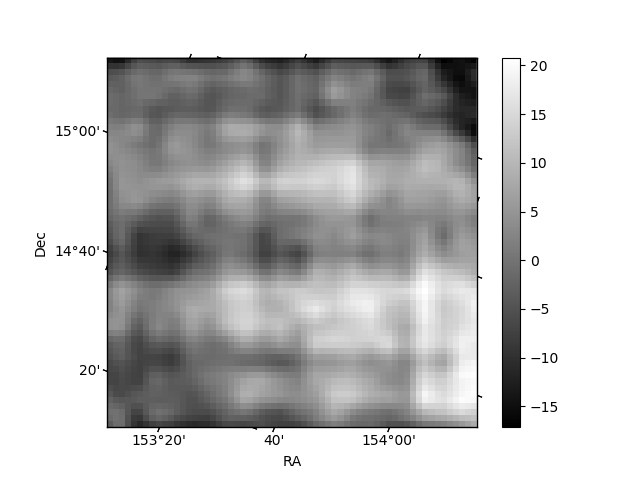
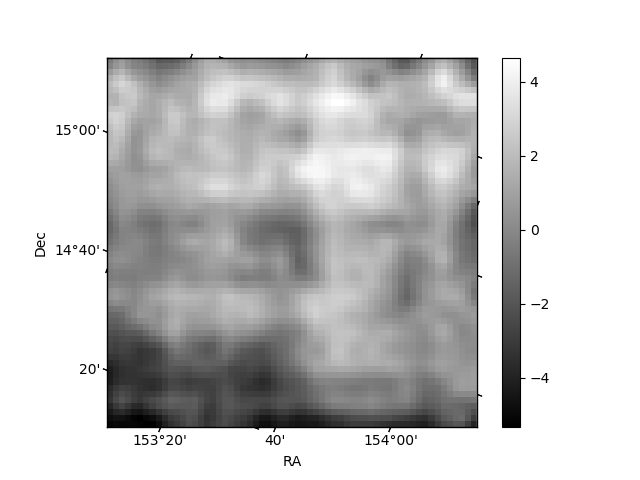
Histogram calculated using DETX and DETY for each event in the final _common_clean file
| Quadrant A | 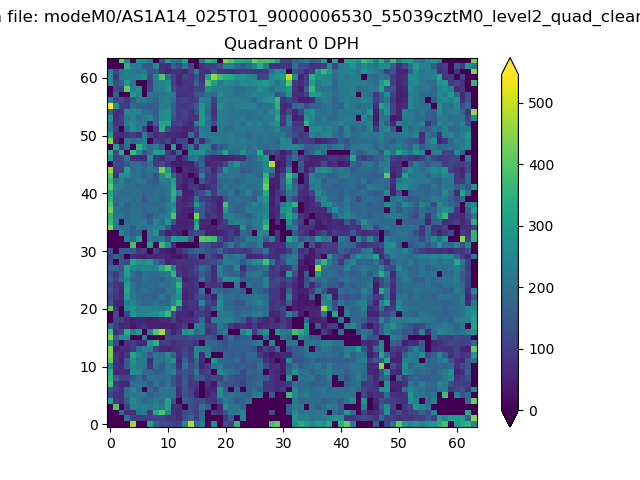 |
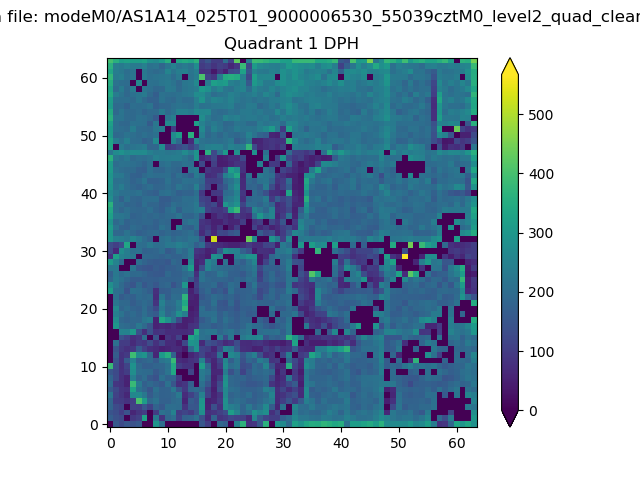 |
Quadrant B |
|---|---|---|---|
| Quadrant D | 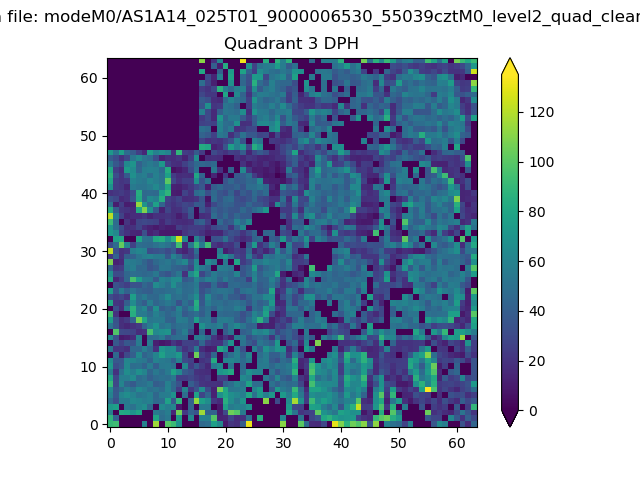 |
 |
Quadrant C |
| Plot type | Count rate plots | Images |
|---|---|---|
| Comparison with Poisson distribution Blue bars denote a histogram of data divided into 1 sec bins. Red curve is a Poisson curve with rate = median count rate of data. |
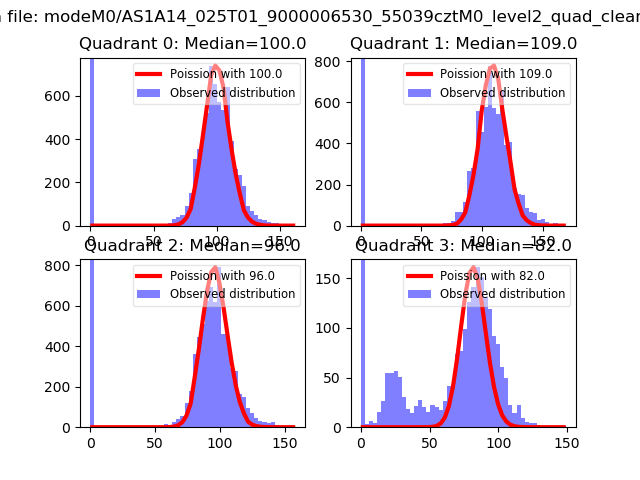 |
 |
| Quadrant-wise count rates Data is divided into 100 sec bins |
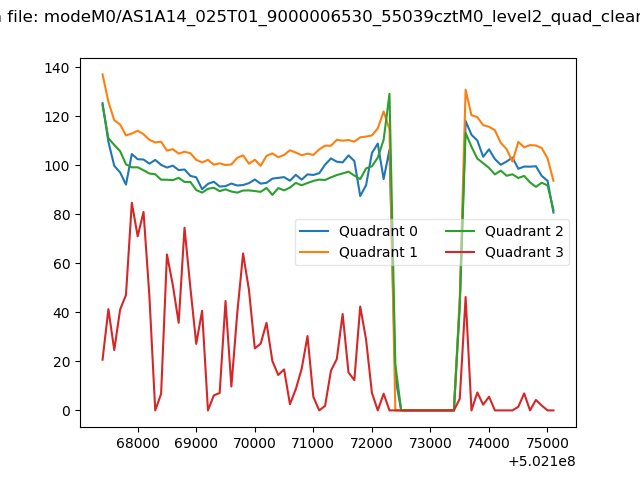 |
|
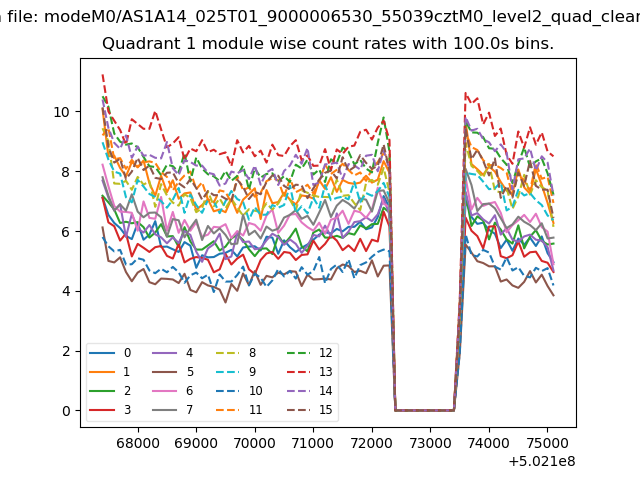
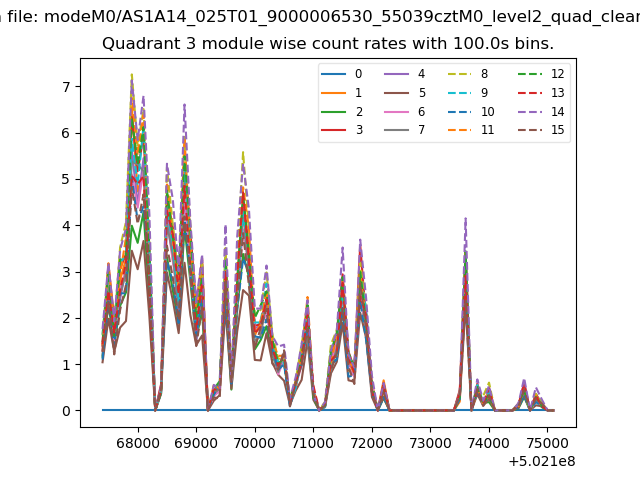
| Module-wise count rates for Quadrant A Data is divided into 100 sec bins |
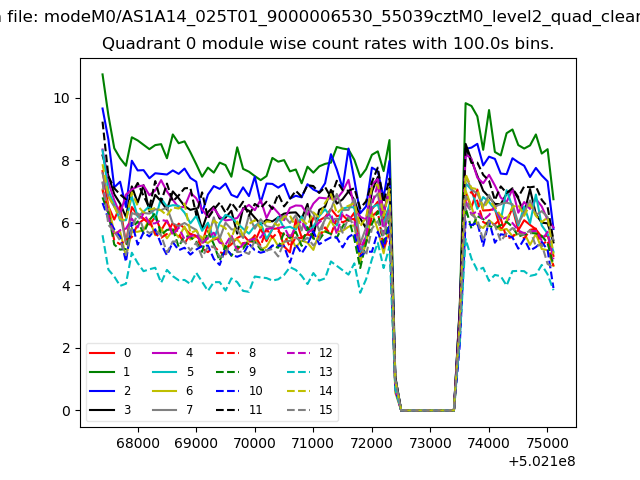 |
 |
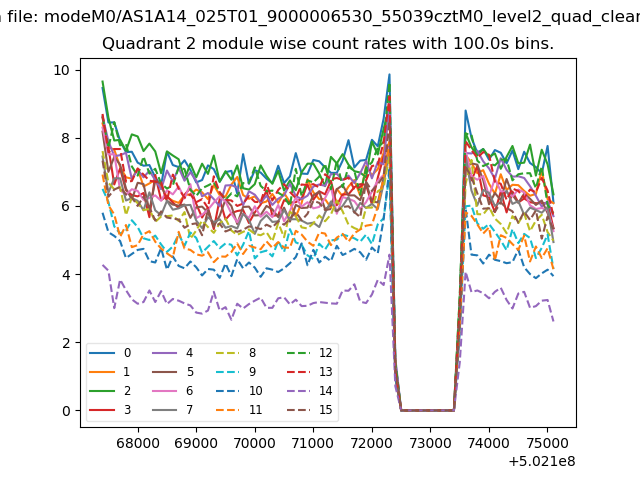
| Module-wise count rates for Quadrant B Data is divided into 100 sec bins |
 |
 |
| Module-wise count rates for Quadrant C Data is divided into 100 sec bins |
 |
 |
| Module-wise count rates for Quadrant D Data is divided into 100 sec bins |
 |
 |
| Parameter | Plot |
|---|---|
| CZT HV Monitor | 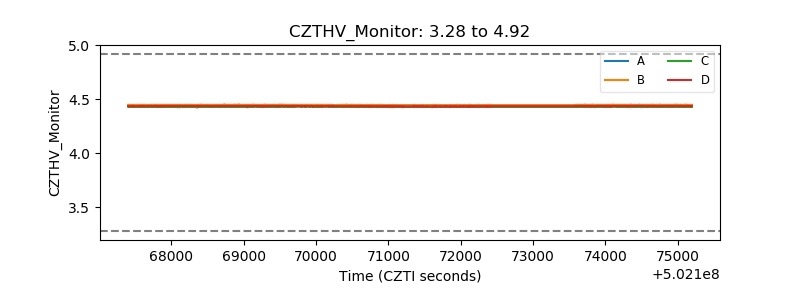 |
| D_VDD | 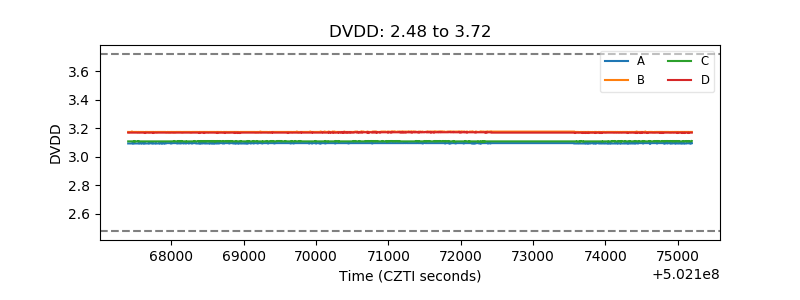 |
| Temperature 1 | 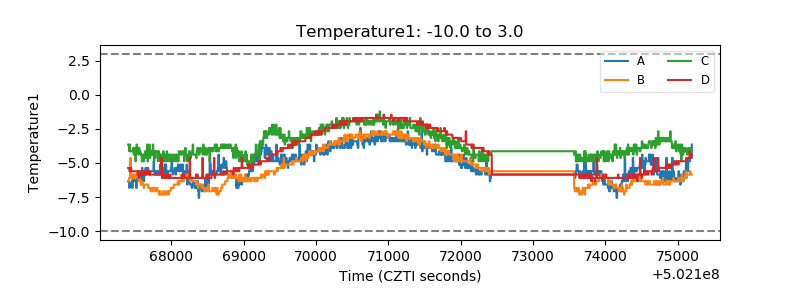 |
| Veto HV Monitor |  |
| Veto LLD | 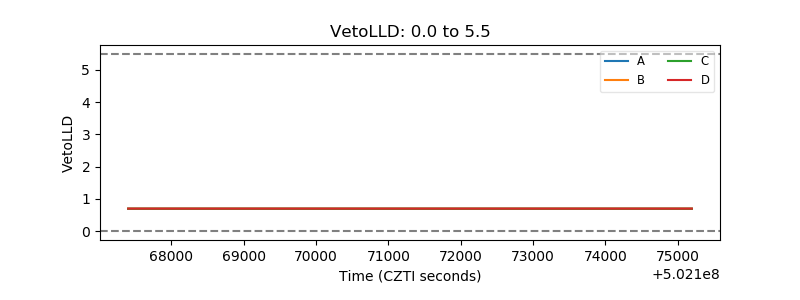 |
| Alpha Counter |  |
| _CPM_Rate |  |
| CZT Counter | 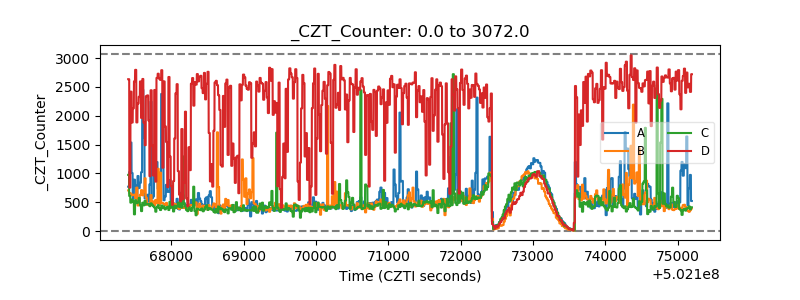 |
| +2.5 Volts monitor |  |
| +5 Volts monitor |  |
| _ROLL_ROT | 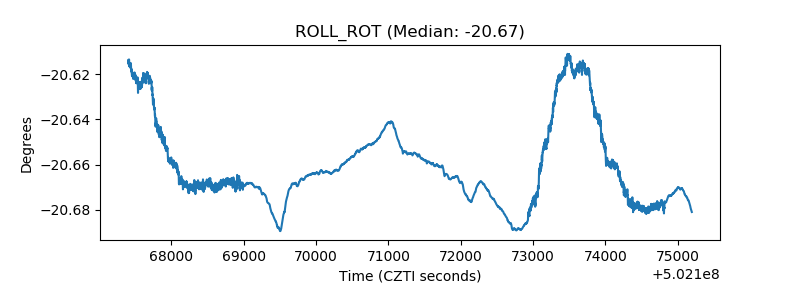 |
| _Roll_DEC | 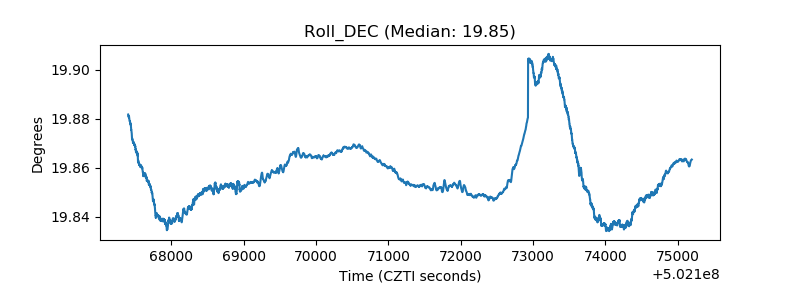 |
| _Roll_RA | 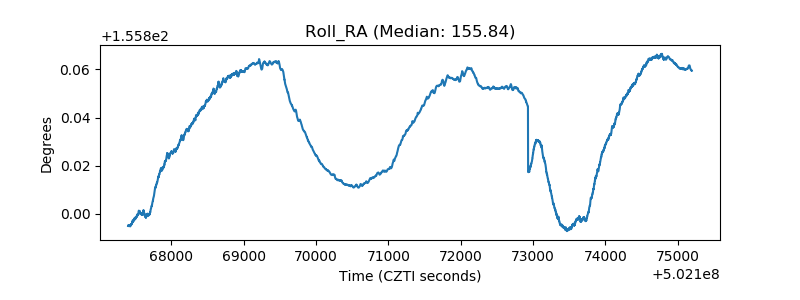 |
| Veto Counter | 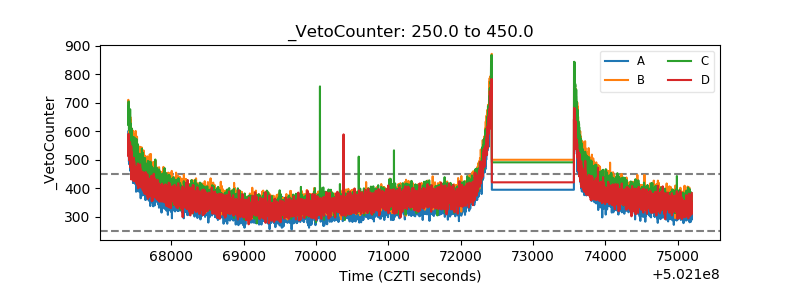 |