| Param | Original file | Final file |
|---|---|---|
| Filename | modeM0/AS1A14_025T01_9000006530_55040cztM0_level2.fits | modeM0/AS1A14_025T01_9000006530_55040cztM0_level2_quad_clean.evt |
| Size (bytes) | 690,793,920 | 72,593,280 |
| Size | 658.8 MB | 69.2 MB |
| Events in quadrant A | 5,327,359 | 530,318 |
| Events in quadrant B | 3,007,427 | 633,854 |
| Events in quadrant C | 2,971,089 | 557,418 |
| Events in quadrant D | 13,801,751 | 60,507 |
| Mode M0 | |||
|---|---|---|---|
| Quadrant | BADHDUFLAG | Total packets | Discarded packets |
| A | 0 | 19947 | 26 |
| B | 0 | 13302 | 5 |
| C | 0 | 13254 | 3 |
| D | 0 | 45138 | 71 |
| Mode SS | |||
|---|---|---|---|
| Quadrant | BADHDUFLAG | Total packets | Discarded packets |
| A | 0 | 120 | 0 |
| B | 0 | 120 | 0 |
| C | 0 | 120 | 0 |
| D | 0 | 120 | 0 |
| Mode M9 | |||
|---|---|---|---|
| Quadrant | BADHDUFLAG | Total packets | Discarded packets |
| A | 0 | 12 | 0 |
| B | 0 | 12 | 0 |
| C | 0 | 12 | 0 |
| D | 0 | 12 | 0 |
| Quadrant | Total seconds | Saturated seconds | Saturation percentage |
|---|---|---|---|
| A | 5957 | 656 | 11.012254% |
| B | 5960 | 103 | 1.728188% |
| C | 5960 | 64 | 1.073826% |
| D | 5952 | 5360 | 90.053763% |
Noise dominated data is calculated using 1-second bins in cleaned event files. If a bin has >2000 counts, and if more than 50% of those come from <1% of pixels, then it is considered to be noise-dominated and hence unusable.
| Quadrant | # 1 sec bins | Bins with >0 counts | Bins with >2000 counts | High rate bins dominated by noise | Noise dominated (total time) | Noise dominated (detector-on time) | Marked lightcurve |
|---|---|---|---|---|---|---|---|
| A | 7102 | 5963 | 440 | 440 | 6.20% | 7.38% | 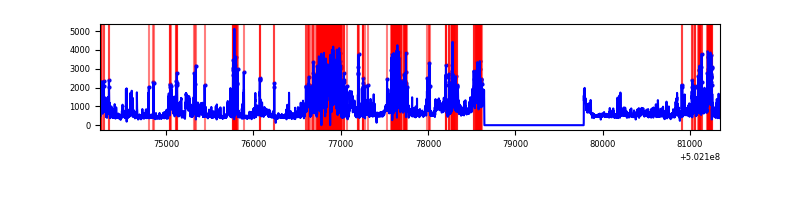 |
| B | 7102 | 5963 | 43 | 43 | 0.61% | 0.72% | 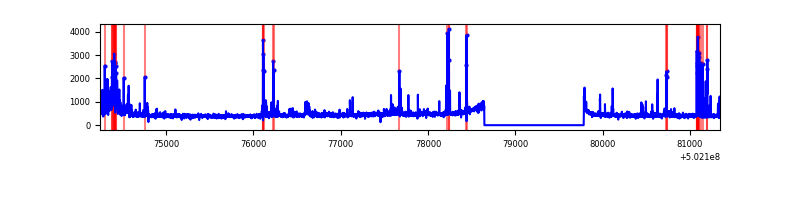 |
| C | 7101 | 5962 | 42 | 42 | 0.59% | 0.70% | 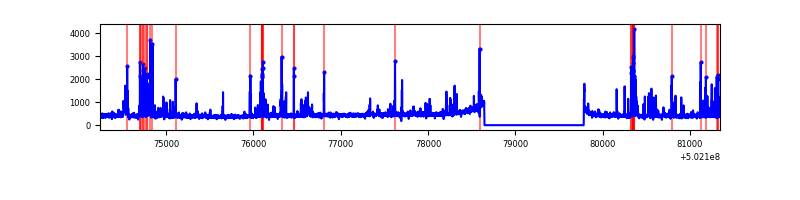 |
| D | 7101 | 5957 | 4394 | 4394 | 61.88% | 73.76% | 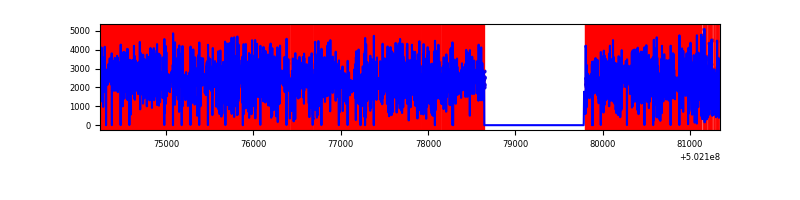 |
Top three noisy pixels from each quadrant. If the there are fewer than three noisy pixels in the level2.evt file, extra rows are filled as -1
| Pixel properties | Quadrant properties | ||||||
|---|---|---|---|---|---|---|---|
| Quadrant | DetID | PixID | Counts | Sigma | Mean | Median | Sigma |
| A | 15 | 32 | 1521511 | 9960.35 | 615 | 601 | 152.7 |
| A | 3 | 95 | 729788 | 4775.4 | 615 | 601 | 152.7 |
| A | 0 | 8 | 604258 | 3953.31 | 615 | 601 | 152.7 |
| B | 5 | 236 | 133245 | 946.64 | 644 | 619 | 140.1 |
| B | 4 | 81 | 122121 | 867.24 | 644 | 619 | 140.1 |
| B | 5 | 185 | 120570 | 856.17 | 644 | 619 | 140.1 |
| C | 13 | 3 | 176007 | 1001.28 | 633 | 628 | 175.2 |
| C | 6 | 223 | 128022 | 727.32 | 633 | 628 | 175.2 |
| C | 12 | 252 | 79074 | 447.87 | 633 | 628 | 175.2 |
| D | 15 | 94 | 9631263 | 133040.63 | 241 | 229 | 72.4 |
| D | 11 | 129 | 2058318 | 28429.91 | 241 | 229 | 72.4 |
| D | 15 | 93 | 428901 | 5921.56 | 241 | 229 | 72.4 |
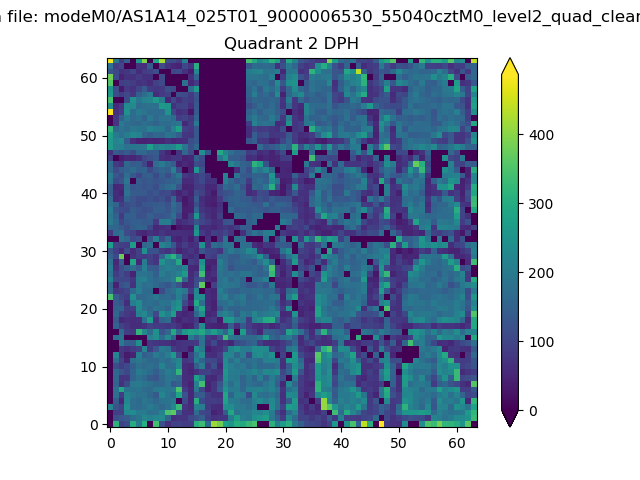
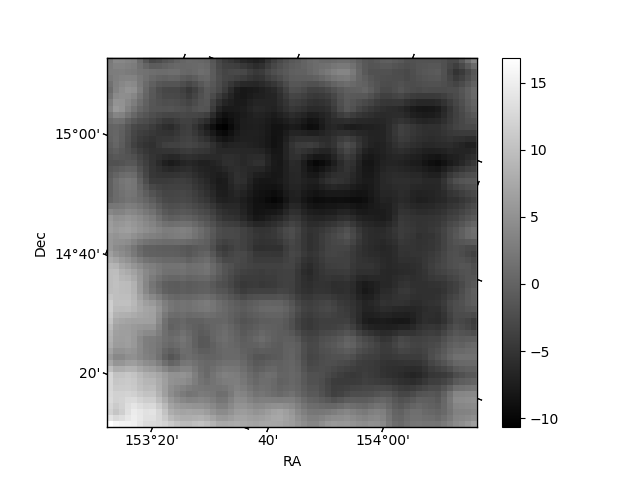
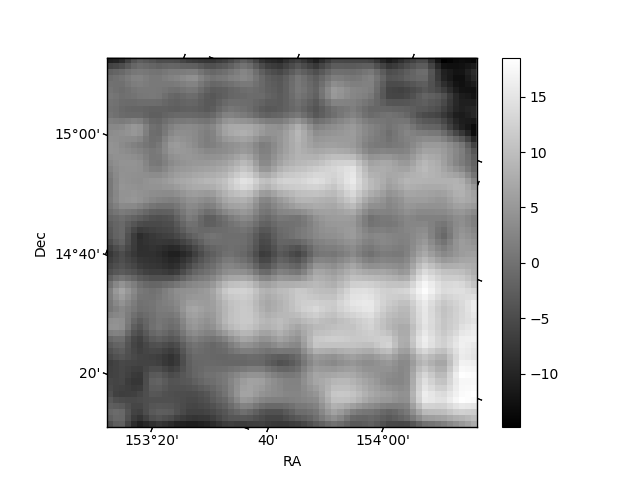
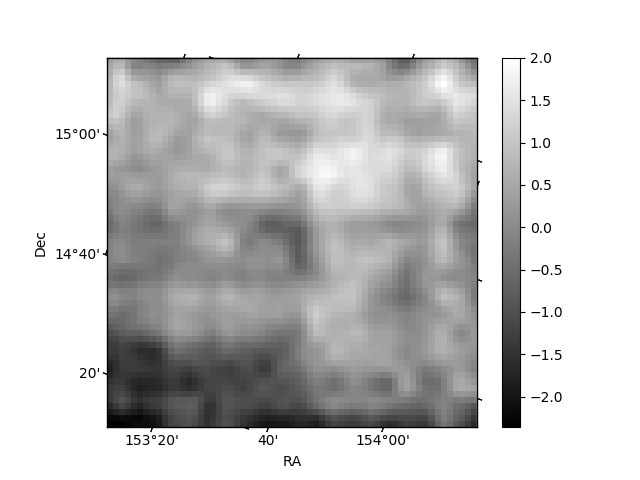
Histogram calculated using DETX and DETY for each event in the final _common_clean file
| Quadrant A | 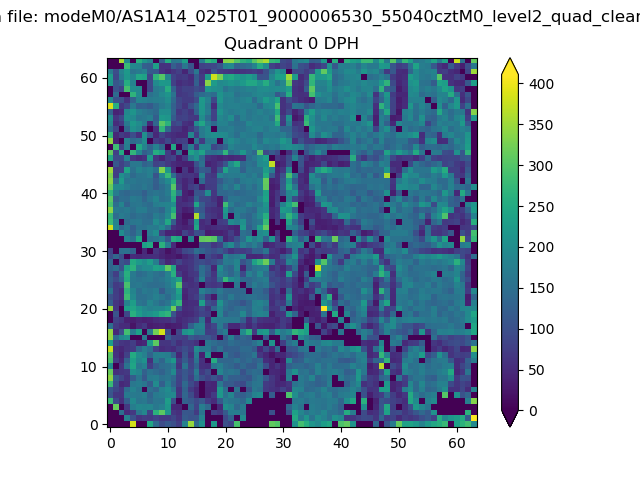 |
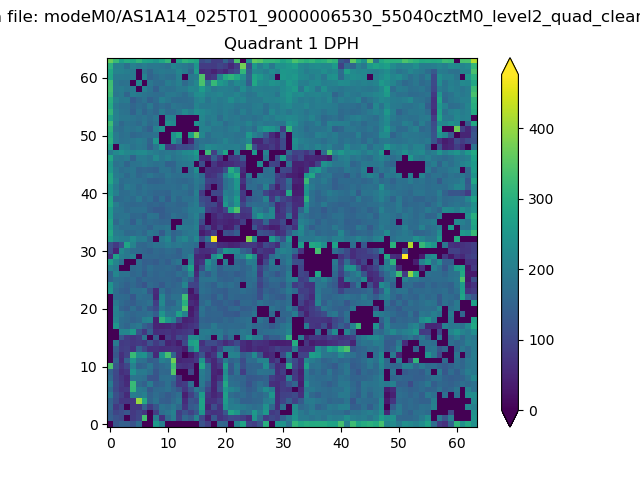 |
Quadrant B |
|---|---|---|---|
| Quadrant D | 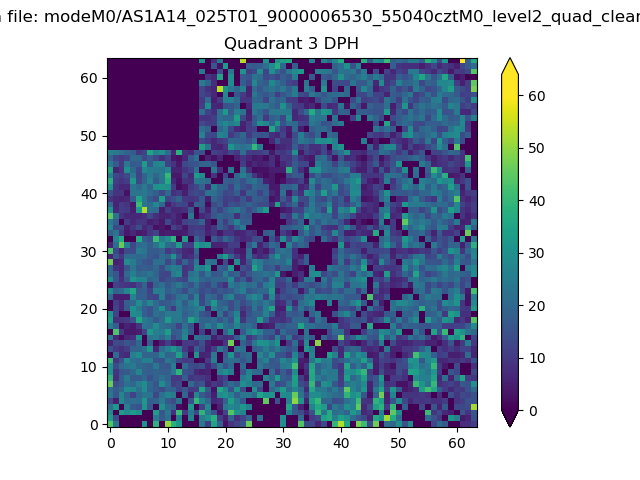 |
 |
Quadrant C |
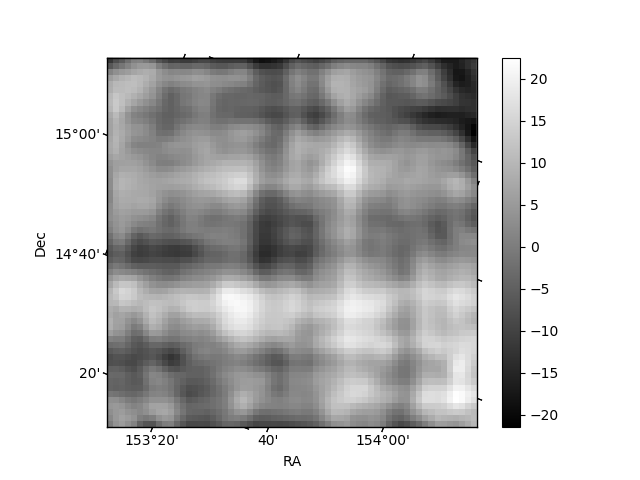
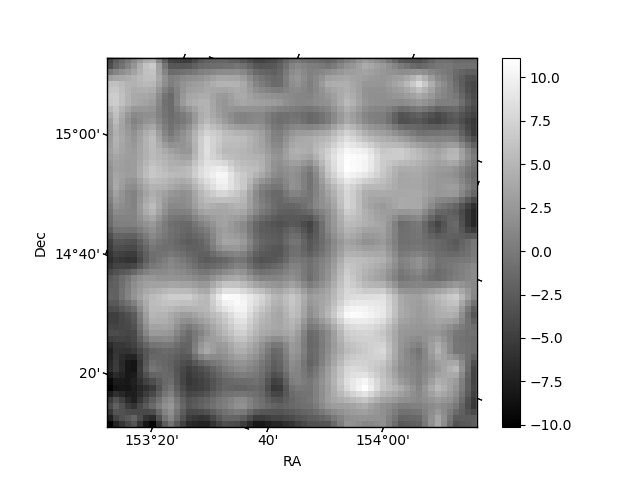
| Plot type | Count rate plots | Images |
|---|---|---|
| Comparison with Poisson distribution Blue bars denote a histogram of data divided into 1 sec bins. Red curve is a Poisson curve with rate = median count rate of data. |
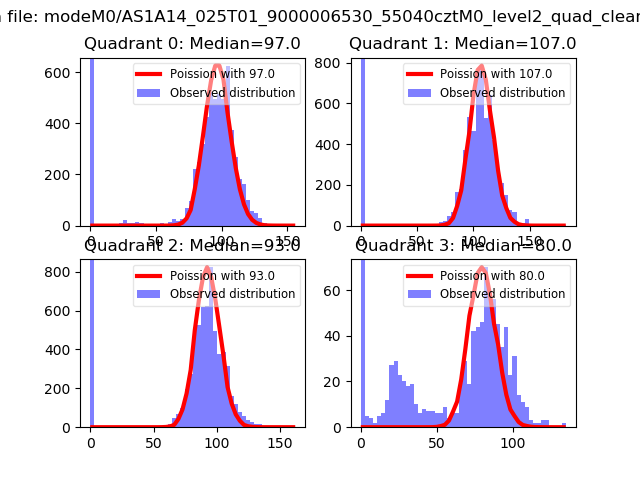 |
 |
| Quadrant-wise count rates Data is divided into 100 sec bins |
 |
|
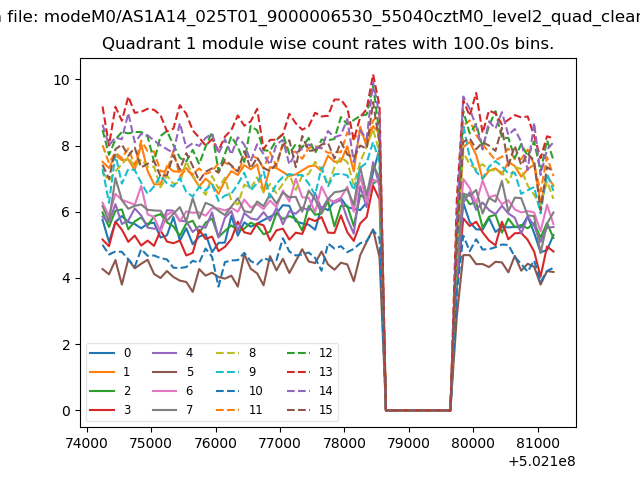
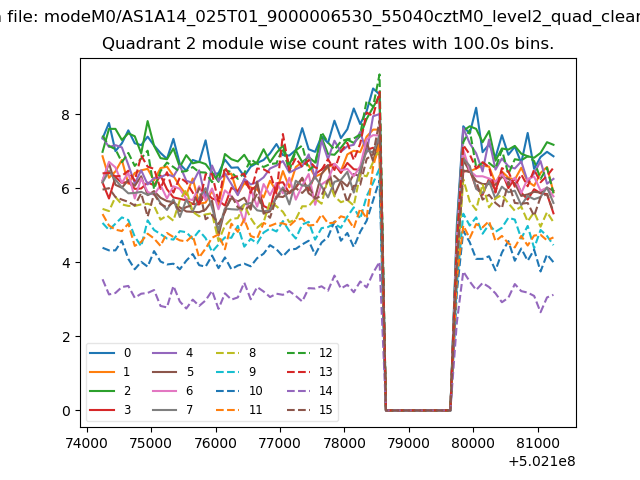
| Module-wise count rates for Quadrant A Data is divided into 100 sec bins |
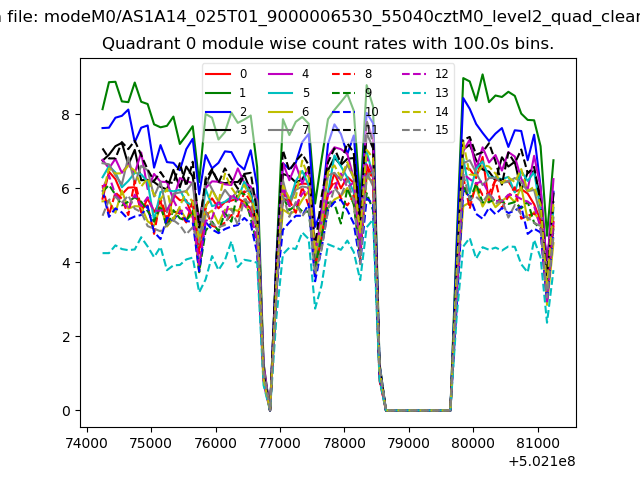 |
 |
| Module-wise count rates for Quadrant B Data is divided into 100 sec bins |
 |
 |
| Module-wise count rates for Quadrant C Data is divided into 100 sec bins |
 |
 |
| Module-wise count rates for Quadrant D Data is divided into 100 sec bins |
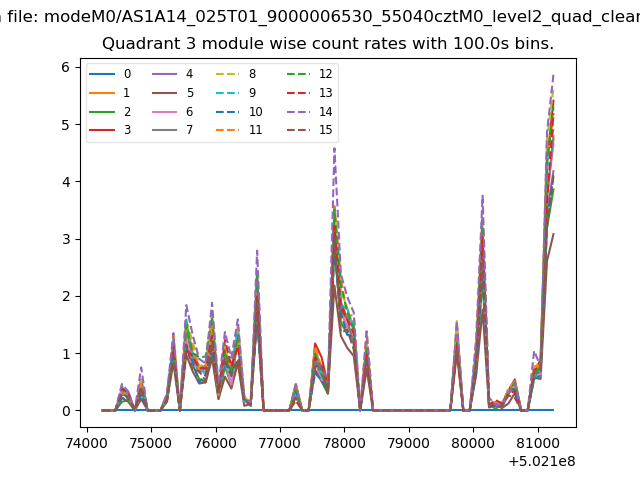 |
 |
| Parameter | Plot |
|---|---|
| CZT HV Monitor | 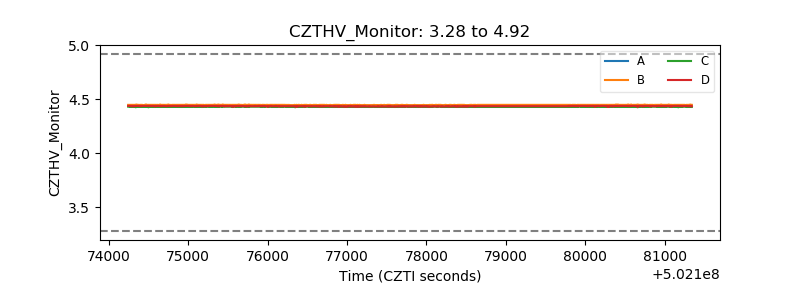 |
| D_VDD | 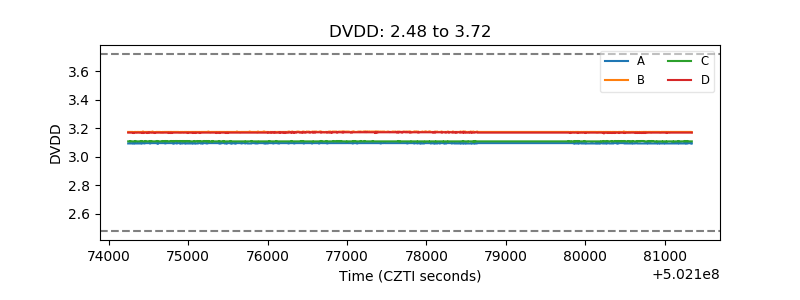 |
| Temperature 1 | 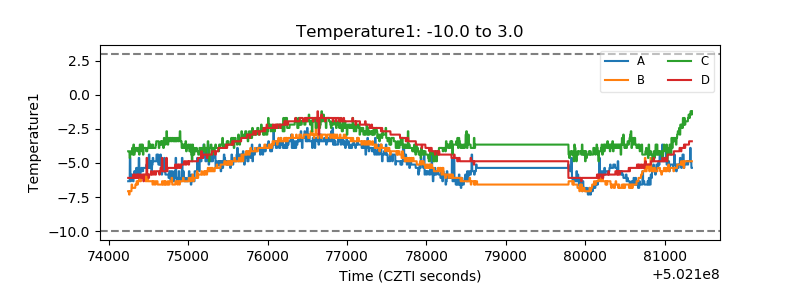 |
| Veto HV Monitor | 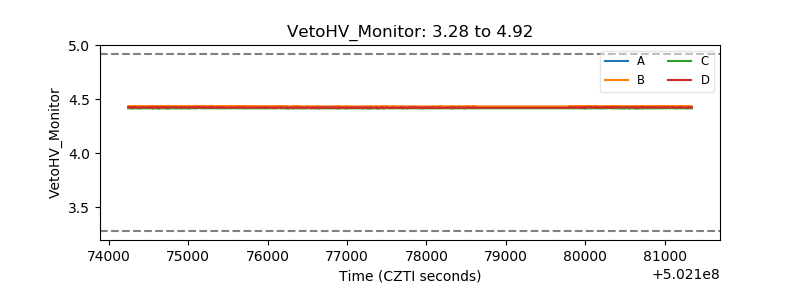 |
| Veto LLD | 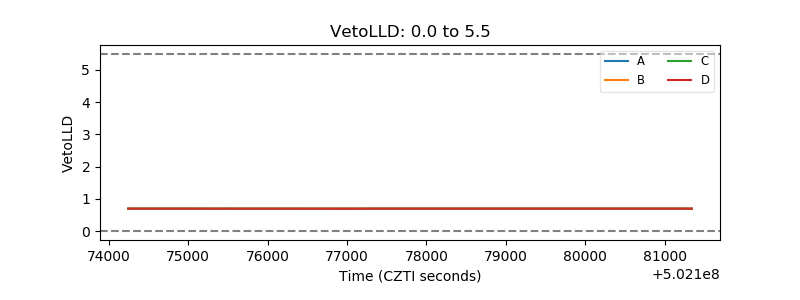 |
| Alpha Counter | 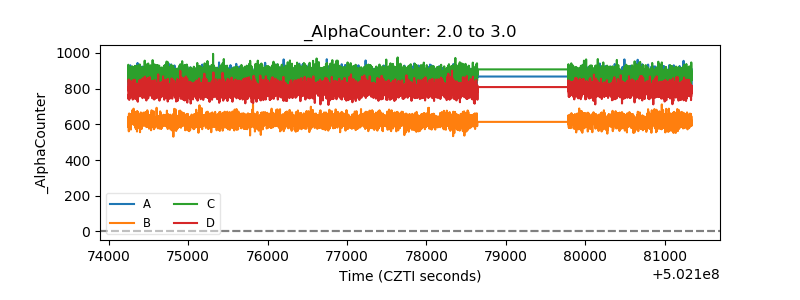 |
| _CPM_Rate | 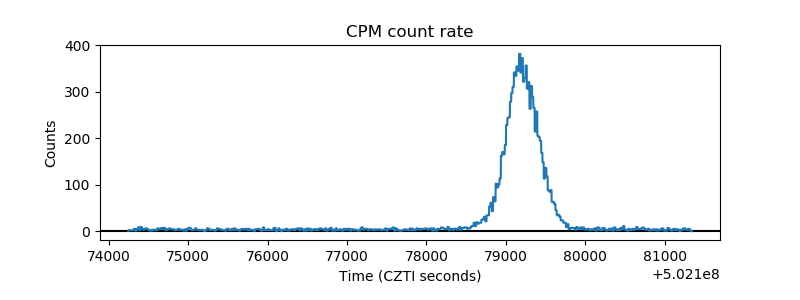 |
| CZT Counter | 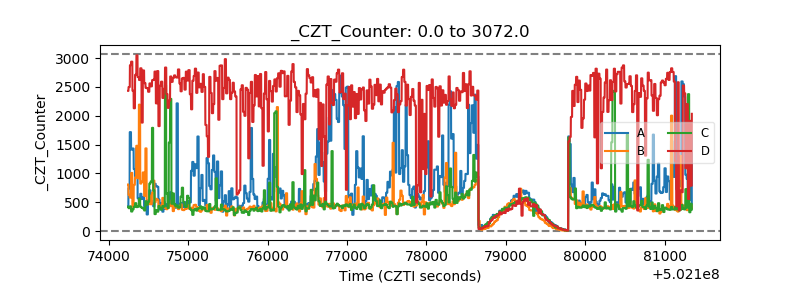 |
| +2.5 Volts monitor |  |
| +5 Volts monitor |  |
| _ROLL_ROT | 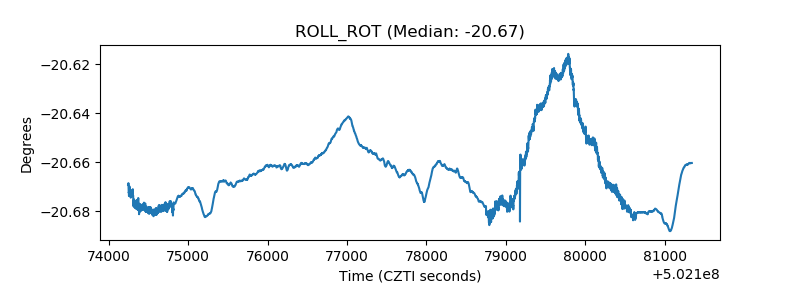 |
| _Roll_DEC | 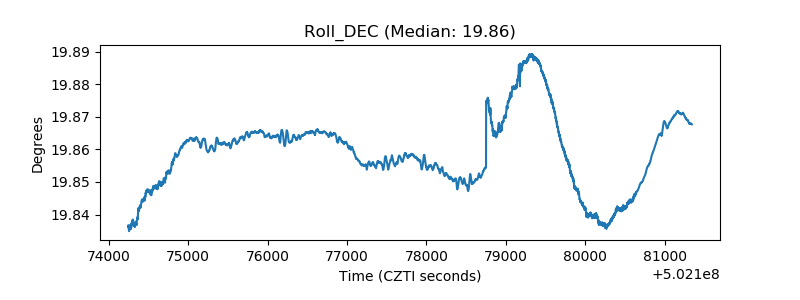 |
| _Roll_RA | 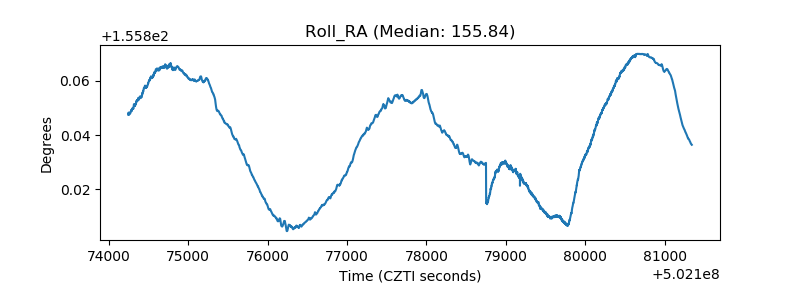 |
| Veto Counter | 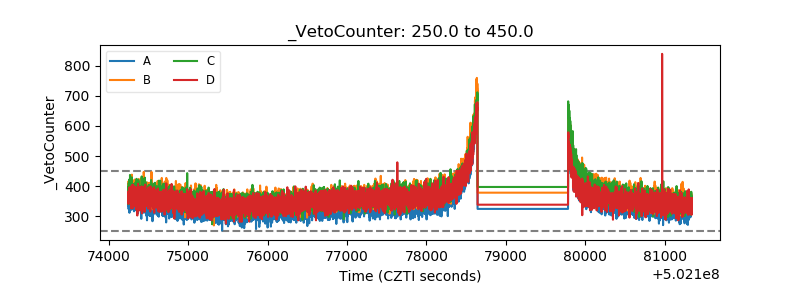 |