| Param | Original file | Final file |
|---|---|---|
| Filename | modeM0/AS1A14_025T01_9000006530_55042cztM0_level2.fits | modeM0/AS1A14_025T01_9000006530_55042cztM0_level2_quad_clean.evt |
| Size (bytes) | 4,408,525,440 | 519,039,360 |
| Size | 4.1 GB | 495.0 MB |
| Events in quadrant A | 36,878,179 | 3,605,244 |
| Events in quadrant B | 20,415,333 | 4,313,515 |
| Events in quadrant C | 20,314,699 | 3,783,233 |
| Events in quadrant D | 82,389,769 | 1,173,396 |
| Mode M0 | |||
|---|---|---|---|
| Quadrant | BADHDUFLAG | Total packets | Discarded packets |
| A | 0 | 141463 | 2873 |
| B | 0 | 92409 | 1571 |
| C | 0 | 94687 | 3581 |
| D | 0 | 282310 | 9601 |
| Mode SS | |||
|---|---|---|---|
| Quadrant | BADHDUFLAG | Total packets | Discarded packets |
| A | 0 | 858 | 14 |
| B | 0 | 860 | 18 |
| C | 0 | 862 | 6 |
| D | 0 | 864 | 14 |
| Mode M9 | |||
|---|---|---|---|
| Quadrant | BADHDUFLAG | Total packets | Discarded packets |
| A | 0 | 74 | 0 |
| B | 0 | 74 | 0 |
| C | 0 | 74 | 0 |
| D | 0 | 74 | 0 |
| Quadrant | Total seconds | Saturated seconds | Saturation percentage |
|---|---|---|---|
| A | 41443 | 5069 | 12.231257% |
| B | 41576 | 717 | 1.724553% |
| C | 41433 | 756 | 1.824633% |
| D | 40779 | 27617 | 67.723583% |
Noise dominated data is calculated using 1-second bins in cleaned event files. If a bin has >2000 counts, and if more than 50% of those come from <1% of pixels, then it is considered to be noise-dominated and hence unusable.
| Quadrant | # 1 sec bins | Bins with >0 counts | Bins with >2000 counts | High rate bins dominated by noise | Noise dominated (total time) | Noise dominated (detector-on time) | Marked lightcurve |
|---|---|---|---|---|---|---|---|
| A | 51242 | 42138 | 3826 | 3826 | 7.47% | 9.08% | 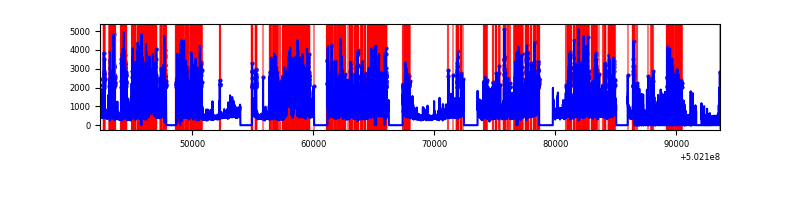 |
| B | 51243 | 42225 | 143 | 143 | 0.28% | 0.34% | 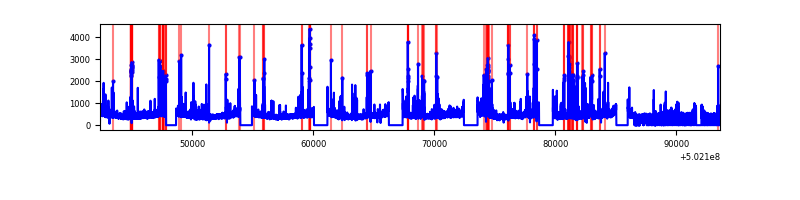 |
| C | 51242 | 42051 | 417 | 417 | 0.81% | 0.99% | 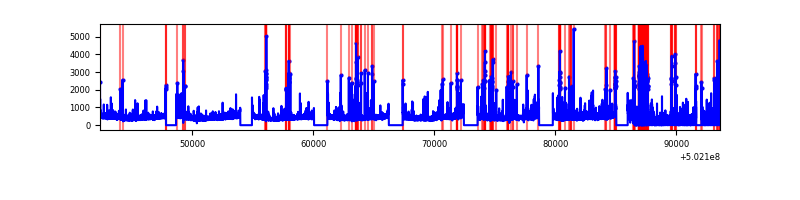 |
| D | 51241 | 41588 | 22172 | 22172 | 43.27% | 53.31% | 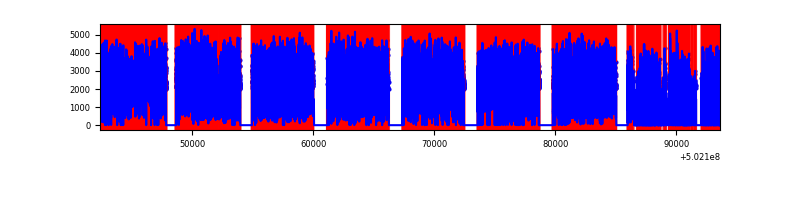 |
Top three noisy pixels from each quadrant. If the there are fewer than three noisy pixels in the level2.evt file, extra rows are filled as -1
| Pixel properties | Quadrant properties | ||||||
|---|---|---|---|---|---|---|---|
| Quadrant | DetID | PixID | Counts | Sigma | Mean | Median | Sigma |
| A | 15 | 32 | 15879924 | 15030.1 | 4328 | 4233 | 1056.3 |
| A | 0 | 8 | 2815824 | 2661.84 | 4328 | 4233 | 1056.3 |
| A | 3 | 95 | 789217 | 743.17 | 4328 | 4233 | 1056.3 |
| B | 5 | 236 | 662552 | 686.14 | 4496 | 4320 | 959.3 |
| B | 5 | 185 | 534985 | 553.16 | 4496 | 4320 | 959.3 |
| B | 4 | 81 | 443368 | 457.66 | 4496 | 4320 | 959.3 |
| C | 13 | 3 | 1322935 | 1097.87 | 4394 | 4361 | 1201.0 |
| C | 6 | 223 | 467381 | 385.52 | 4394 | 4361 | 1201.0 |
| C | 12 | 252 | 428545 | 353.18 | 4394 | 4361 | 1201.0 |
| D | 11 | 129 | 31210931 | 42553.25 | 2544 | 2428 | 733.4 |
| D | 15 | 94 | 30869917 | 42088.27 | 2544 | 2428 | 733.4 |
| D | 15 | 93 | 2895140 | 3944.25 | 2544 | 2428 | 733.4 |
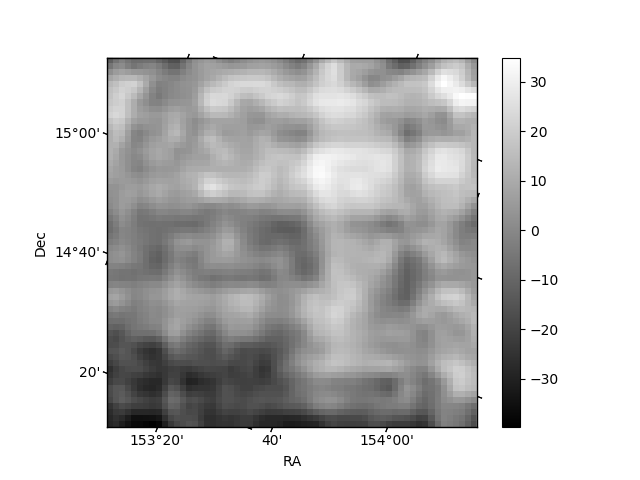
Histogram calculated using DETX and DETY for each event in the final _common_clean file
| Quadrant A |  |
 |
Quadrant B |
|---|---|---|---|
| Quadrant D |  |
 |
Quadrant C |
| Plot type | Count rate plots | Images |
|---|---|---|
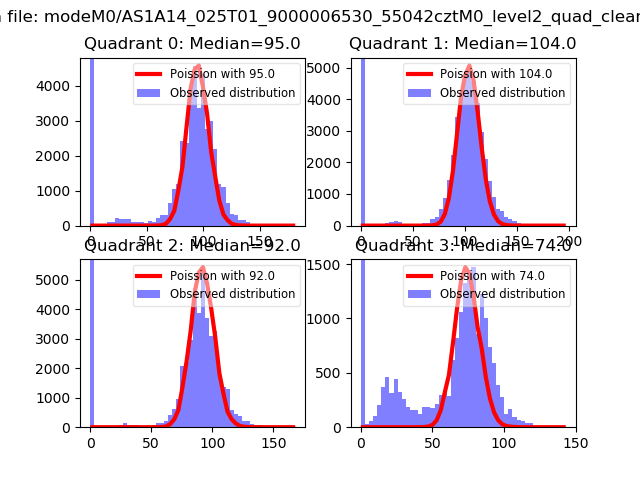
| Comparison with Poisson distribution Blue bars denote a histogram of data divided into 1 sec bins. Red curve is a Poisson curve with rate = median count rate of data. |
 |
 |
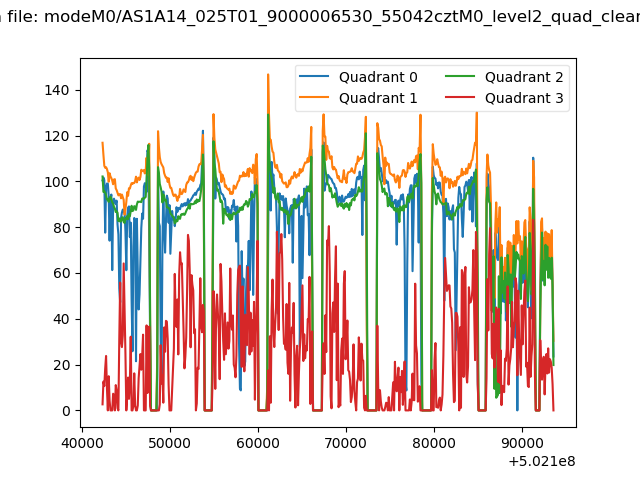
| Quadrant-wise count rates Data is divided into 100 sec bins |
 |
|
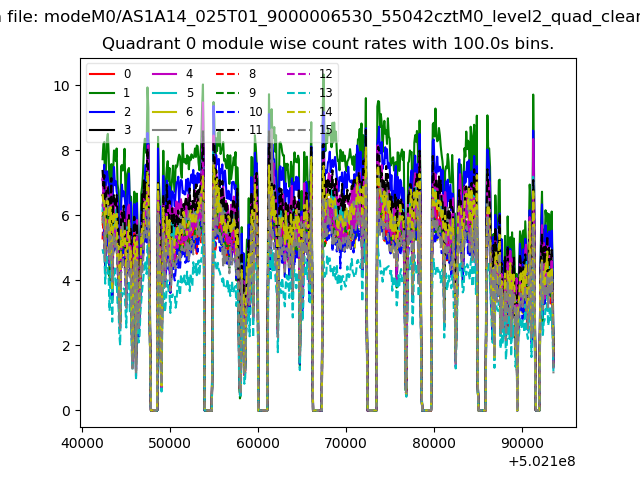
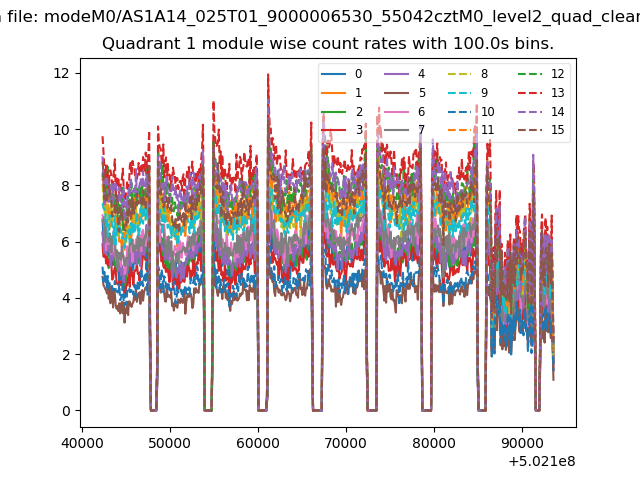
| Module-wise count rates for Quadrant A Data is divided into 100 sec bins |
 |
 |
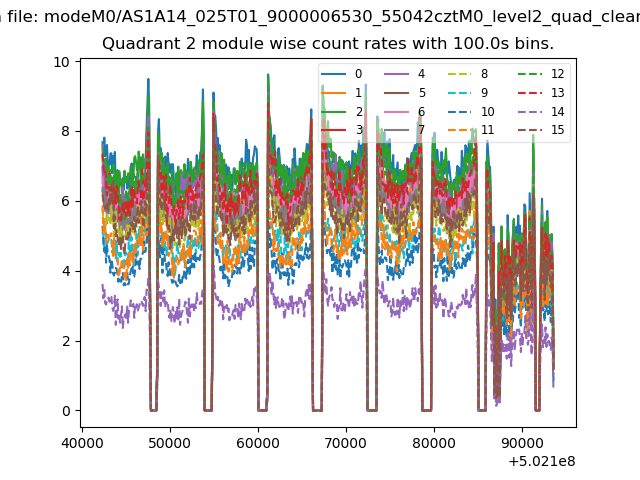
| Module-wise count rates for Quadrant B Data is divided into 100 sec bins |
 |
 |
| Module-wise count rates for Quadrant C Data is divided into 100 sec bins |
 |
 |
| Module-wise count rates for Quadrant D Data is divided into 100 sec bins |
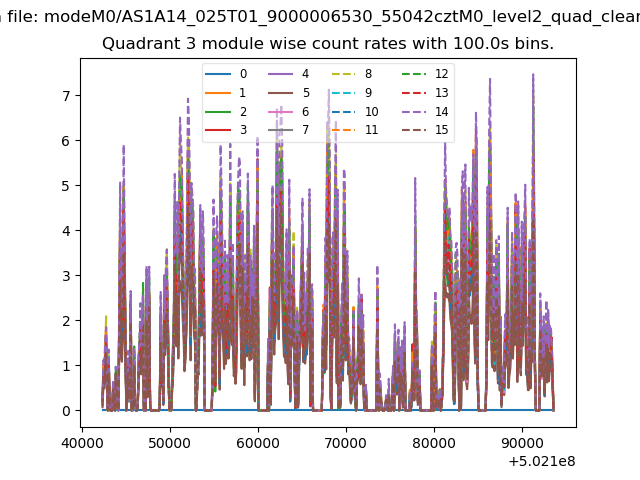 |
 |
| Parameter | Plot |
|---|---|
| CZT HV Monitor | 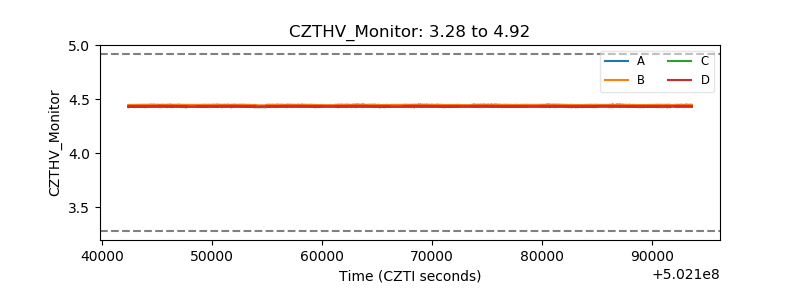 |
| D_VDD | 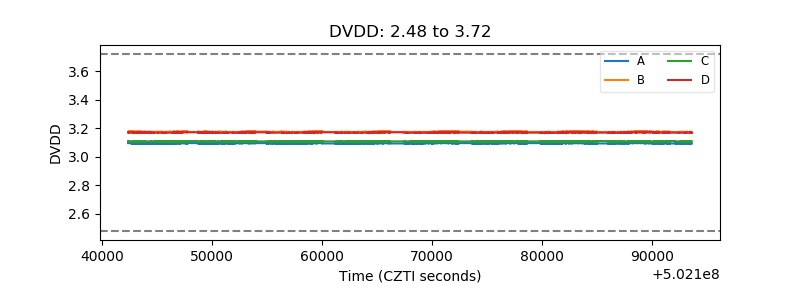 |
| Temperature 1 | 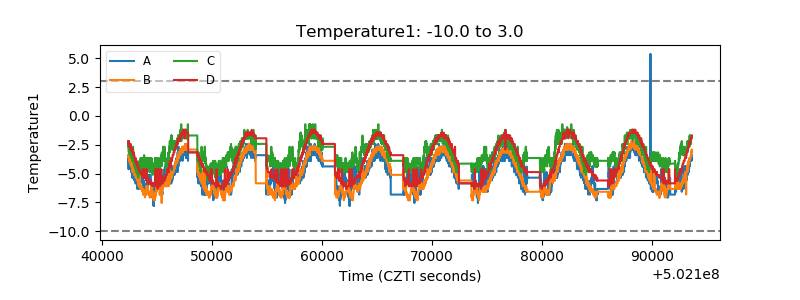 |
| Veto HV Monitor |  |
| Veto LLD | 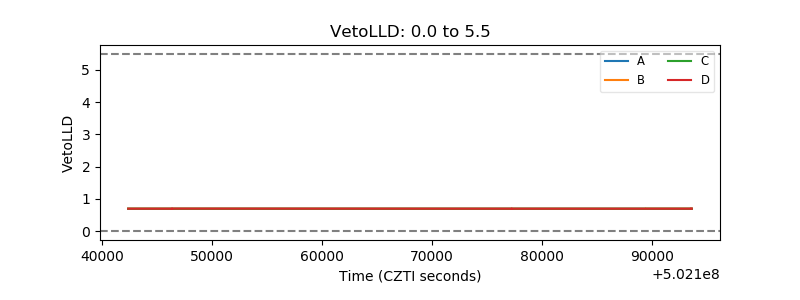 |
| Alpha Counter | 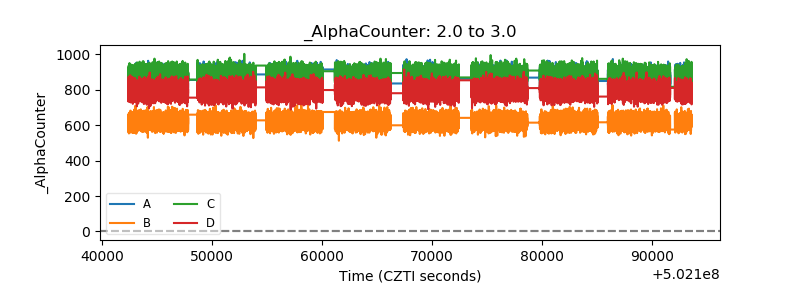 |
| _CPM_Rate | 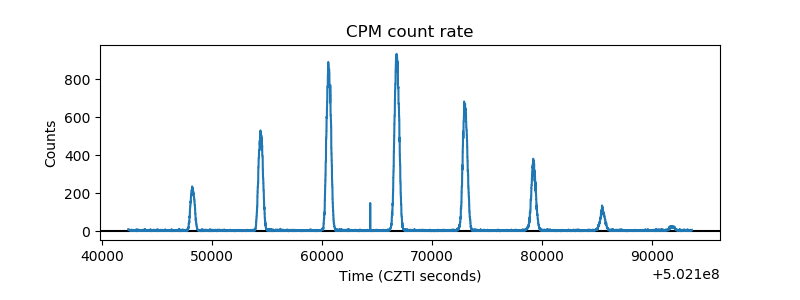 |
| CZT Counter |  |
| +2.5 Volts monitor |  |
| +5 Volts monitor | 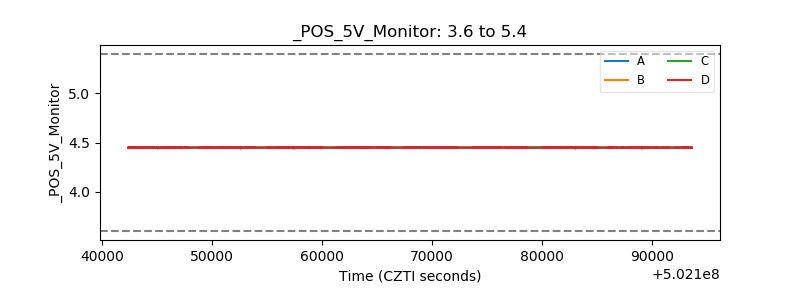 |
| _ROLL_ROT | 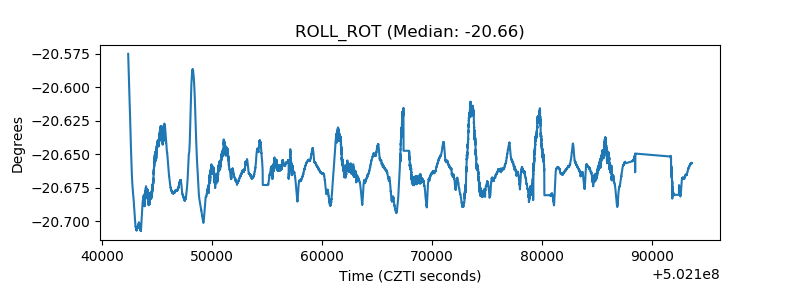 |
| _Roll_DEC |  |
| _Roll_RA |  |
| Veto Counter | 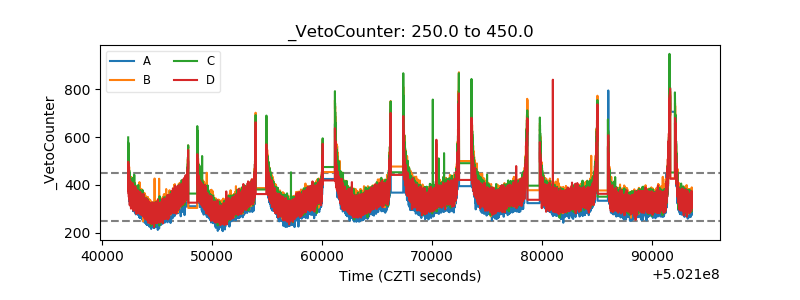 |