| Param | Original file | Final file |
|---|---|---|
| Filename | modeM0/AS1A14_025T01_9000006530_55043cztM0_level2.fits | modeM0/AS1A14_025T01_9000006530_55043cztM0_level2_quad_clean.evt |
| Size (bytes) | 647,775,360 | 103,596,480 |
| Size | 617.8 MB | 98.8 MB |
| Events in quadrant A | 3,730,909 | 723,487 |
| Events in quadrant B | 3,516,898 | 787,587 |
| Events in quadrant C | 3,688,815 | 692,419 |
| Events in quadrant D | 12,446,022 | 399,723 |
| Mode M0 | |||
|---|---|---|---|
| Quadrant | BADHDUFLAG | Total packets | Discarded packets |
| A | 0 | 16947 | 64 |
| B | 0 | 16190 | 59 |
| C | 0 | 16809 | 32 |
| D | 0 | 42596 | 369 |
| Mode SS | |||
|---|---|---|---|
| Quadrant | BADHDUFLAG | Total packets | Discarded packets |
| A | 0 | 154 | 2 |
| B | 0 | 154 | 0 |
| C | 0 | 154 | 0 |
| D | 0 | 154 | 0 |
| Quadrant | Total seconds | Saturated seconds | Saturation percentage |
|---|---|---|---|
| A | 7671 | 90 | 1.173250% |
| B | 7673 | 42 | 0.547374% |
| C | 7685 | 76 | 0.988939% |
| D | 7640 | 3378 | 44.214660% |
Noise dominated data is calculated using 1-second bins in cleaned event files. If a bin has >2000 counts, and if more than 50% of those come from <1% of pixels, then it is considered to be noise-dominated and hence unusable.
| Quadrant | # 1 sec bins | Bins with >0 counts | Bins with >2000 counts | High rate bins dominated by noise | Noise dominated (total time) | Noise dominated (detector-on time) | Marked lightcurve |
|---|---|---|---|---|---|---|---|
| A | 7700 | 7700 | 58 | 58 | 0.75% | 0.75% | 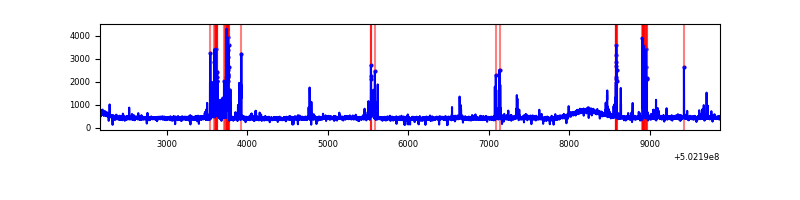 |
| B | 7700 | 7700 | 5 | 5 | 0.06% | 0.06% | 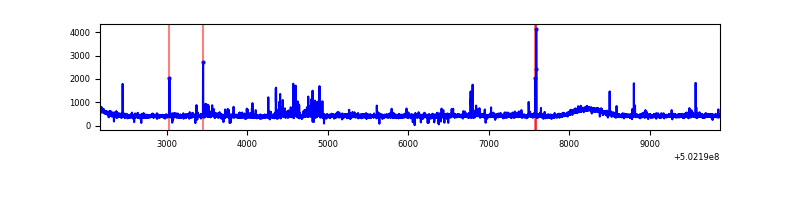 |
| C | 7701 | 7701 | 50 | 50 | 0.65% | 0.65% | 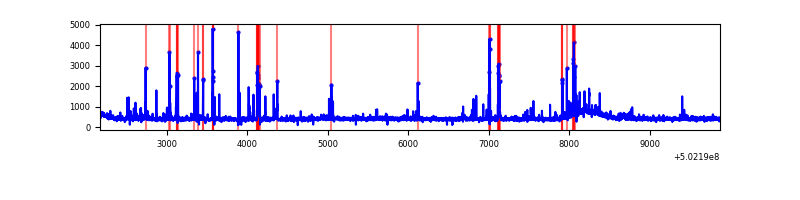 |
| D | 7701 | 7687 | 2669 | 2669 | 34.66% | 34.72% | 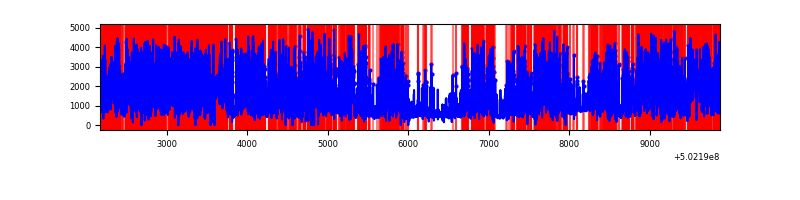 |
Top three noisy pixels from each quadrant. If the there are fewer than three noisy pixels in the level2.evt file, extra rows are filled as -1
| Pixel properties | Quadrant properties | ||||||
|---|---|---|---|---|---|---|---|
| Quadrant | DetID | PixID | Counts | Sigma | Mean | Median | Sigma |
| A | 0 | 8 | 394428 | 1898.85 | 844 | 823 | 207.3 |
| A | 13 | 254 | 20435 | 94.61 | 844 | 823 | 207.3 |
| A | 4 | 3 | 16434 | 75.31 | 844 | 823 | 207.3 |
| B | 5 | 185 | 49814 | 270.27 | 837 | 807 | 181.3 |
| B | 0 | 182 | 49374 | 267.84 | 837 | 807 | 181.3 |
| B | 10 | 247 | 32044 | 172.27 | 837 | 807 | 181.3 |
| C | 13 | 3 | 277864 | 1235.85 | 823 | 813 | 224.2 |
| C | 12 | 252 | 99195 | 438.85 | 823 | 813 | 224.2 |
| C | 6 | 223 | 45057 | 197.36 | 823 | 813 | 224.2 |
| D | 11 | 129 | 7929450 | 44097.32 | 632 | 605 | 179.8 |
| D | 15 | 94 | 1150985 | 6397.99 | 632 | 605 | 179.8 |
| D | 10 | 181 | 247685 | 1374.17 | 632 | 605 | 179.8 |
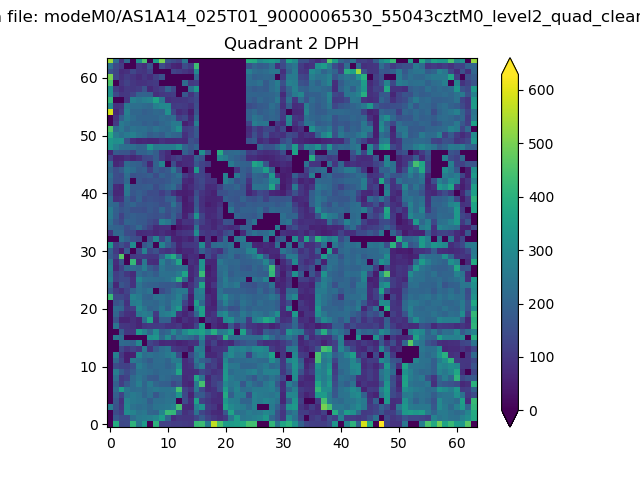
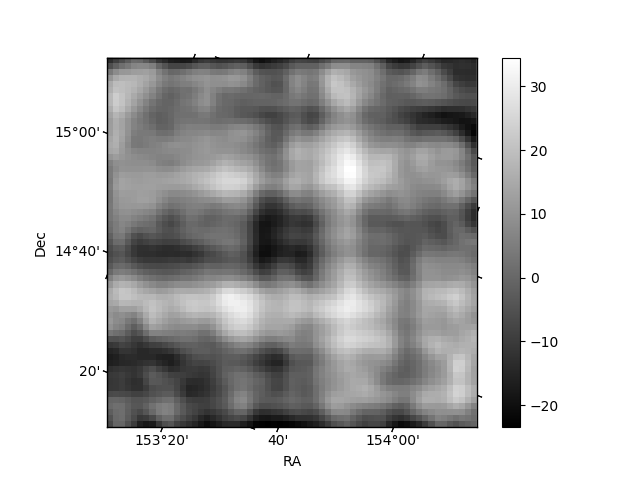
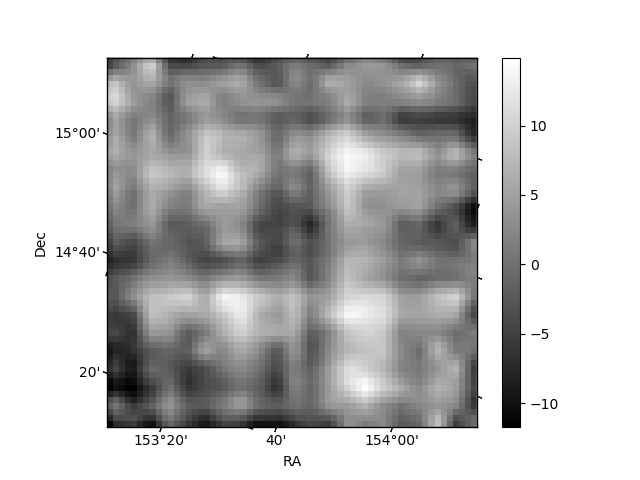
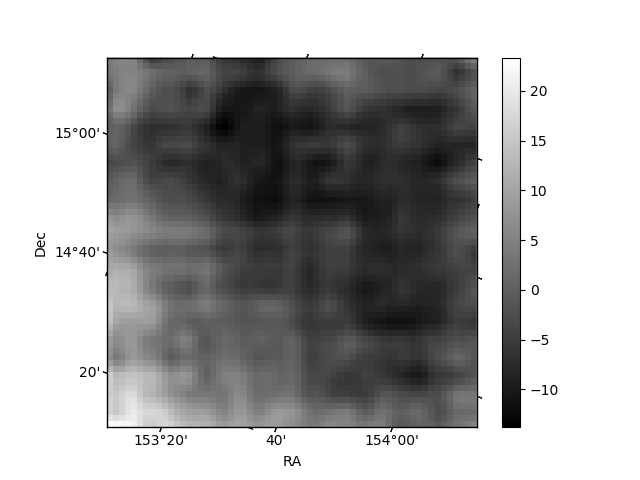
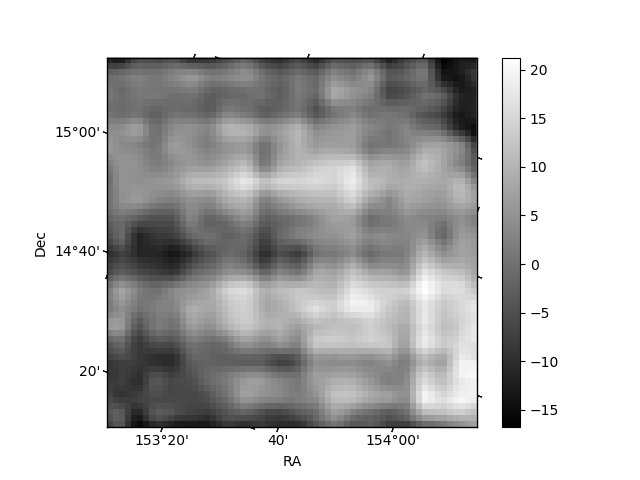
Histogram calculated using DETX and DETY for each event in the final _common_clean file
| Quadrant A | 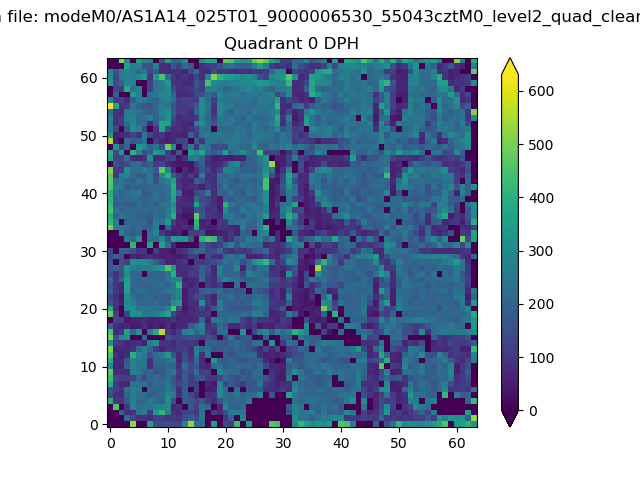 |
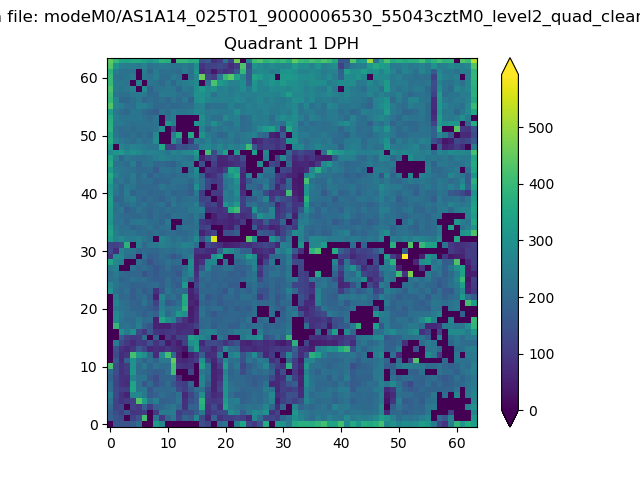 |
Quadrant B |
|---|---|---|---|
| Quadrant D | 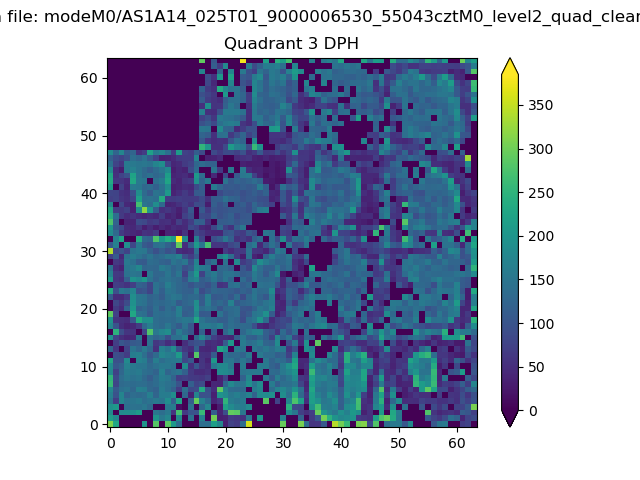 |
 |
Quadrant C |
| Plot type | Count rate plots | Images |
|---|---|---|
| Comparison with Poisson distribution Blue bars denote a histogram of data divided into 1 sec bins. Red curve is a Poisson curve with rate = median count rate of data. |
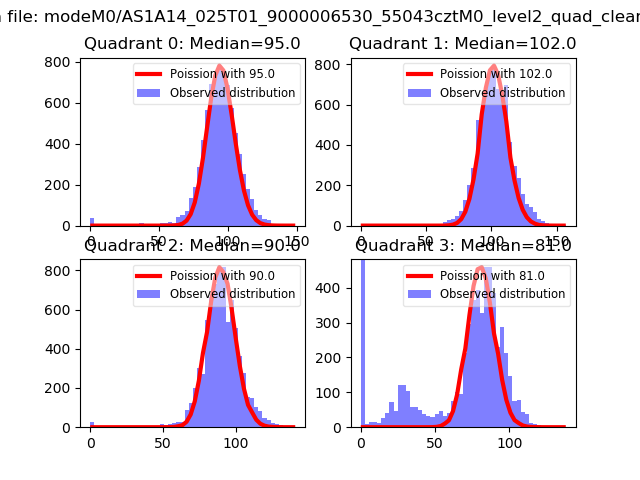 |
 |
| Quadrant-wise count rates Data is divided into 100 sec bins |
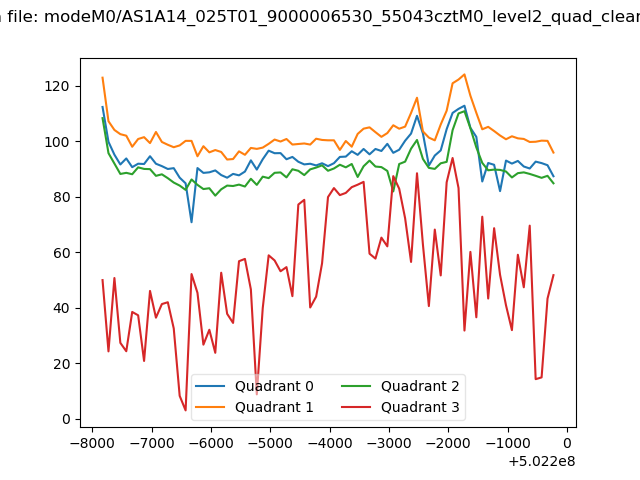 |
|
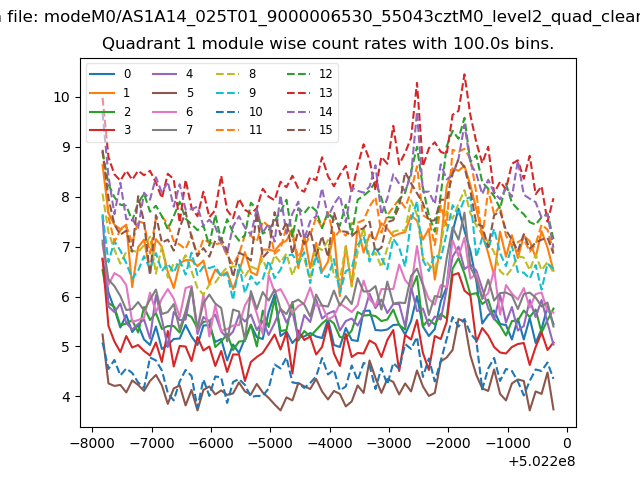
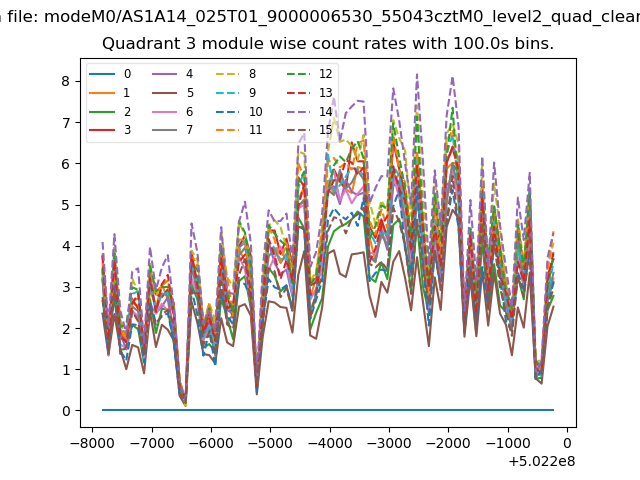
| Module-wise count rates for Quadrant A Data is divided into 100 sec bins |
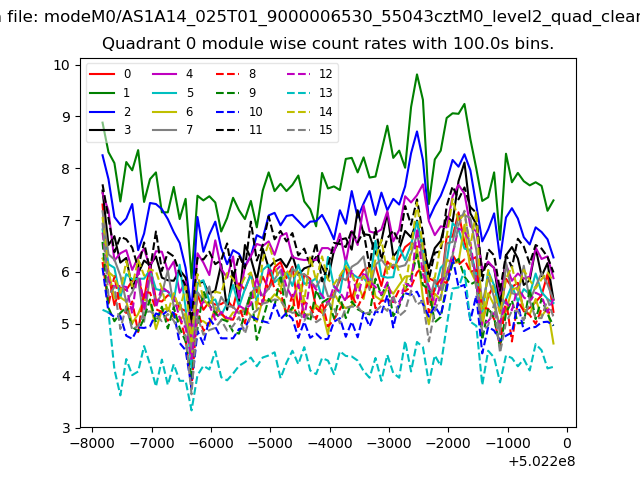 |
 |
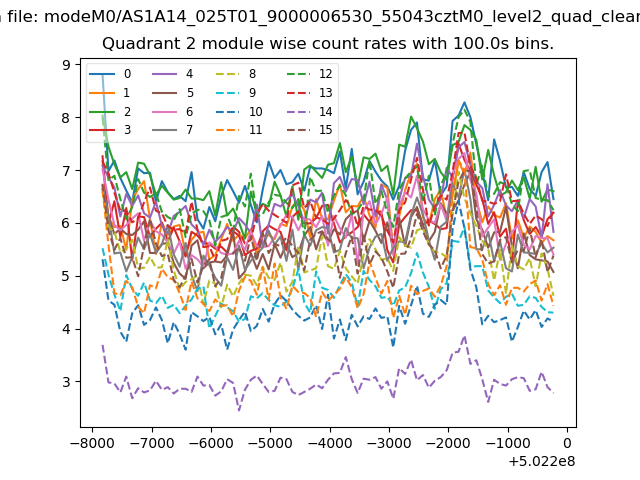
| Module-wise count rates for Quadrant B Data is divided into 100 sec bins |
 |
 |
| Module-wise count rates for Quadrant C Data is divided into 100 sec bins |
 |
 |
| Module-wise count rates for Quadrant D Data is divided into 100 sec bins |
 |
 |
| Parameter | Plot |
|---|---|
| CZT HV Monitor | 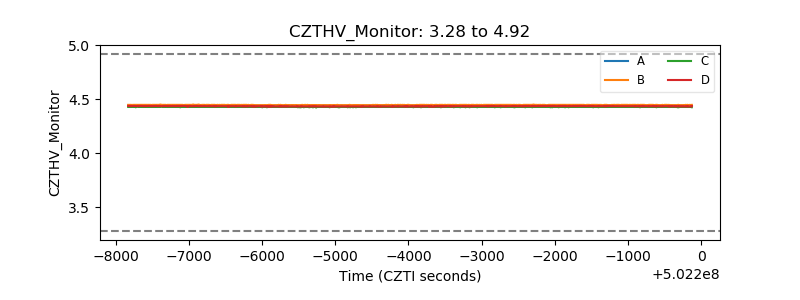 |
| D_VDD | 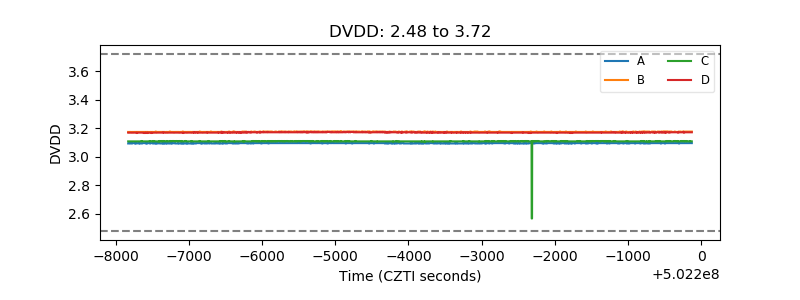 |
| Temperature 1 | 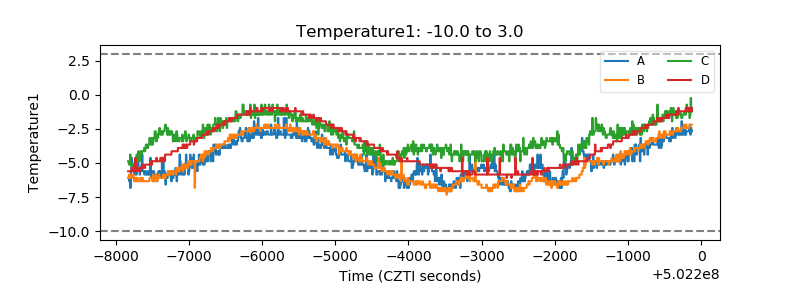 |
| Veto HV Monitor | 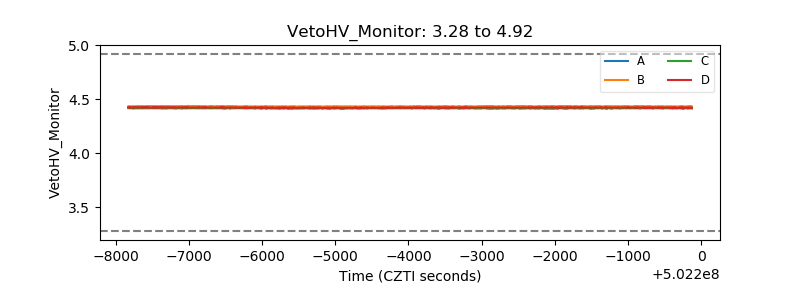 |
| Veto LLD | 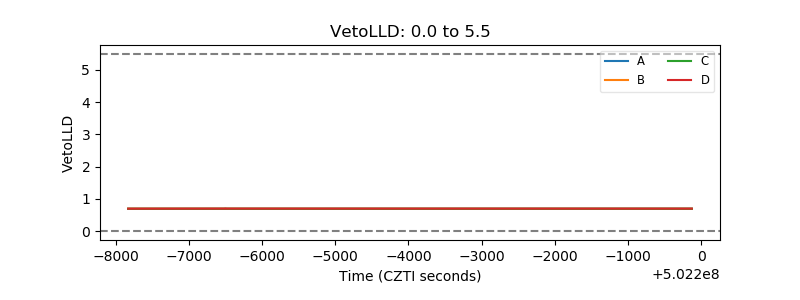 |
| Alpha Counter | 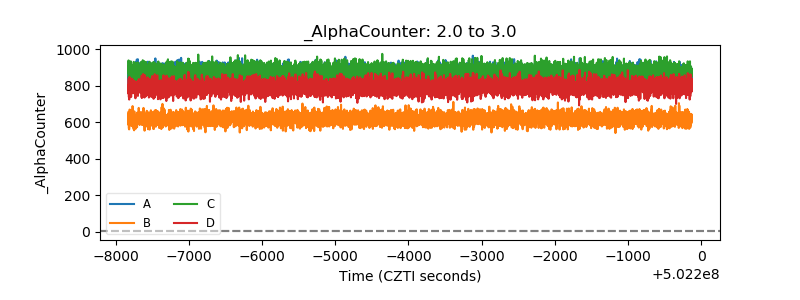 |
| _CPM_Rate | 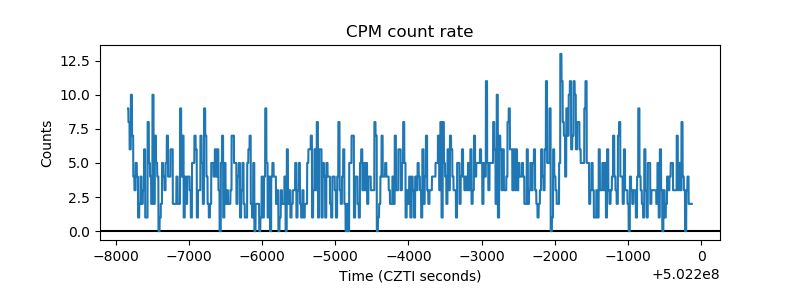 |
| CZT Counter |  |
| +2.5 Volts monitor |  |
| +5 Volts monitor |  |
| _ROLL_ROT | 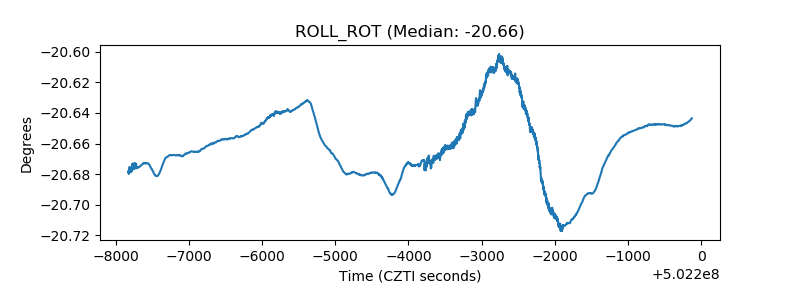 |
| _Roll_DEC | 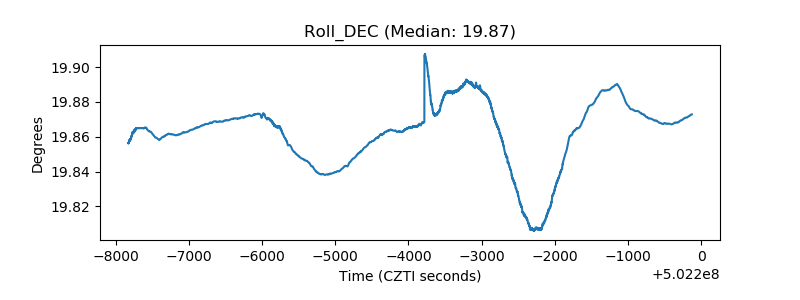 |
| _Roll_RA |  |
| Veto Counter | 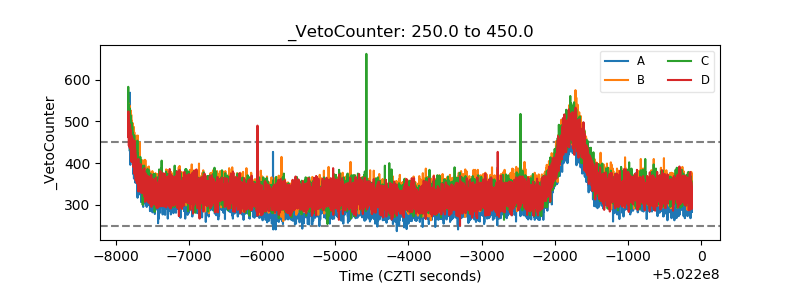 |