| Param | Original file | Final file |
|---|---|---|
| Filename | modeM0/AS1A14_025T01_9000006530_55044cztM0_level2.fits | modeM0/AS1A14_025T01_9000006530_55044cztM0_level2_quad_clean.evt |
| Size (bytes) | 28,198,080 | 4,633,920 |
| Size | 26.9 MB | 4.4 MB |
| Events in quadrant A | 186,480 | 27,983 |
| Events in quadrant B | 162,621 | 36,293 |
| Events in quadrant C | 172,468 | 29,331 |
| Events in quadrant D | 491,160 | 13,978 |
| Mode M0 | |||
|---|---|---|---|
| Quadrant | BADHDUFLAG | Total packets | Discarded packets |
| A | 0 | 2562 | 1752 |
| B | 0 | 1809 | 1042 |
| C | 0 | 1895 | 1102 |
| D | 0 | 5894 | 4230 |
| Mode SS | |||
|---|---|---|---|
| Quadrant | BADHDUFLAG | Total packets | Discarded packets |
| A | 0 | 19 | 11 |
| B | 0 | 18 | 12 |
| C | 0 | 19 | 9 |
| D | 0 | 19 | 11 |
| Mode M9 | |||
|---|---|---|---|
| Quadrant | BADHDUFLAG | Total packets | Discarded packets |
| A | 1 | 139751057233960 | 139749645877294 |
| B | 1 | -1 | -1 |
| C | 1 | -1 | -1 |
| D | 1 | -1 | -1 |
| Quadrant | Total seconds | Saturated seconds | Saturation percentage |
|---|---|---|---|
| A | 356 | 5 | 1.404494% |
| B | 381 | 0 | 0.000000% |
| C | 375 | 1 | 0.266667% |
| D | 300 | 107 | 35.666667% |
Noise dominated data is calculated using 1-second bins in cleaned event files. If a bin has >2000 counts, and if more than 50% of those come from <1% of pixels, then it is considered to be noise-dominated and hence unusable.
| Quadrant | # 1 sec bins | Bins with >0 counts | Bins with >2000 counts | High rate bins dominated by noise | Noise dominated (total time) | Noise dominated (detector-on time) | Marked lightcurve |
|---|---|---|---|---|---|---|---|
| A | 36971 | 415 | 1 | 1 | 0.00% | 0.24% | 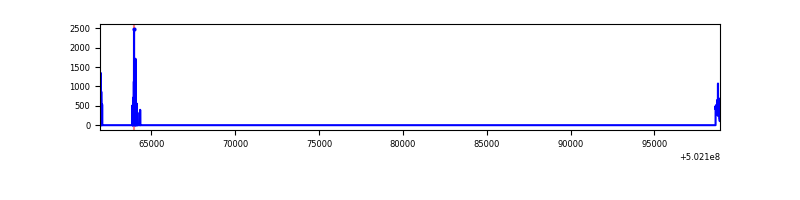 |
| B | 36972 | 437 | 0 | 0 | 0.00% | 0.00% | 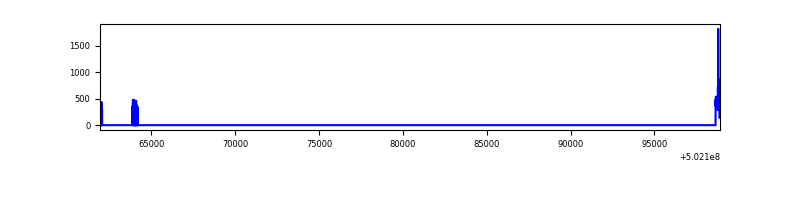 |
| C | 36959 | 436 | 1 | 1 | 0.00% | 0.23% | 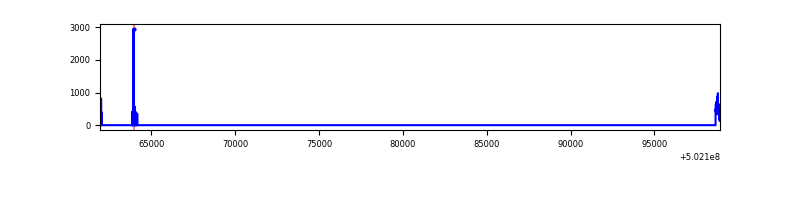 |
| D | 36939 | 327 | 92 | 92 | 0.25% | 28.13% | 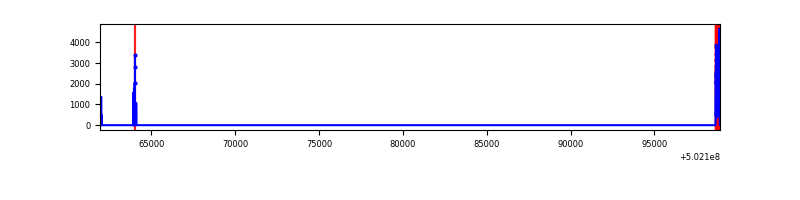 |
Top three noisy pixels from each quadrant. If the there are fewer than three noisy pixels in the level2.evt file, extra rows are filled as -1
| Pixel properties | Quadrant properties | ||||||
|---|---|---|---|---|---|---|---|
| Quadrant | DetID | PixID | Counts | Sigma | Mean | Median | Sigma |
| A | 15 | 32 | 27005 | 2436.7 | 37 | 36 | 11.1 |
| A | 0 | 8 | 10498 | 945.26 | 37 | 36 | 11.1 |
| A | 4 | 3 | 1162 | 101.74 | 37 | 36 | 11.1 |
| B | 0 | 182 | 3042 | 284.81 | 40 | 39 | 10.5 |
| B | 12 | 111 | 1094 | 100.06 | 40 | 39 | 10.5 |
| B | 11 | 111 | 1032 | 94.18 | 40 | 39 | 10.5 |
| C | 12 | 252 | 12165 | 993.22 | 38 | 37 | 12.2 |
| C | 13 | 3 | 6755 | 550.17 | 38 | 37 | 12.2 |
| C | 14 | 254 | 880 | 69.04 | 38 | 37 | 12.2 |
| D | 11 | 129 | 295207 | 33697.18 | 25 | 24 | 8.8 |
| D | 15 | 94 | 78566 | 8966.11 | 25 | 24 | 8.8 |
| D | 6 | 239 | 8759 | 997.16 | 25 | 24 | 8.8 |
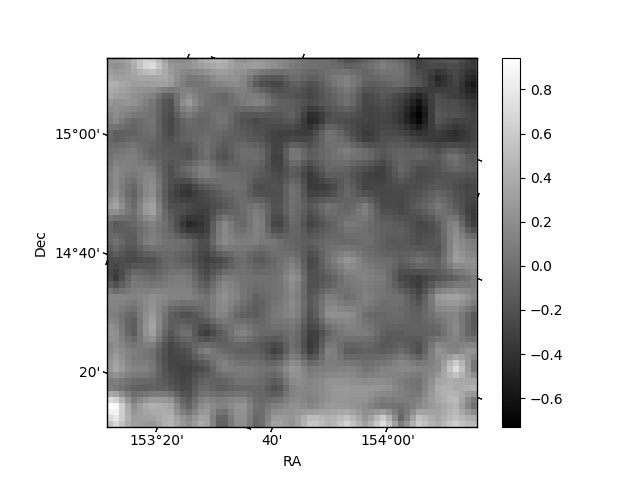
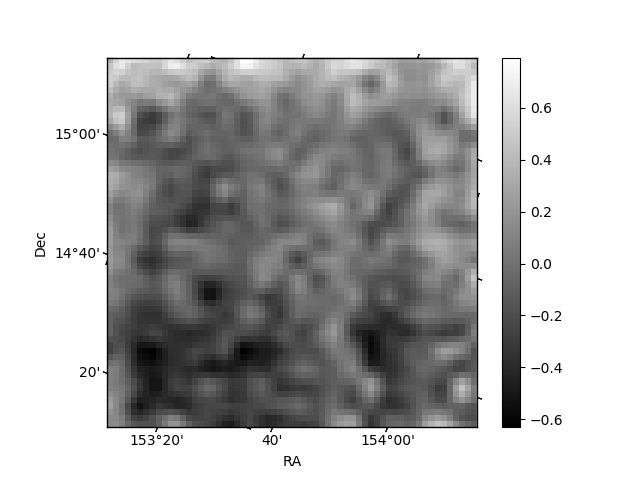
Histogram calculated using DETX and DETY for each event in the final _common_clean file
| Quadrant A | 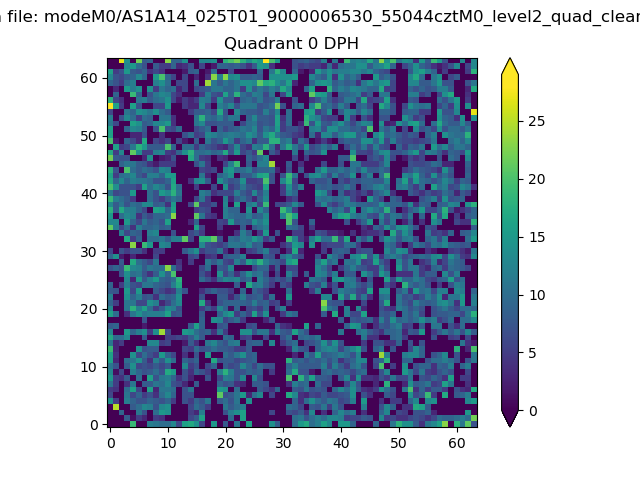 |
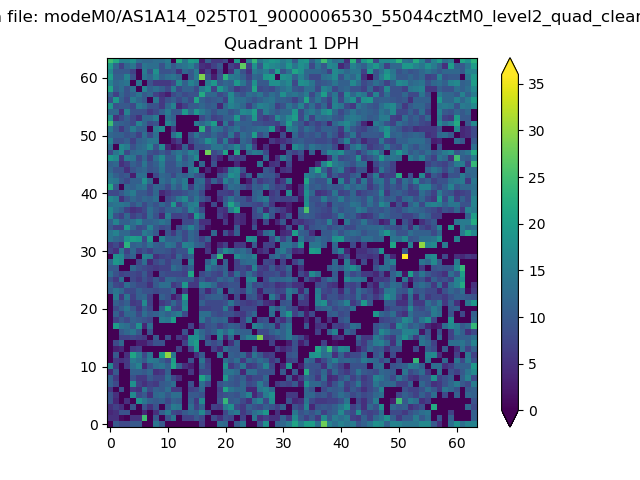 |
Quadrant B |
|---|---|---|---|
| Quadrant D |  |
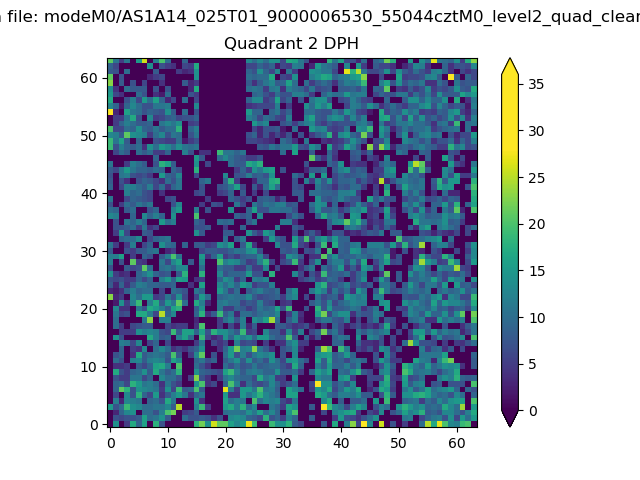 |
Quadrant C |
| Plot type | Count rate plots | Images |
|---|---|---|
| Comparison with Poisson distribution Blue bars denote a histogram of data divided into 1 sec bins. Red curve is a Poisson curve with rate = median count rate of data. |
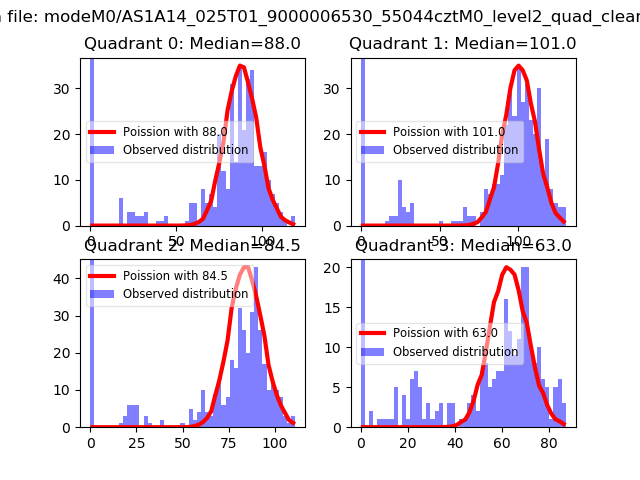 |
 |
| Quadrant-wise count rates Data is divided into 100 sec bins |
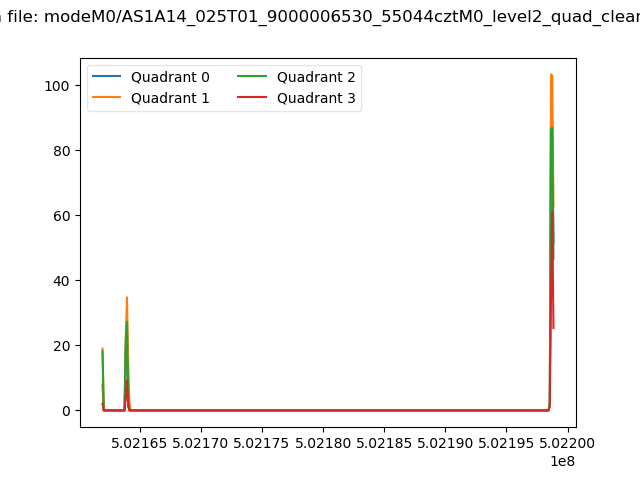 |
|
| Module-wise count rates for Quadrant A Data is divided into 100 sec bins |
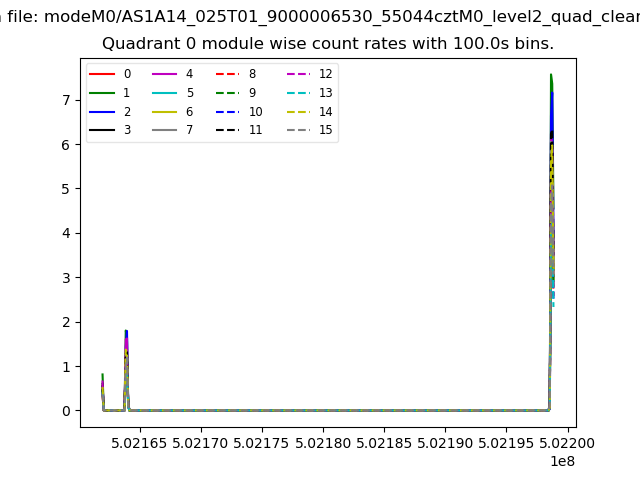 |
 |
| Module-wise count rates for Quadrant B Data is divided into 100 sec bins |
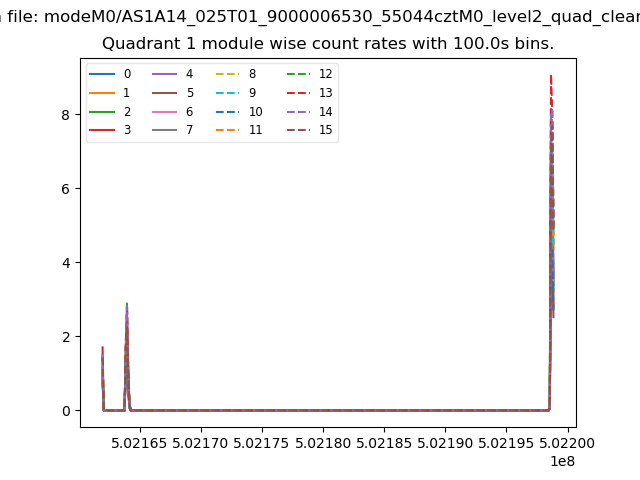 |
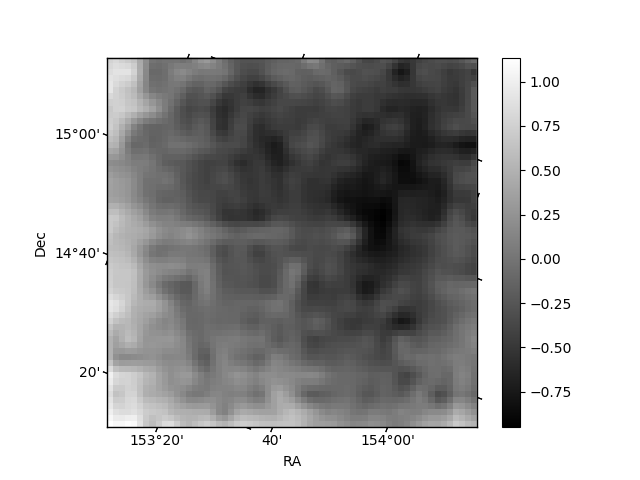 |
| Module-wise count rates for Quadrant C Data is divided into 100 sec bins |
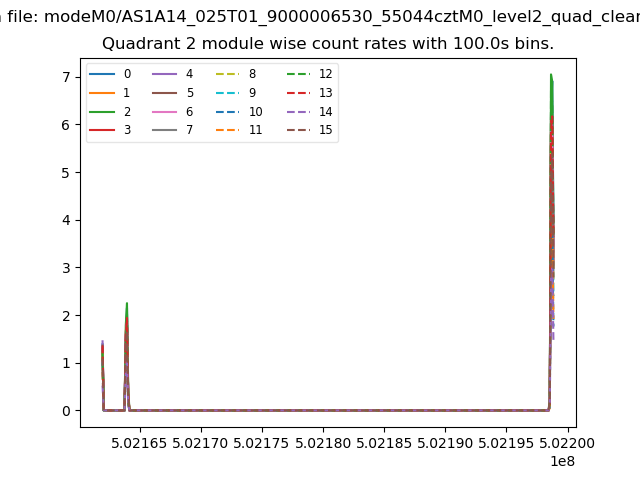 |
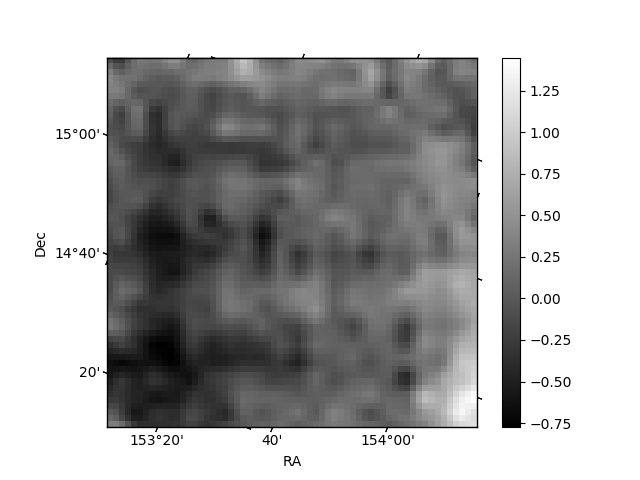 |
| Module-wise count rates for Quadrant D Data is divided into 100 sec bins |
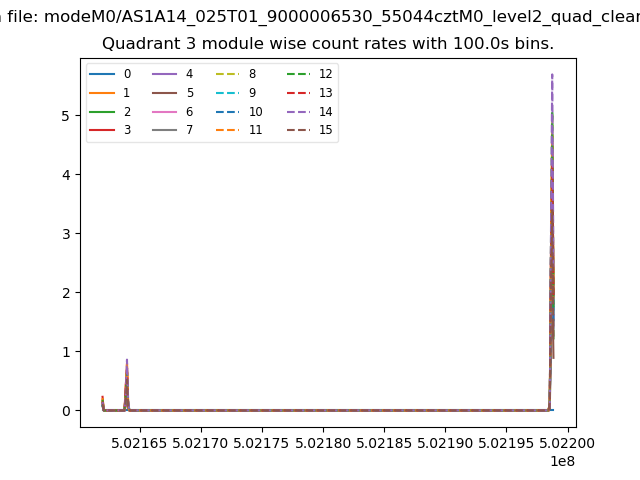 |
 |
| Parameter | Plot |
|---|---|
| CZT HV Monitor | 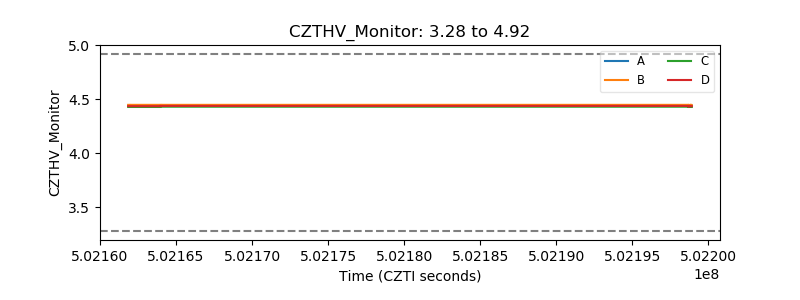 |
| D_VDD | 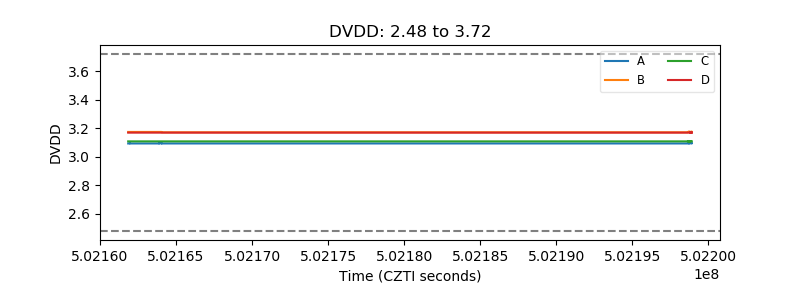 |
| Temperature 1 | 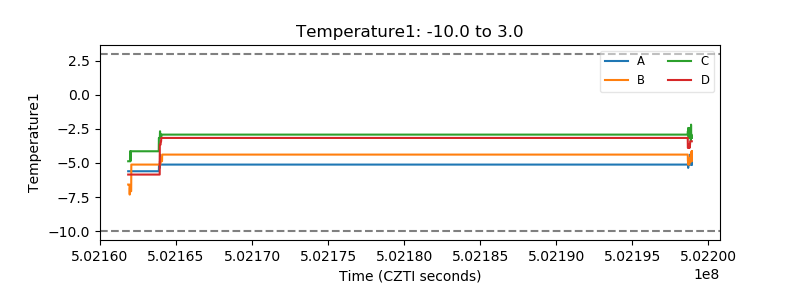 |
| Veto HV Monitor | 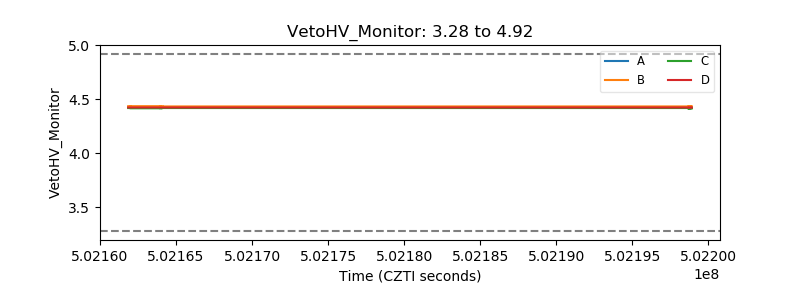 |
| Veto LLD | 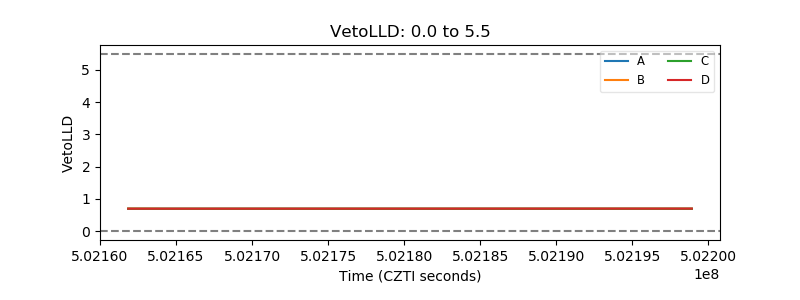 |
| Alpha Counter | 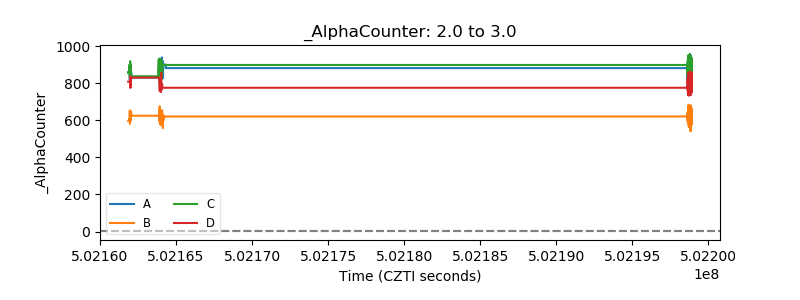 |
| _CPM_Rate | 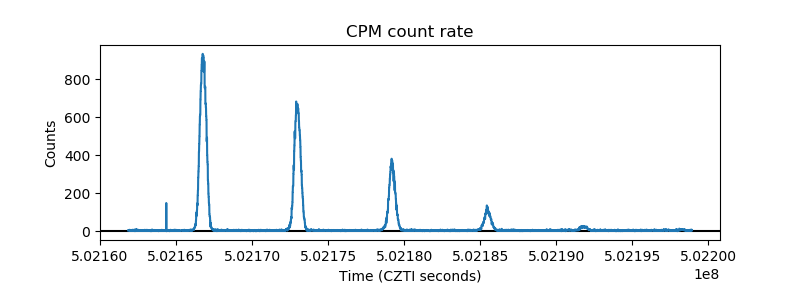 |
| CZT Counter |  |
| +2.5 Volts monitor | 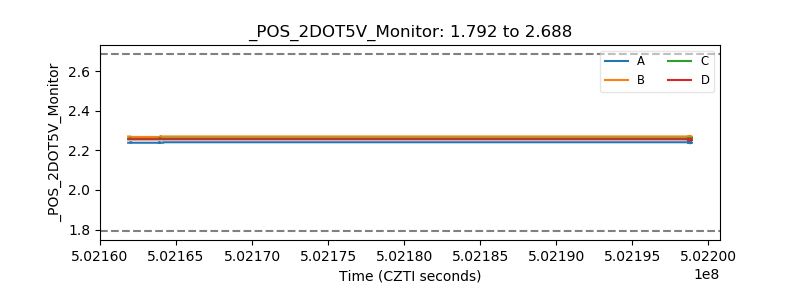 |
| +5 Volts monitor |  |
| _ROLL_ROT | 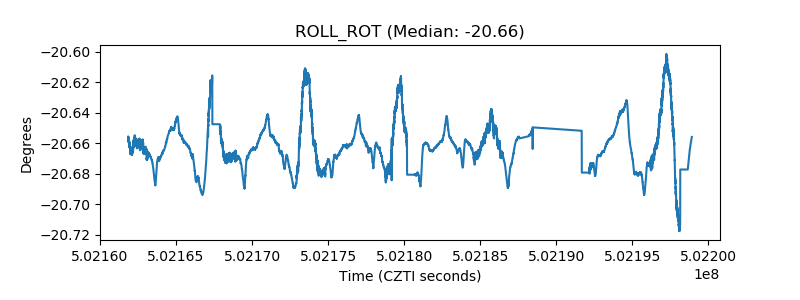 |
| _Roll_DEC | 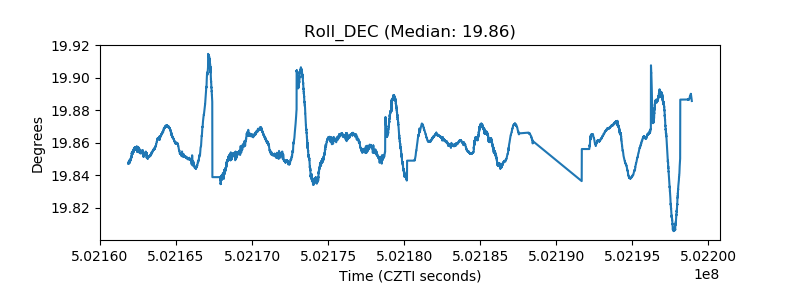 |
| _Roll_RA |  |
| Veto Counter | 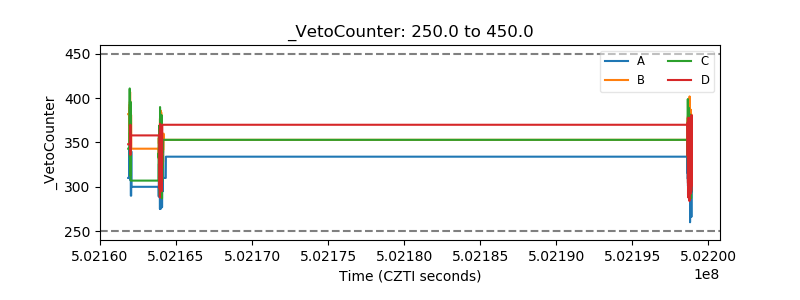 |