| Param | Original file | Final file |
|---|---|---|
| Filename | modeM0/AS1A14_025T01_9000006530_55049cztM0_level2.fits | modeM0/AS1A14_025T01_9000006530_55049cztM0_level2_quad_clean.evt |
| Size (bytes) | 129,951,360 | 21,850,560 |
| Size | 123.9 MB | 20.8 MB |
| Events in quadrant A | 1,105,241 | 144,554 |
| Events in quadrant B | 1,178,565 | 145,230 |
| Events in quadrant C | 1,154,162 | 154,988 |
| Events in quadrant D | 1,197,450 | 56,716 |
| Mode M0 | |||
|---|---|---|---|
| Quadrant | BADHDUFLAG | Total packets | Discarded packets |
| A | 0 | 38885 | 33858 |
| B | 0 | 33063 | 27740 |
| C | 0 | 30697 | 25334 |
| D | 0 | 74185 | 69790 |
| Mode SS | |||
|---|---|---|---|
| Quadrant | BADHDUFLAG | Total packets | Discarded packets |
| A | 0 | 286 | 244 |
| B | 0 | 291 | 226 |
| C | 0 | 292 | 230 |
| D | 0 | 289 | 242 |
| Mode M9 | |||
|---|---|---|---|
| Quadrant | BADHDUFLAG | Total packets | Discarded packets |
| A | 0 | 20 | 8 |
| B | 0 | 21 | 11 |
| C | 0 | 21 | 14 |
| D | 0 | 21 | 14 |
| Quadrant | Total seconds | Saturated seconds | Saturation percentage |
|---|---|---|---|
| A | 2373 | 20 | 0.842815% |
| B | 2442 | 50 | 2.047502% |
| C | 2628 | 5 | 0.190259% |
| D | 1261 | 130 | 10.309278% |
Noise dominated data is calculated using 1-second bins in cleaned event files. If a bin has >2000 counts, and if more than 50% of those come from <1% of pixels, then it is considered to be noise-dominated and hence unusable.
| Quadrant | # 1 sec bins | Bins with >0 counts | Bins with >2000 counts | High rate bins dominated by noise | Noise dominated (total time) | Noise dominated (detector-on time) | Marked lightcurve |
|---|---|---|---|---|---|---|---|
| A | 21221 | 3673 | 6 | 6 | 0.03% | 0.16% | 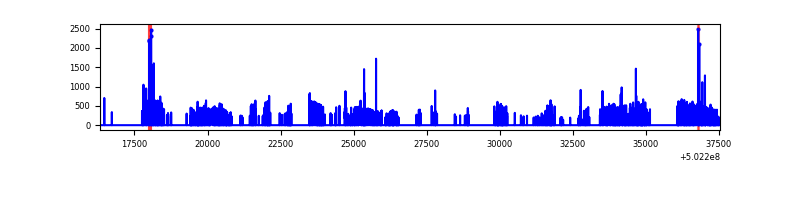 |
| B | 21191 | 3865 | 19 | 19 | 0.09% | 0.49% | 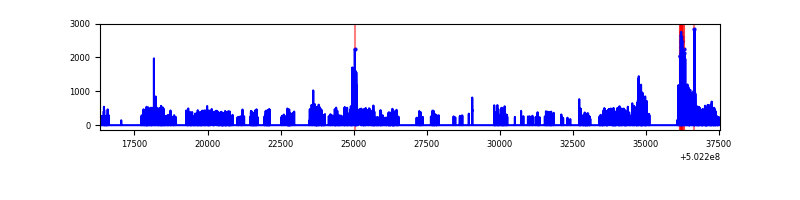 |
| C | 21188 | 4069 | 1 | 1 | 0.00% | 0.02% | 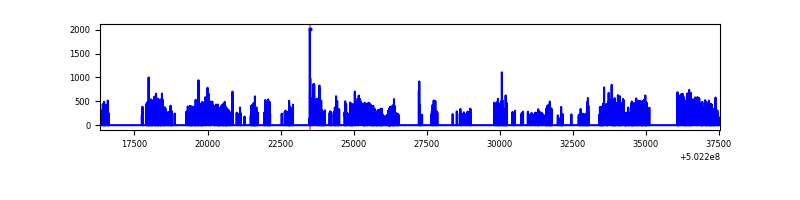 |
| D | 20956 | 1988 | 76 | 76 | 0.36% | 3.82% | 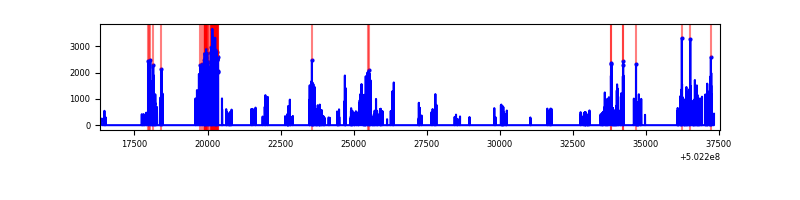 |
Top three noisy pixels from each quadrant. If the there are fewer than three noisy pixels in the level2.evt file, extra rows are filled as -1
| Pixel properties | Quadrant properties | ||||||
|---|---|---|---|---|---|---|---|
| Quadrant | DetID | PixID | Counts | Sigma | Mean | Median | Sigma |
| A | 0 | 8 | 47803 | 747.52 | 253 | 246 | 63.6 |
| A | 10 | 253 | 42268 | 660.52 | 253 | 246 | 63.6 |
| A | 3 | 95 | 12795 | 197.25 | 253 | 246 | 63.6 |
| B | 4 | 81 | 116060 | 2039.49 | 255 | 246 | 56.8 |
| B | 5 | 185 | 37591 | 657.65 | 255 | 246 | 56.8 |
| B | 12 | 111 | 6813 | 115.65 | 255 | 246 | 56.8 |
| C | 12 | 252 | 15822 | 200.14 | 275 | 271 | 77.7 |
| C | 13 | 3 | 15491 | 195.88 | 275 | 271 | 77.7 |
| C | 1 | 16 | 13818 | 174.35 | 275 | 271 | 77.7 |
| D | 11 | 129 | 405519 | 10872.26 | 125 | 120 | 37.3 |
| D | 15 | 94 | 175146 | 4693.96 | 125 | 120 | 37.3 |
| D | 10 | 181 | 24011 | 640.72 | 125 | 120 | 37.3 |
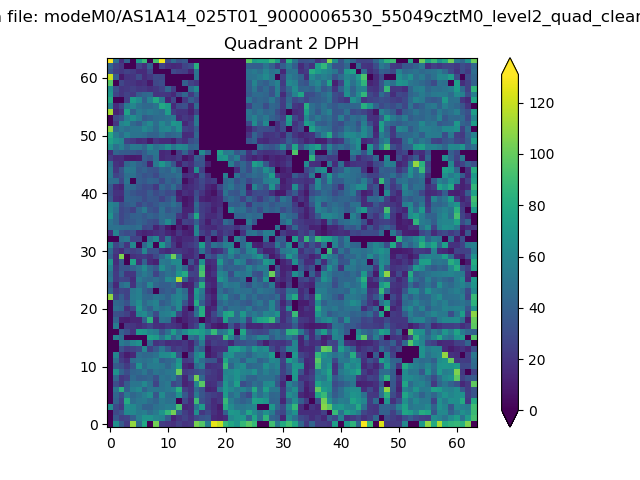
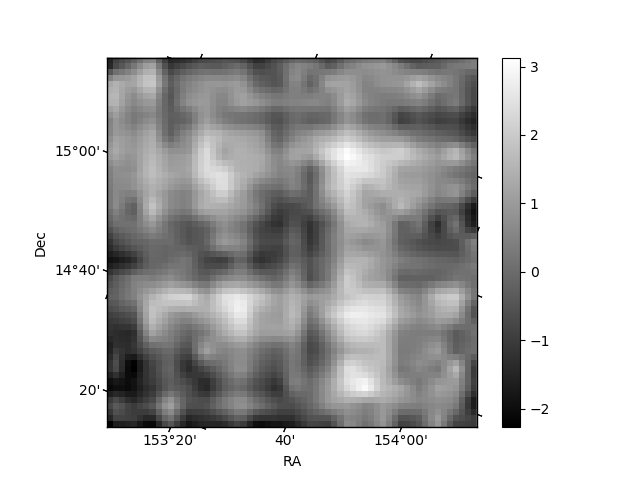
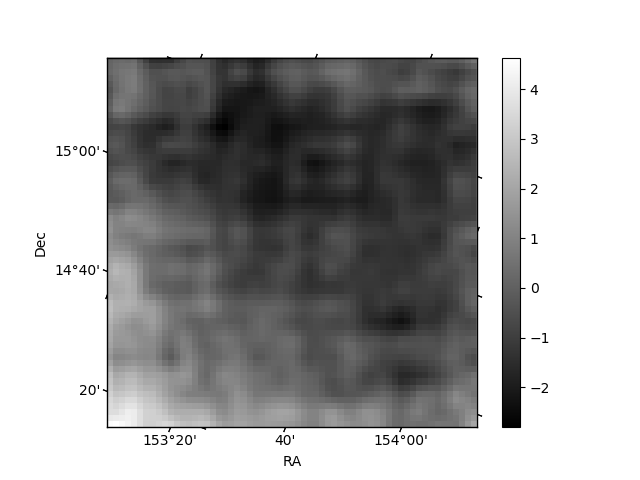
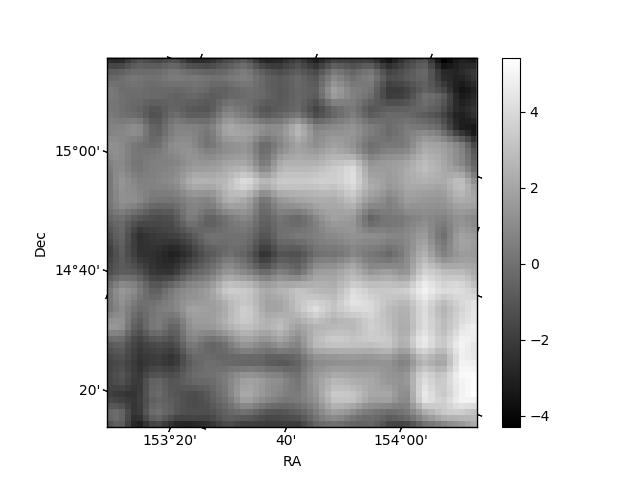
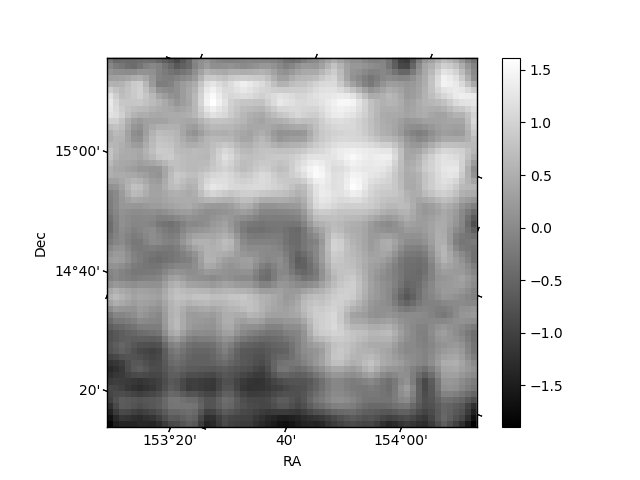
Histogram calculated using DETX and DETY for each event in the final _common_clean file
| Quadrant A | 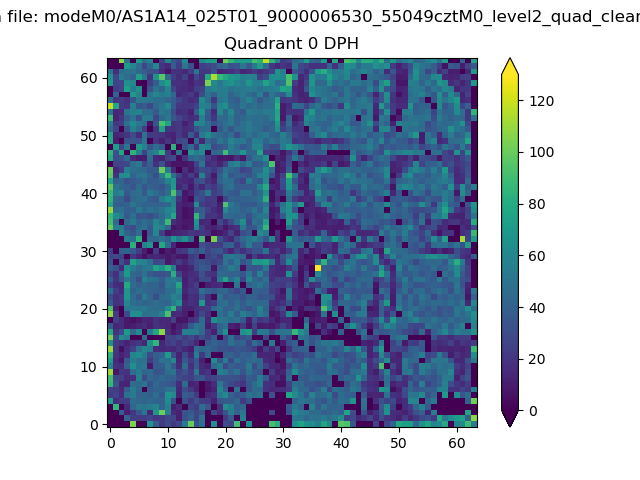 |
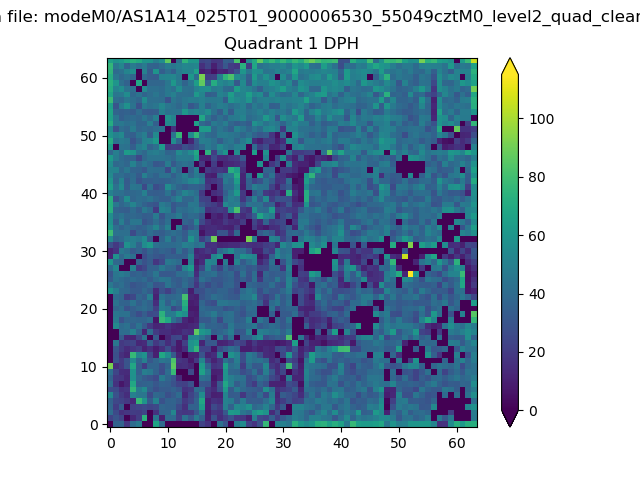 |
Quadrant B |
|---|---|---|---|
| Quadrant D | 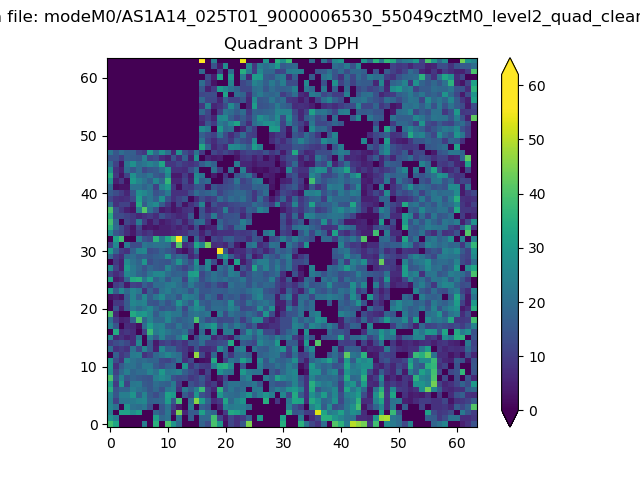 |
 |
Quadrant C |
| Plot type | Count rate plots | Images |
|---|---|---|
| Comparison with Poisson distribution Blue bars denote a histogram of data divided into 1 sec bins. Red curve is a Poisson curve with rate = median count rate of data. |
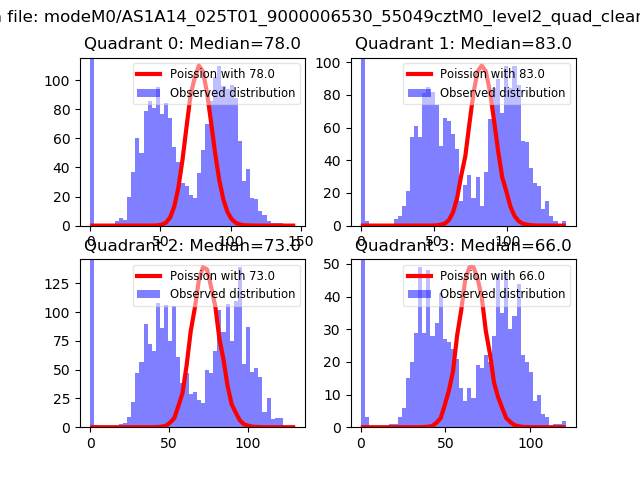 |
 |
| Quadrant-wise count rates Data is divided into 100 sec bins |
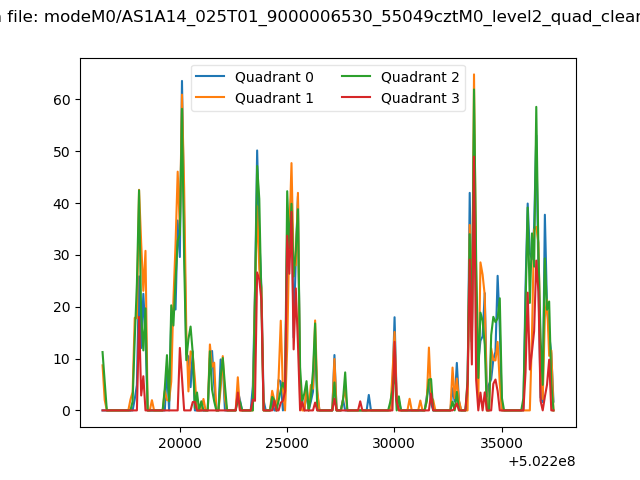 |
|
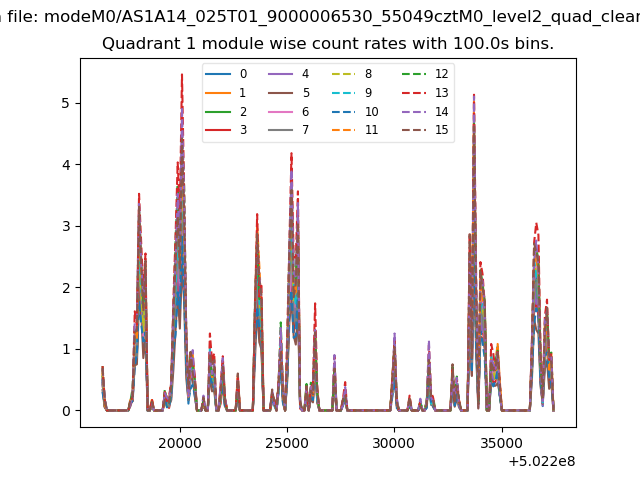
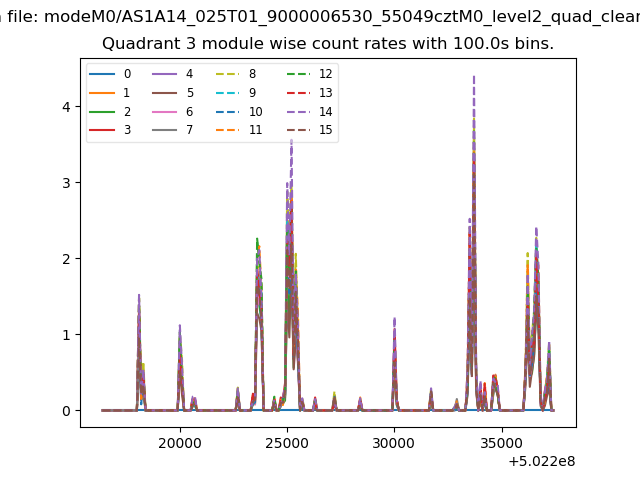
| Module-wise count rates for Quadrant A Data is divided into 100 sec bins |
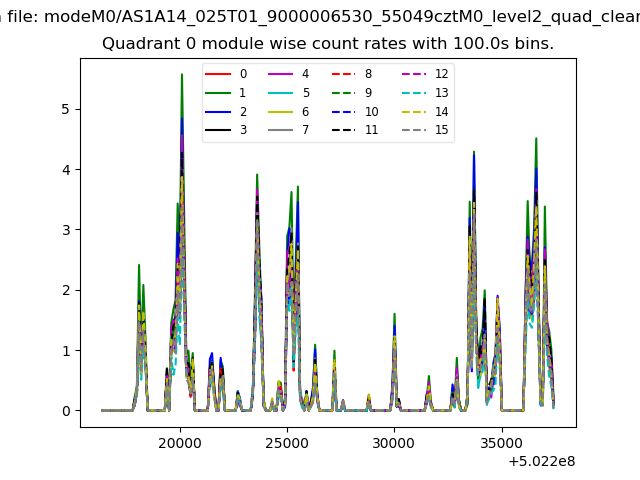 |
 |
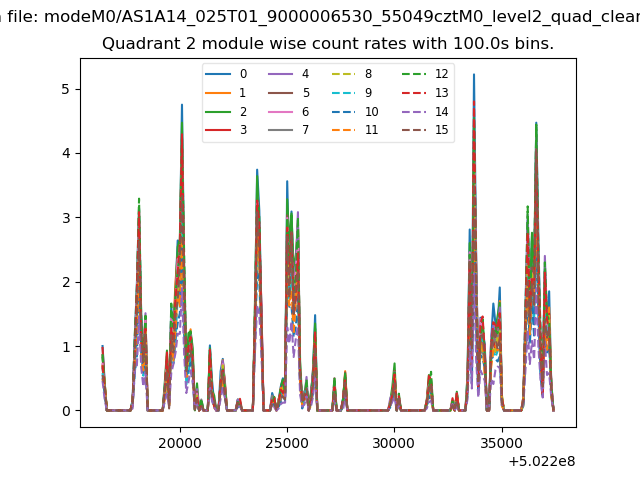
| Module-wise count rates for Quadrant B Data is divided into 100 sec bins |
 |
 |
| Module-wise count rates for Quadrant C Data is divided into 100 sec bins |
 |
 |
| Module-wise count rates for Quadrant D Data is divided into 100 sec bins |
 |
 |
| Parameter | Plot |
|---|---|
| CZT HV Monitor | 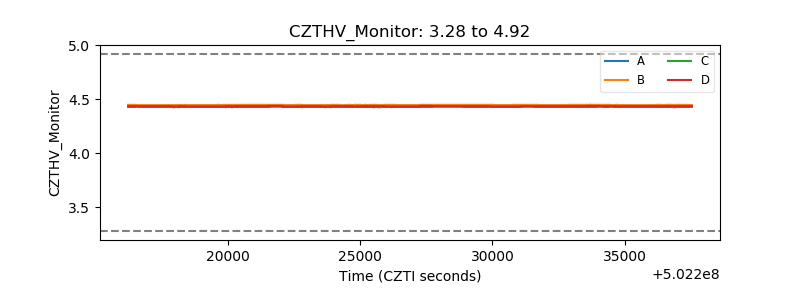 |
| D_VDD | 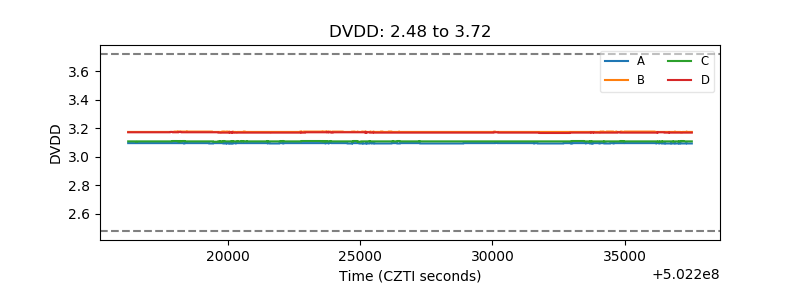 |
| Temperature 1 |  |
| Veto HV Monitor | 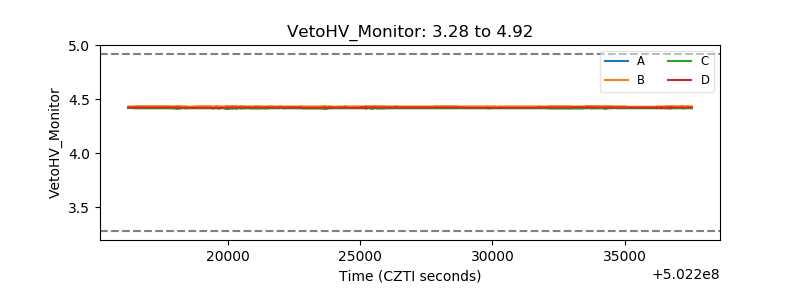 |
| Veto LLD | 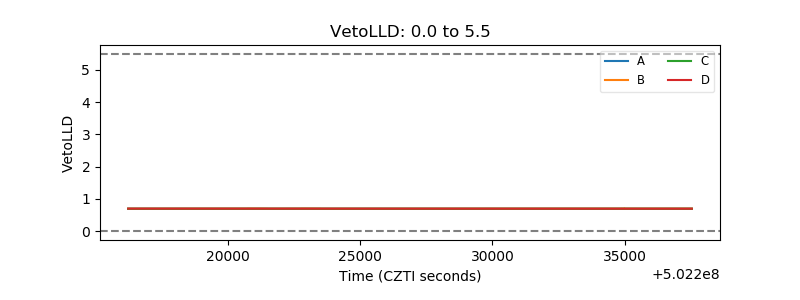 |
| Alpha Counter | 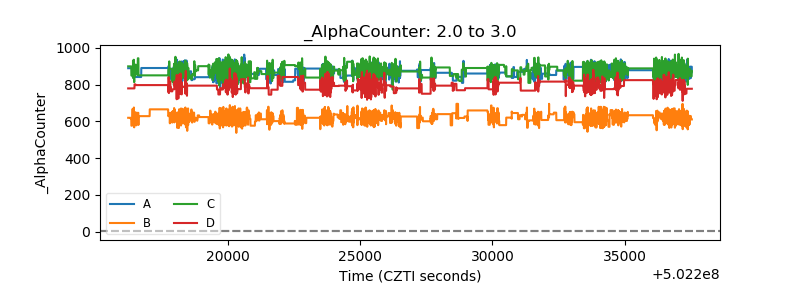 |
| _CPM_Rate | 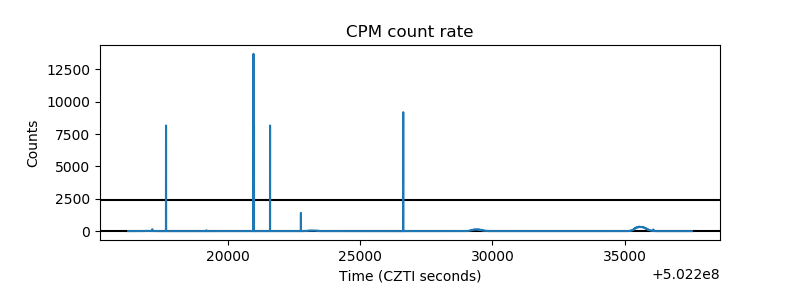 |
| CZT Counter |  |
| +2.5 Volts monitor |  |
| +5 Volts monitor |  |
| _ROLL_ROT | 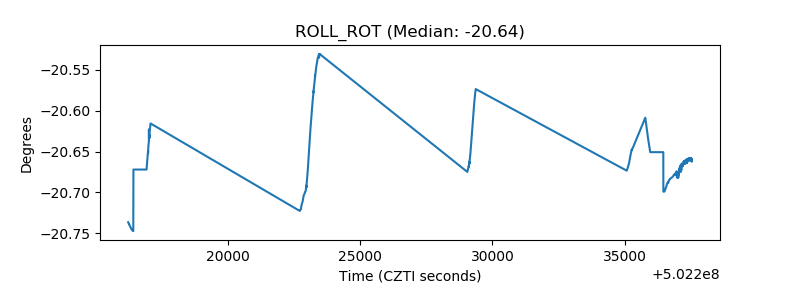 |
| _Roll_DEC | 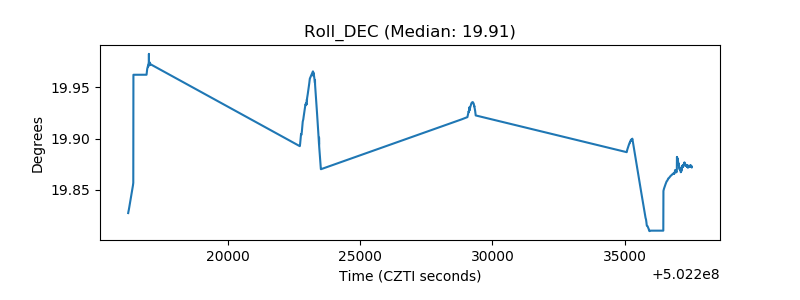 |
| _Roll_RA | 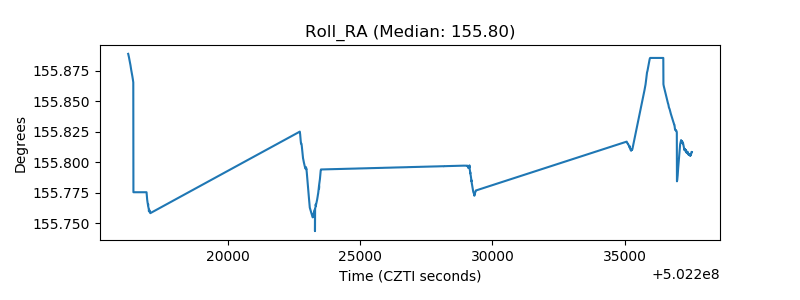 |
| Veto Counter | 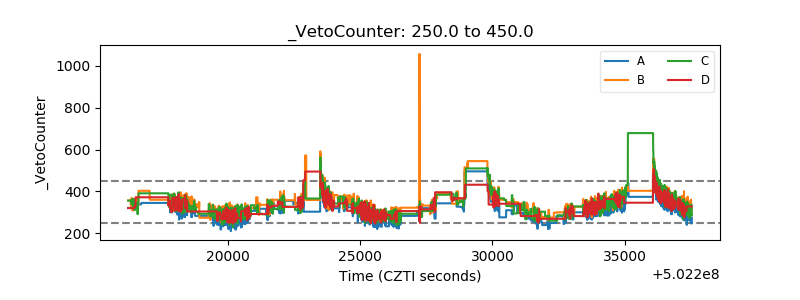 |