| Param | Original file | Final file |
|---|---|---|
| Filename | modeM0/AS1A14_025T01_9000006530_55052cztM0_level2.fits | modeM0/AS1A14_025T01_9000006530_55052cztM0_level2_quad_clean.evt |
| Size (bytes) | 1,970,124,480 | 277,997,760 |
| Size | 1.8 GB | 265.1 MB |
| Events in quadrant A | 16,544,893 | 1,702,914 |
| Events in quadrant B | 10,829,953 | 2,178,201 |
| Events in quadrant C | 10,420,721 | 1,941,475 |
| Events in quadrant D | 33,474,166 | 1,117,581 |
| Mode M0 | |||
|---|---|---|---|
| Quadrant | BADHDUFLAG | Total packets | Discarded packets |
| A | 0 | 68564 | 3427 |
| B | 0 | 50721 | 2639 |
| C | 0 | 49513 | 2683 |
| D | 0 | 126043 | 11944 |
| Mode SS | |||
|---|---|---|---|
| Quadrant | BADHDUFLAG | Total packets | Discarded packets |
| A | 0 | 460 | 22 |
| B | 0 | 463 | 23 |
| C | 0 | 461 | 21 |
| D | 0 | 458 | 20 |
| Mode M9 | |||
|---|---|---|---|
| Quadrant | BADHDUFLAG | Total packets | Discarded packets |
| A | 0 | 20 | 0 |
| B | 0 | 20 | 0 |
| C | 0 | 20 | 0 |
| D | 0 | 21 | 0 |
| Quadrant | Total seconds | Saturated seconds | Saturation percentage |
|---|---|---|---|
| A | 21503 | 3670 | 17.067386% |
| B | 21528 | 515 | 2.392233% |
| C | 21562 | 278 | 1.289305% |
| D | 21104 | 8642 | 40.949583% |
Noise dominated data is calculated using 1-second bins in cleaned event files. If a bin has >2000 counts, and if more than 50% of those come from <1% of pixels, then it is considered to be noise-dominated and hence unusable.
| Quadrant | # 1 sec bins | Bins with >0 counts | Bins with >2000 counts | High rate bins dominated by noise | Noise dominated (total time) | Noise dominated (detector-on time) | Marked lightcurve |
|---|---|---|---|---|---|---|---|
| A | 45022 | 21798 | 1882 | 1882 | 4.18% | 8.63% | 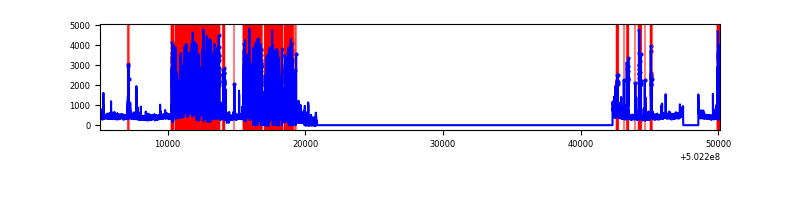 |
| B | 45022 | 21847 | 143 | 143 | 0.32% | 0.65% | 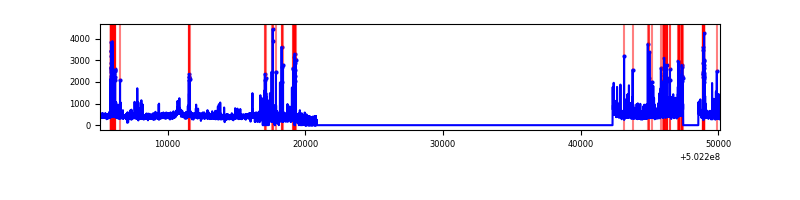 |
| C | 45022 | 21850 | 108 | 108 | 0.24% | 0.49% | 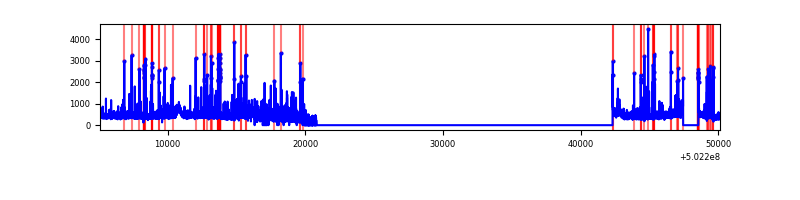 |
| D | 45022 | 21375 | 7023 | 7023 | 15.60% | 32.86% | 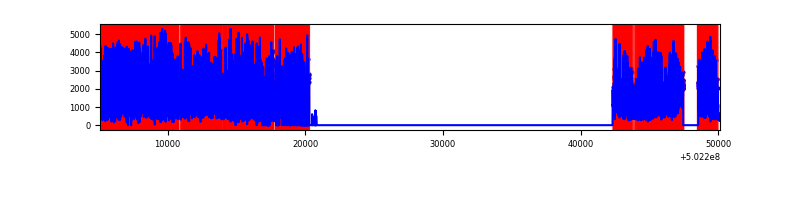 |
Top three noisy pixels from each quadrant. If the there are fewer than three noisy pixels in the level2.evt file, extra rows are filled as -1
| Pixel properties | Quadrant properties | ||||||
|---|---|---|---|---|---|---|---|
| Quadrant | DetID | PixID | Counts | Sigma | Mean | Median | Sigma |
| A | 10 | 253 | 6614335 | 12970.16 | 2068 | 2019 | 509.8 |
| A | 0 | 8 | 1645040 | 3222.81 | 2068 | 2019 | 509.8 |
| A | 0 | 250 | 76635 | 146.36 | 2068 | 2019 | 509.8 |
| B | 4 | 81 | 745649 | 1494.92 | 2317 | 2227 | 497.3 |
| B | 5 | 185 | 612546 | 1227.27 | 2317 | 2227 | 497.3 |
| B | 0 | 182 | 93537 | 183.61 | 2317 | 2227 | 497.3 |
| C | 1 | 16 | 261495 | 415.6 | 2292 | 2274 | 623.7 |
| C | 12 | 252 | 247136 | 392.58 | 2292 | 2274 | 623.7 |
| C | 15 | 193 | 186159 | 294.82 | 2292 | 2274 | 623.7 |
| D | 11 | 129 | 16092392 | 31491.63 | 1799 | 1716 | 511.0 |
| D | 15 | 94 | 7137581 | 13965.85 | 1799 | 1716 | 511.0 |
| D | 6 | 239 | 640224 | 1249.65 | 1799 | 1716 | 511.0 |
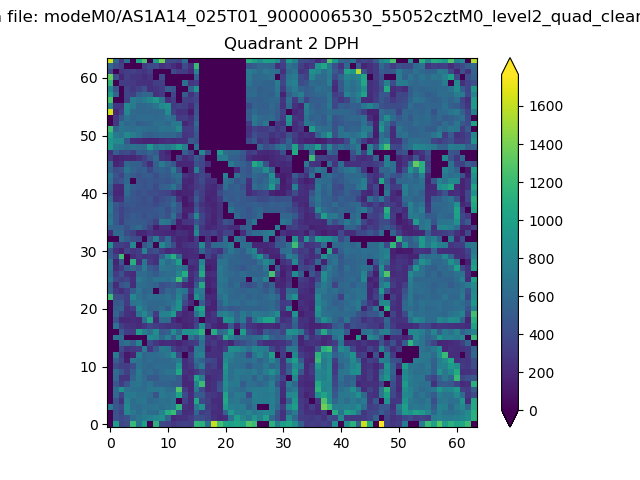
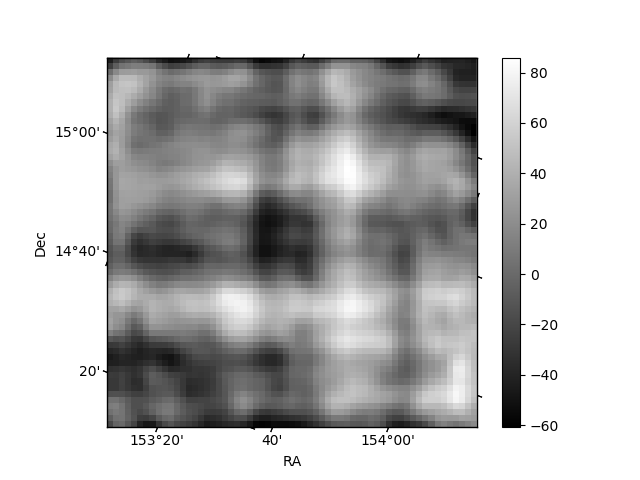
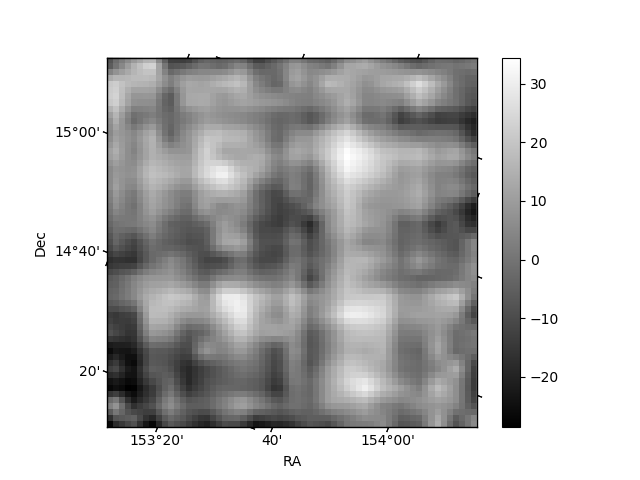
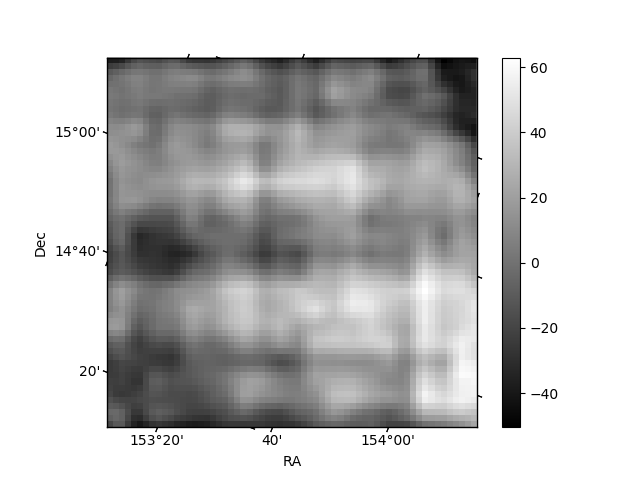
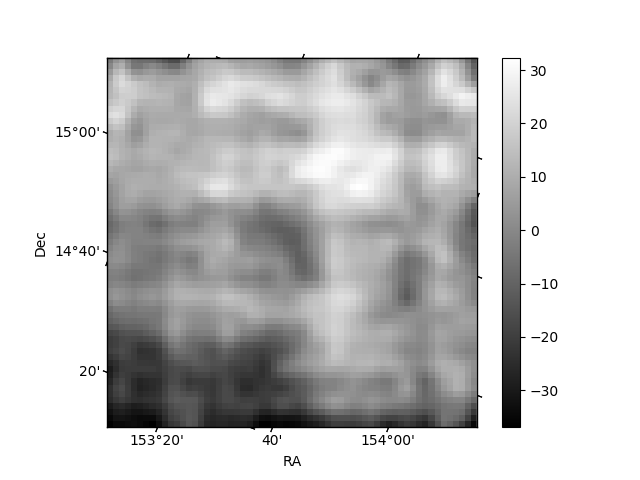
Histogram calculated using DETX and DETY for each event in the final _common_clean file
| Quadrant A | 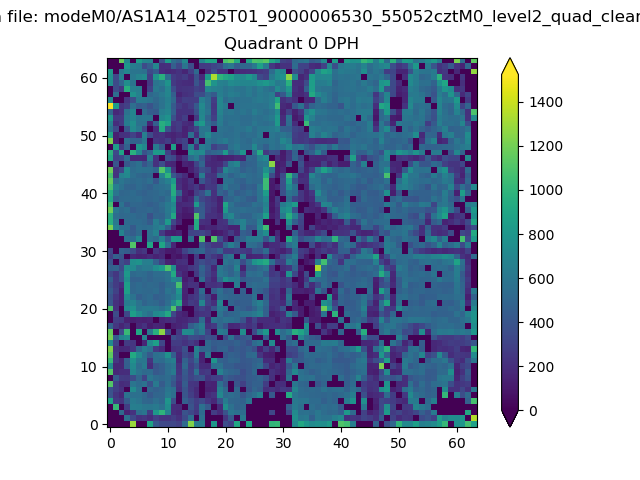 |
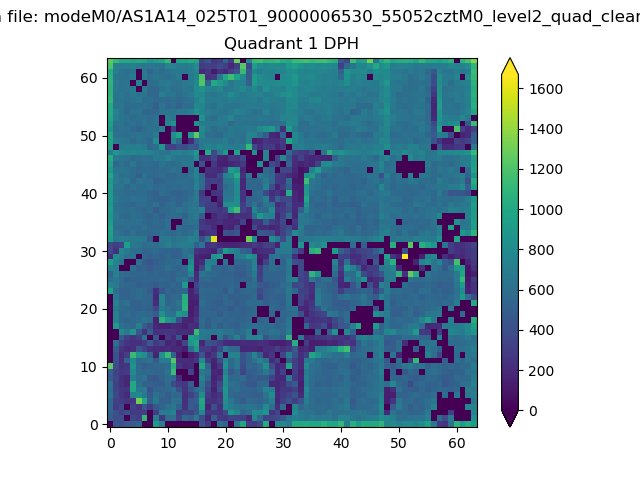 |
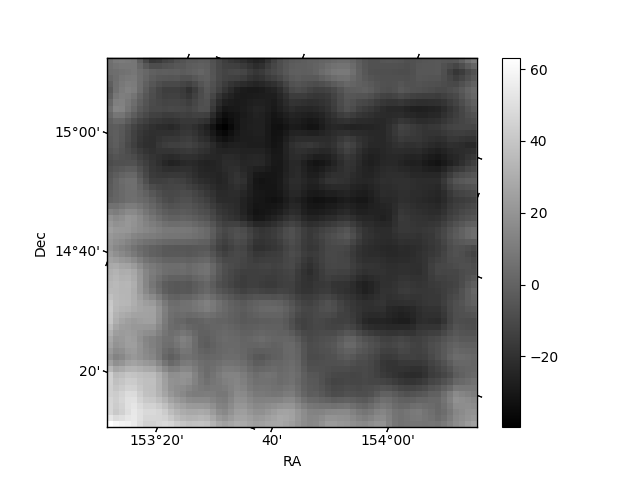
Quadrant B |
|---|---|---|---|
| Quadrant D | 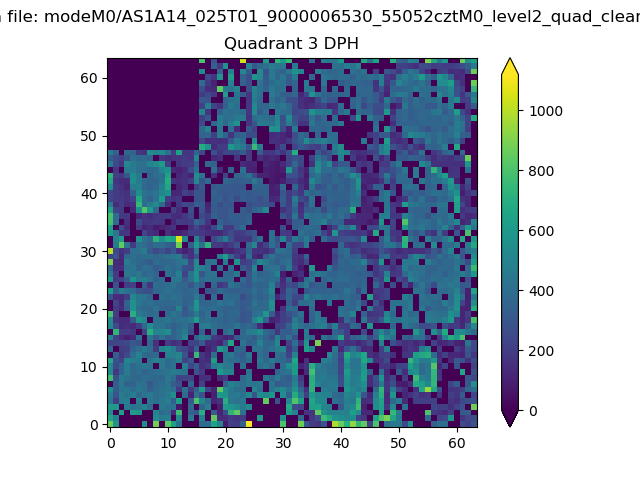 |
 |
Quadrant C |
| Plot type | Count rate plots | Images |
|---|---|---|
| Comparison with Poisson distribution Blue bars denote a histogram of data divided into 1 sec bins. Red curve is a Poisson curve with rate = median count rate of data. |
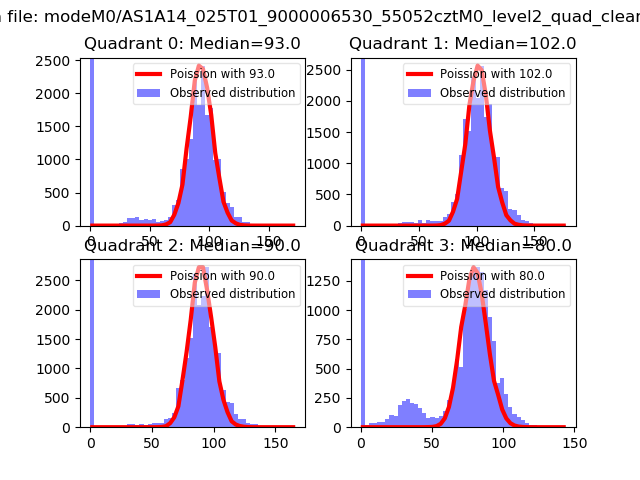 |
 |
| Quadrant-wise count rates Data is divided into 100 sec bins |
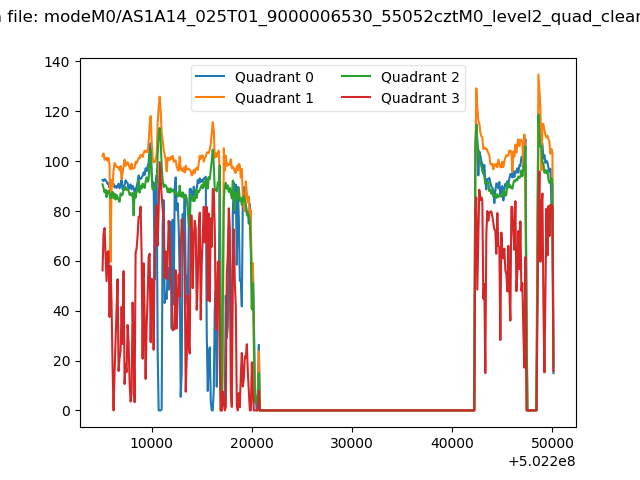 |
|
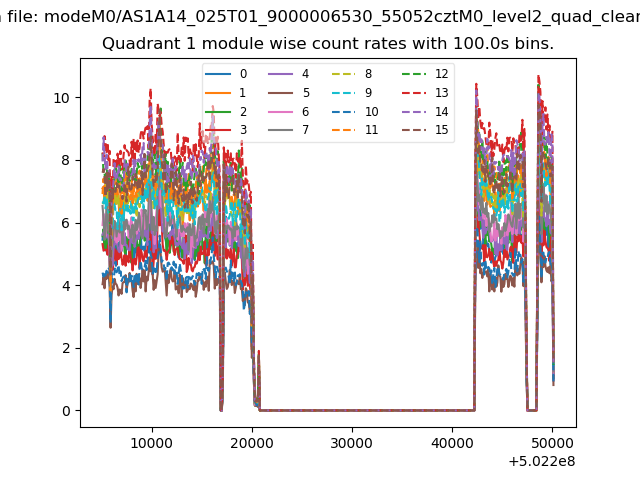
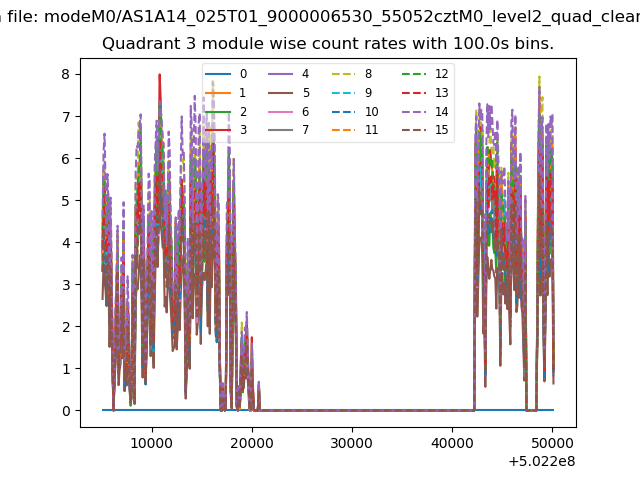
| Module-wise count rates for Quadrant A Data is divided into 100 sec bins |
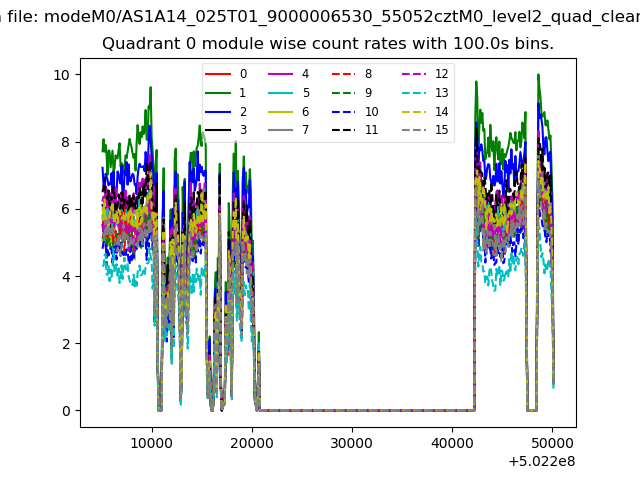 |
 |
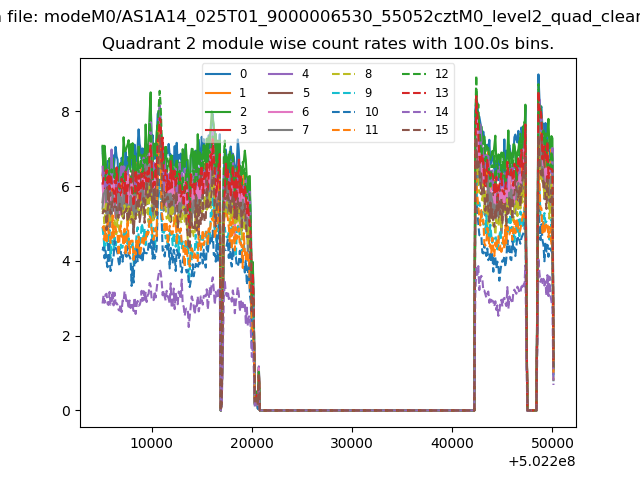
| Module-wise count rates for Quadrant B Data is divided into 100 sec bins |
 |
 |
| Module-wise count rates for Quadrant C Data is divided into 100 sec bins |
 |
 |
| Module-wise count rates for Quadrant D Data is divided into 100 sec bins |
 |
 |
| Parameter | Plot |
|---|---|
| CZT HV Monitor | 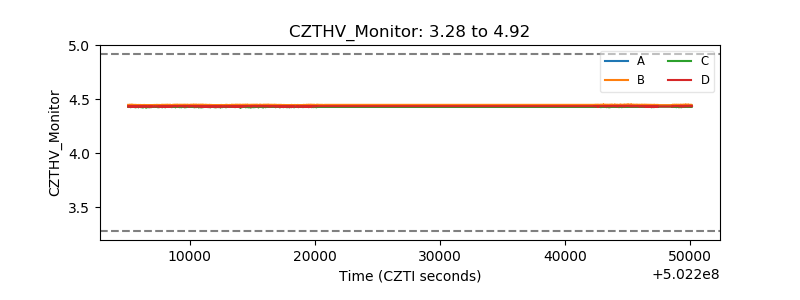 |
| D_VDD | 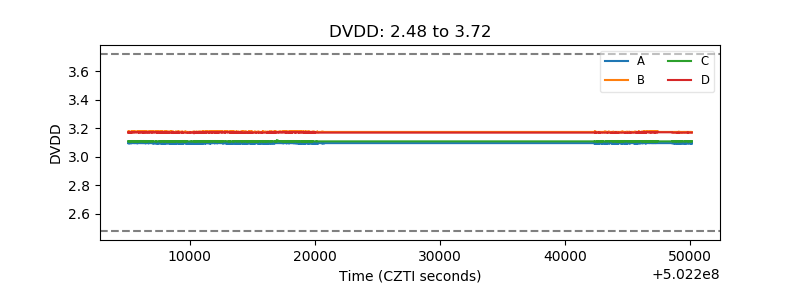 |
| Temperature 1 | 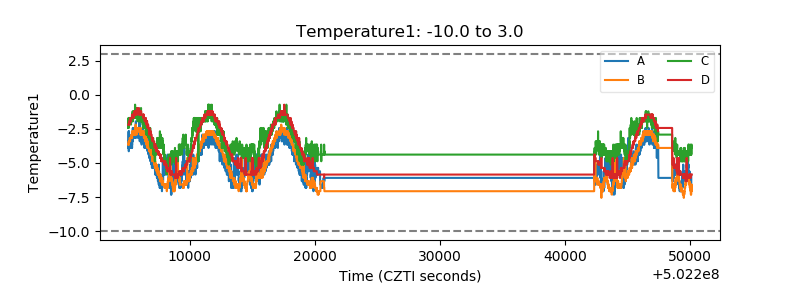 |
| Veto HV Monitor |  |
| Veto LLD | 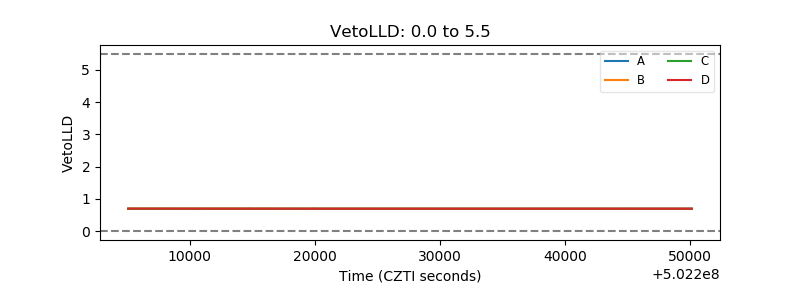 |
| Alpha Counter | 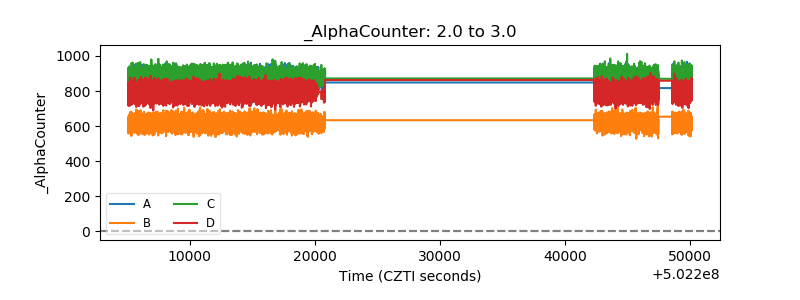 |
| _CPM_Rate | 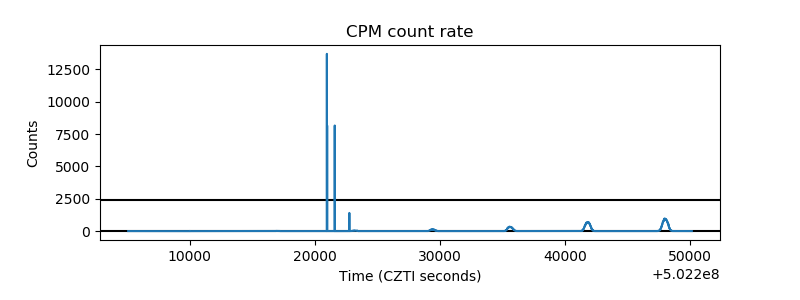 |
| CZT Counter | 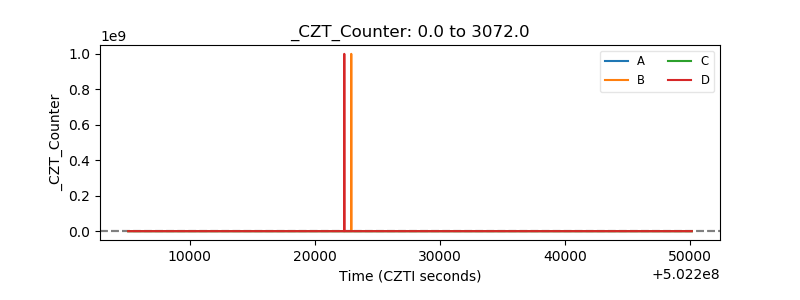 |
| +2.5 Volts monitor | 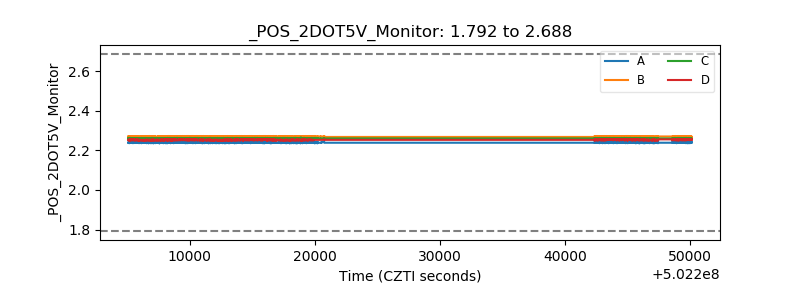 |
| +5 Volts monitor |  |
| _ROLL_ROT | 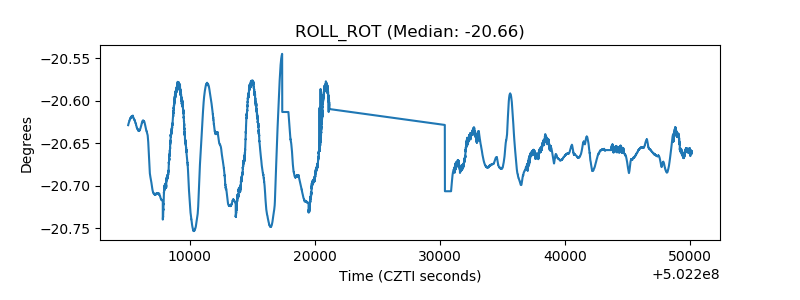 |
| _Roll_DEC | 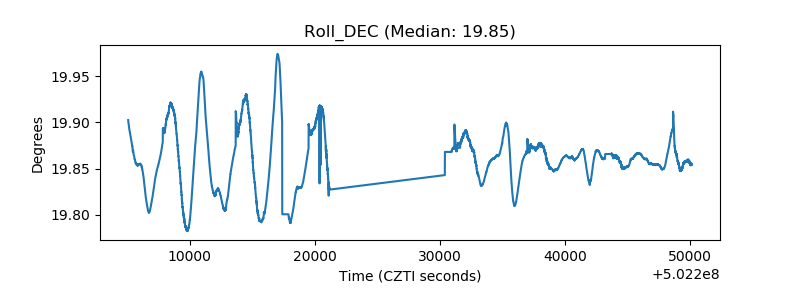 |
| _Roll_RA | 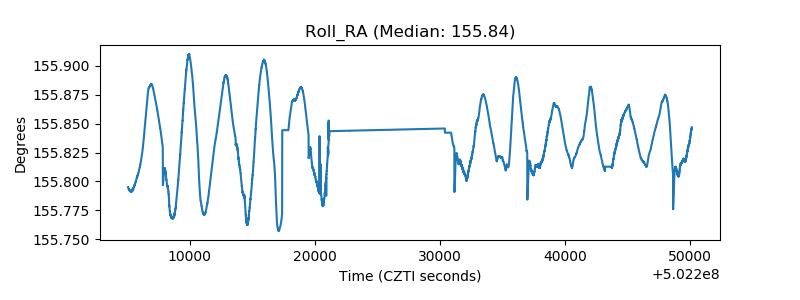 |
| Veto Counter | 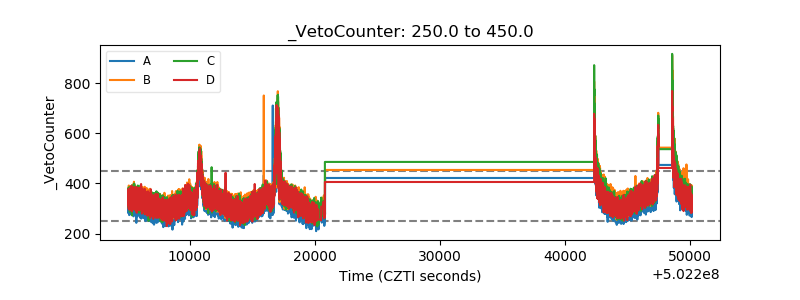 |