| Param | Original file | Final file |
|---|---|---|
| Filename | modeM0/AS1A14_025T01_9000006530_55053cztM0_level2.fits | modeM0/AS1A14_025T01_9000006530_55053cztM0_level2_quad_clean.evt |
| Size (bytes) | 2,679,186,240 | 398,217,600 |
| Size | 2.5 GB | 379.8 MB |
| Events in quadrant A | 22,102,111 | 2,543,104 |
| Events in quadrant B | 14,650,837 | 3,080,115 |
| Events in quadrant C | 14,668,985 | 2,740,319 |
| Events in quadrant D | 45,423,375 | 1,621,734 |
| Mode M0 | |||
|---|---|---|---|
| Quadrant | BADHDUFLAG | Total packets | Discarded packets |
| A | 0 | 91194 | 3140 |
| B | 0 | 69532 | 3612 |
| C | 0 | 69250 | 3351 |
| D | 0 | 164765 | 9058 |
| Mode SS | |||
|---|---|---|---|
| Quadrant | BADHDUFLAG | Total packets | Discarded packets |
| A | 0 | 644 | 32 |
| B | 0 | 643 | 25 |
| C | 0 | 645 | 31 |
| D | 0 | 644 | 32 |
| Mode M9 | |||
|---|---|---|---|
| Quadrant | BADHDUFLAG | Total packets | Discarded packets |
| A | 0 | 36 | 6 |
| B | 0 | 36 | 4 |
| C | 0 | 36 | 3 |
| D | 0 | 36 | 5 |
| Quadrant | Total seconds | Saturated seconds | Saturation percentage |
|---|---|---|---|
| A | 30189 | 4209 | 13.942164% |
| B | 30129 | 719 | 2.386405% |
| C | 30170 | 486 | 1.610872% |
| D | 30008 | 11279 | 37.586644% |
Noise dominated data is calculated using 1-second bins in cleaned event files. If a bin has >2000 counts, and if more than 50% of those come from <1% of pixels, then it is considered to be noise-dominated and hence unusable.
| Quadrant | # 1 sec bins | Bins with >0 counts | Bins with >2000 counts | High rate bins dominated by noise | Noise dominated (total time) | Noise dominated (detector-on time) | Marked lightcurve |
|---|---|---|---|---|---|---|---|
| A | 51339 | 30382 | 2247 | 2247 | 4.38% | 7.40% | 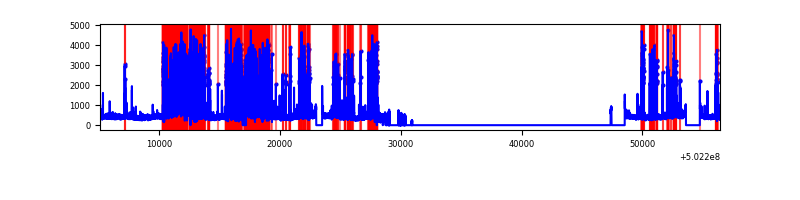 |
| B | 51339 | 30347 | 195 | 195 | 0.38% | 0.64% | 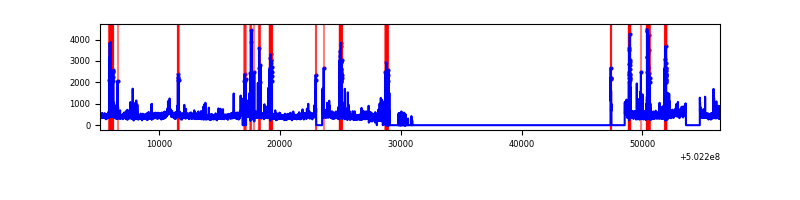 |
| C | 51339 | 30361 | 216 | 216 | 0.42% | 0.71% | 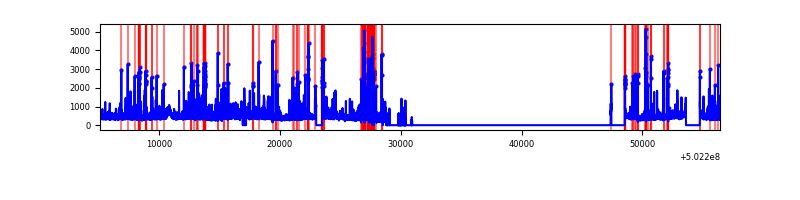 |
| D | 51339 | 30201 | 9460 | 9460 | 18.43% | 31.32% | 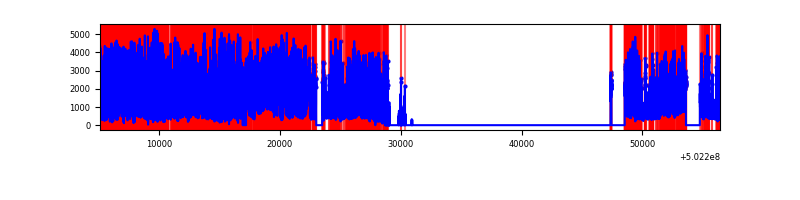 |
Top three noisy pixels from each quadrant. If the there are fewer than three noisy pixels in the level2.evt file, extra rows are filled as -1
| Pixel properties | Quadrant properties | ||||||
|---|---|---|---|---|---|---|---|
| Quadrant | DetID | PixID | Counts | Sigma | Mean | Median | Sigma |
| A | 10 | 253 | 7223430 | 9778.34 | 3002 | 2926 | 738.4 |
| A | 0 | 8 | 2230308 | 3016.42 | 3002 | 2926 | 738.4 |
| A | 3 | 95 | 599686 | 808.16 | 3002 | 2926 | 738.4 |
| B | 5 | 185 | 1116172 | 1607.34 | 3245 | 3124 | 692.5 |
| B | 4 | 81 | 341364 | 488.45 | 3245 | 3124 | 692.5 |
| B | 12 | 111 | 86257 | 120.05 | 3245 | 3124 | 692.5 |
| C | 13 | 3 | 390600 | 437.12 | 3211 | 3179 | 886.3 |
| C | 12 | 252 | 361945 | 404.79 | 3211 | 3179 | 886.3 |
| C | 1 | 16 | 208222 | 231.35 | 3211 | 3179 | 886.3 |
| D | 11 | 129 | 17685343 | 23776.78 | 2607 | 2494 | 743.7 |
| D | 15 | 94 | 12779367 | 17180.09 | 2607 | 2494 | 743.7 |
| D | 6 | 239 | 1010783 | 1355.77 | 2607 | 2494 | 743.7 |
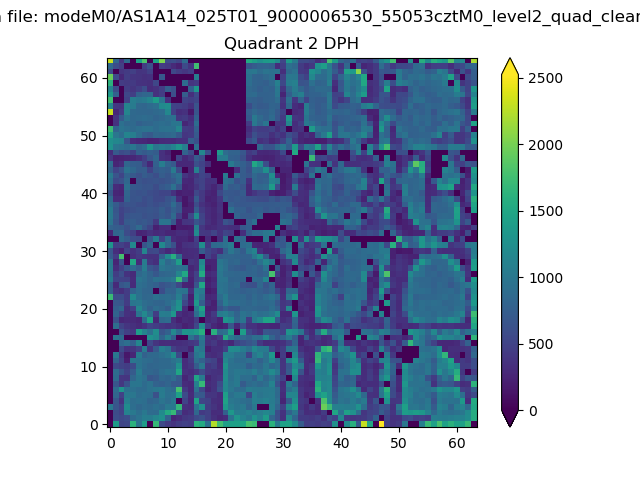
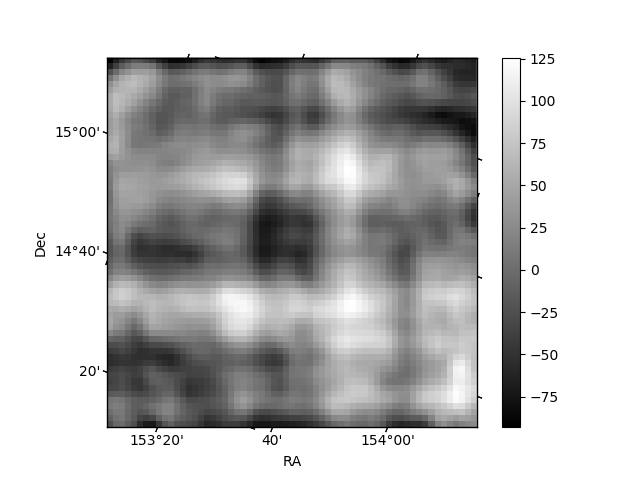
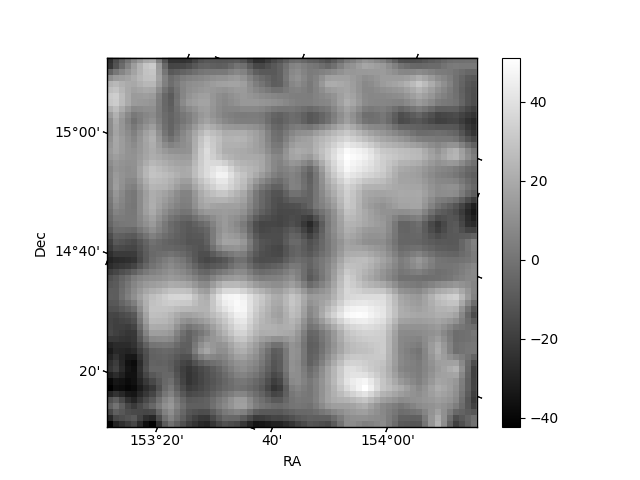
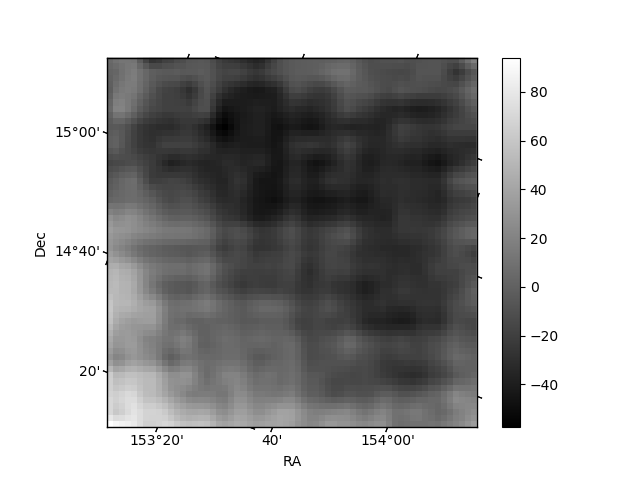
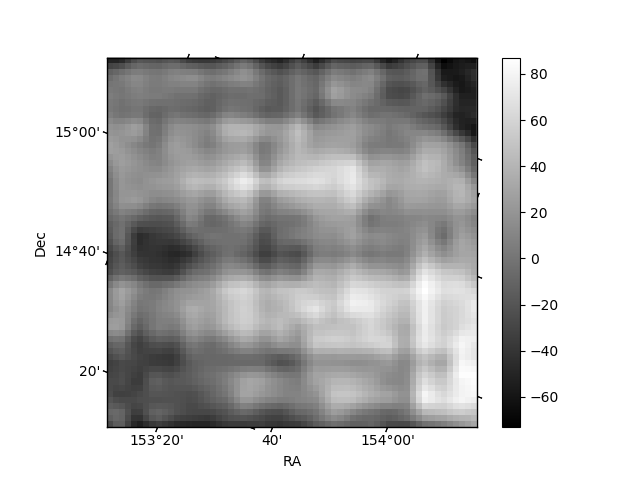
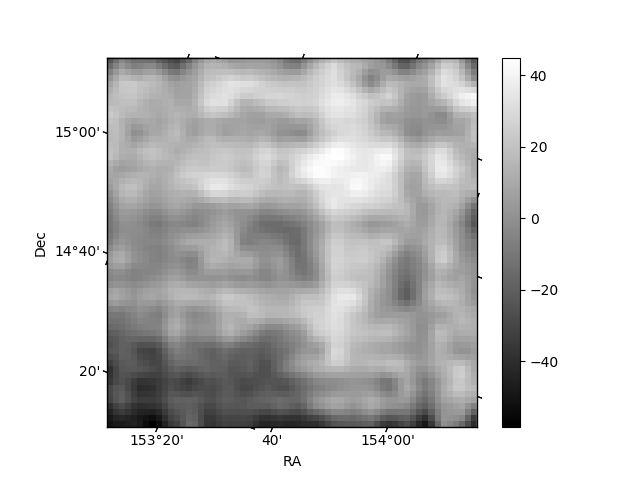
Histogram calculated using DETX and DETY for each event in the final _common_clean file
| Quadrant A | 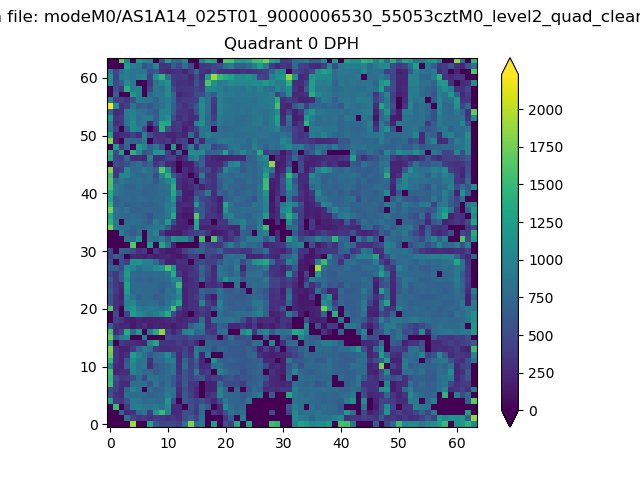 |
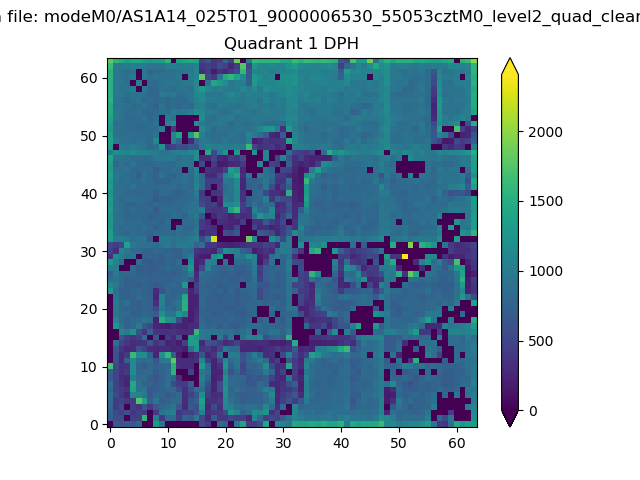 |
Quadrant B |
|---|---|---|---|
| Quadrant D | 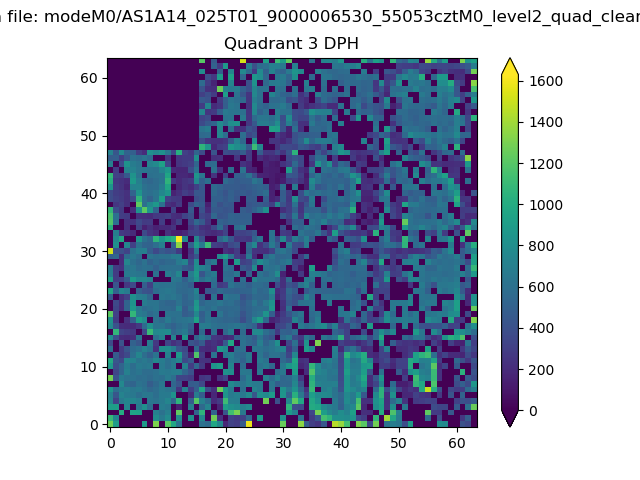 |
 |
Quadrant C |
| Plot type | Count rate plots | Images |
|---|---|---|
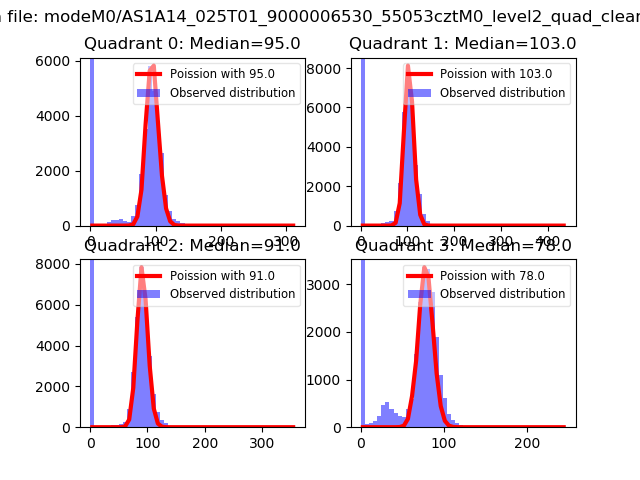
| Comparison with Poisson distribution Blue bars denote a histogram of data divided into 1 sec bins. Red curve is a Poisson curve with rate = median count rate of data. |
 |
 |
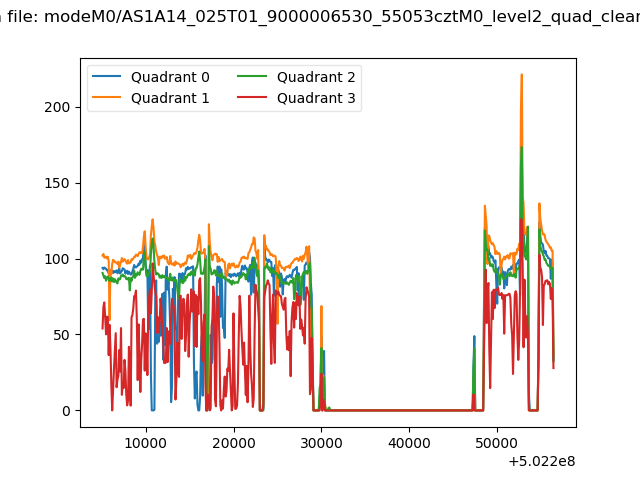
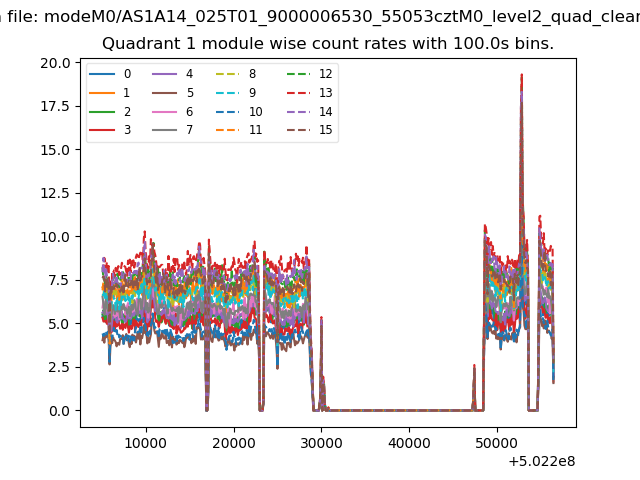
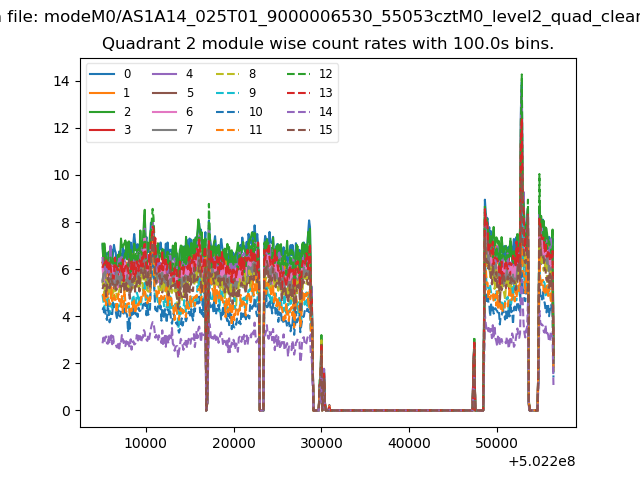
| Quadrant-wise count rates Data is divided into 100 sec bins |
 |
|
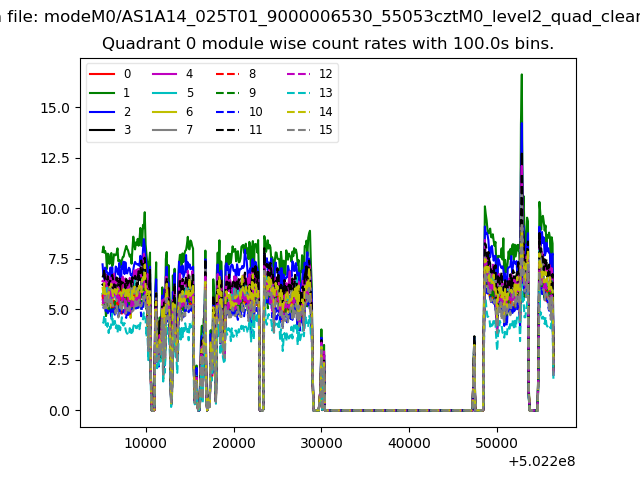
| Module-wise count rates for Quadrant A Data is divided into 100 sec bins |
 |
 |
| Module-wise count rates for Quadrant B Data is divided into 100 sec bins |
 |
 |
| Module-wise count rates for Quadrant C Data is divided into 100 sec bins |
 |
 |
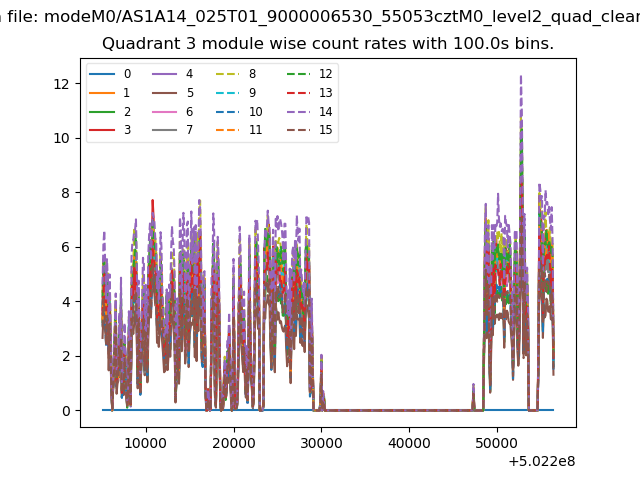
| Module-wise count rates for Quadrant D Data is divided into 100 sec bins |
 |
 |
| Parameter | Plot |
|---|---|
| CZT HV Monitor | 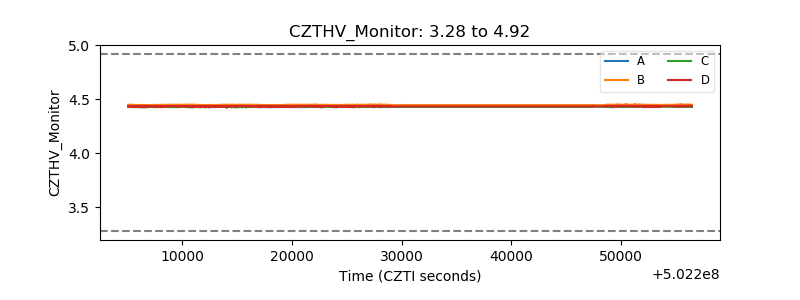 |
| D_VDD | 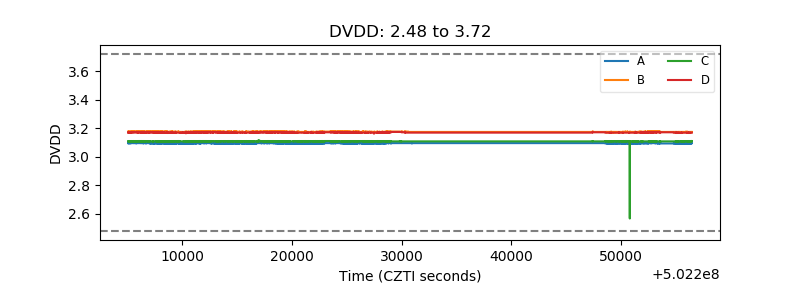 |
| Temperature 1 | 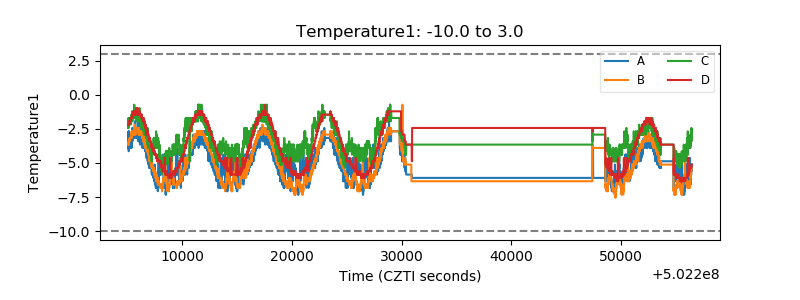 |
| Veto HV Monitor | 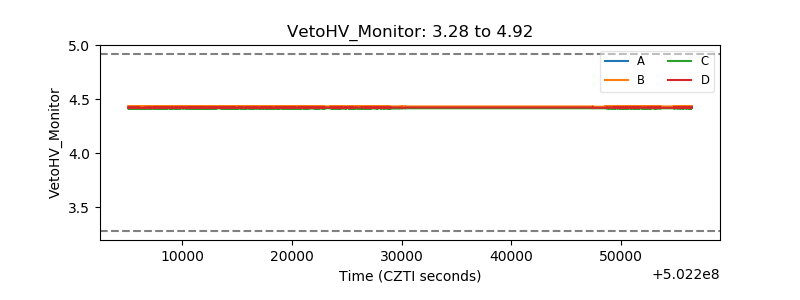 |
| Veto LLD | 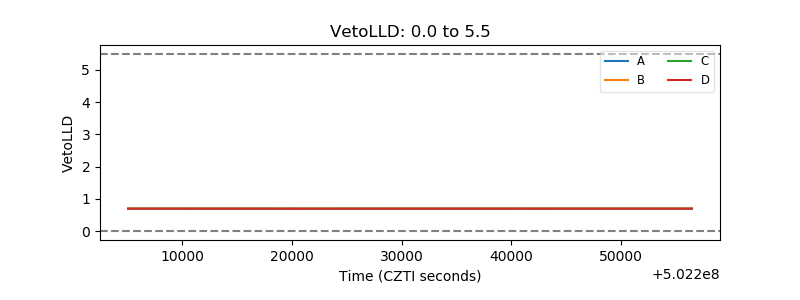 |
| Alpha Counter | 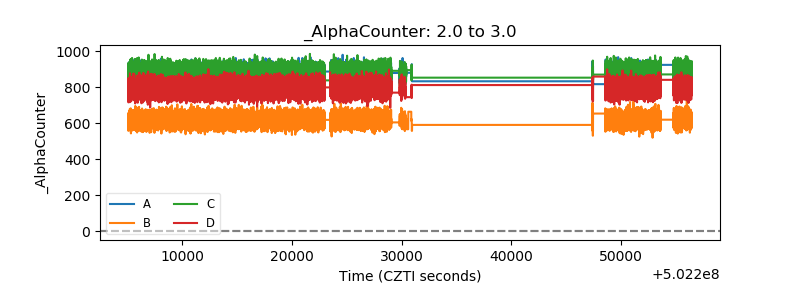 |
| _CPM_Rate | 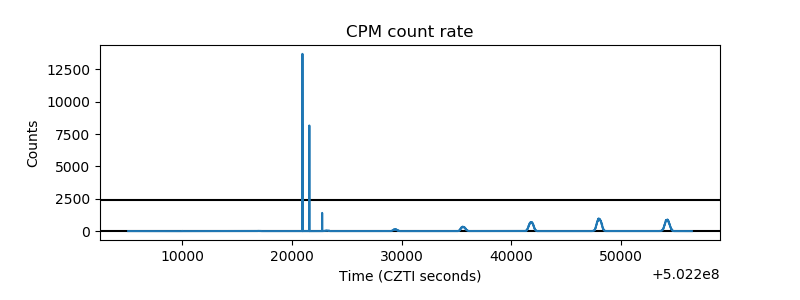 |
| CZT Counter | 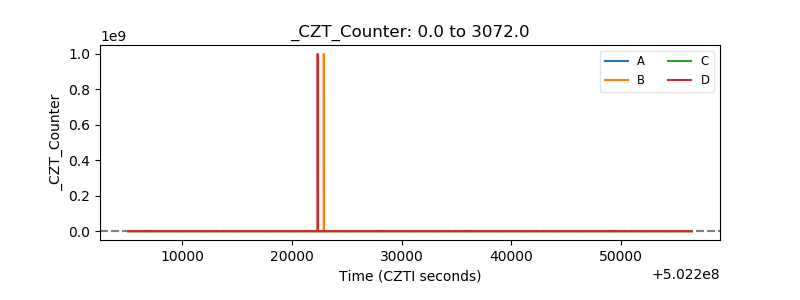 |
| +2.5 Volts monitor |  |
| +5 Volts monitor | 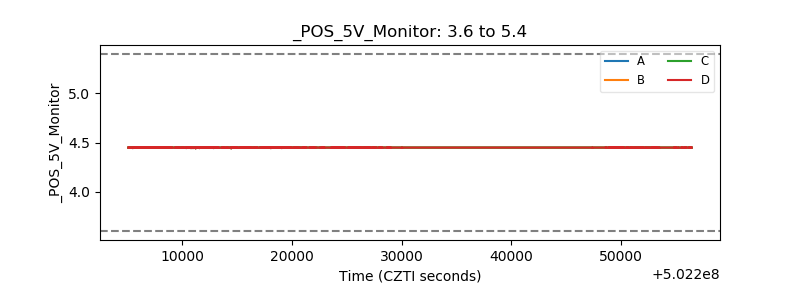 |
| _ROLL_ROT | 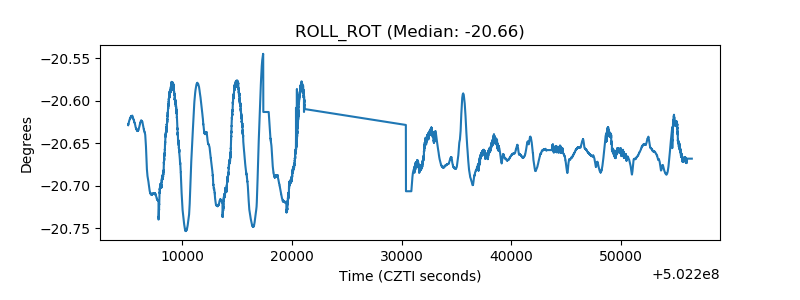 |
| _Roll_DEC | 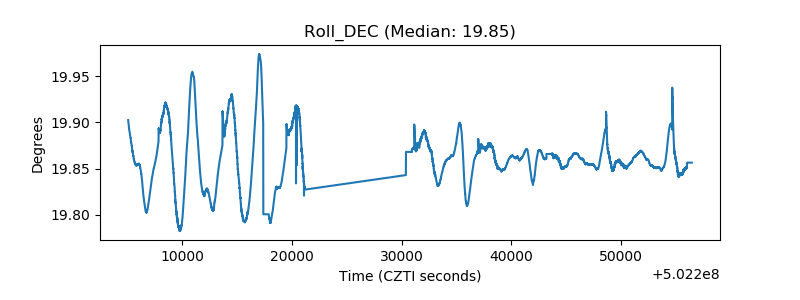 |
| _Roll_RA | 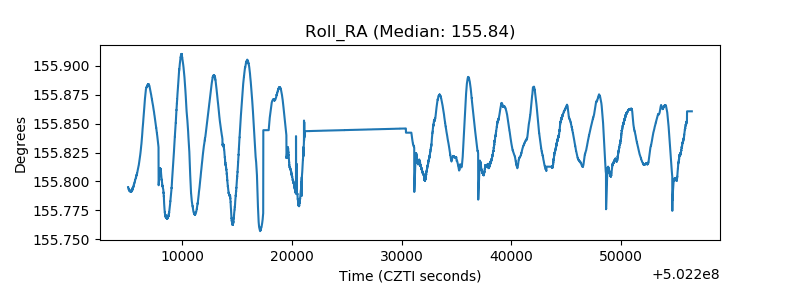 |
| Veto Counter | 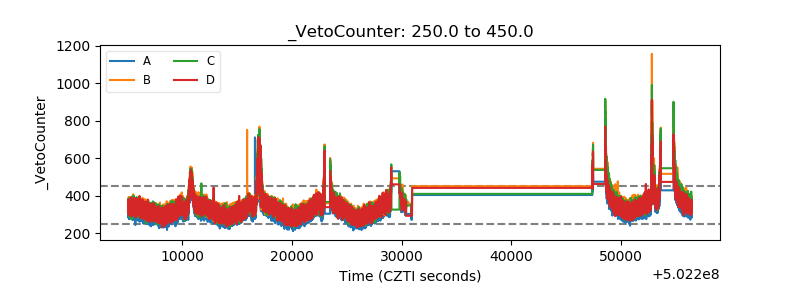 |