| Param | Original file | Final file |
|---|---|---|
| Filename | modeM0/AS1A14_025T01_9000006530_55054cztM0_level2.fits | modeM0/AS1A14_025T01_9000006530_55054cztM0_level2_quad_clean.evt |
| Size (bytes) | 2,053,396,800 | 380,252,160 |
| Size | 1.9 GB | 362.6 MB |
| Events in quadrant A | 13,123,434 | 2,581,375 |
| Events in quadrant B | 14,970,152 | 2,757,045 |
| Events in quadrant C | 13,397,147 | 2,456,095 |
| Events in quadrant D | 32,470,840 | 1,895,742 |
| Mode M0 | |||
|---|---|---|---|
| Quadrant | BADHDUFLAG | Total packets | Discarded packets |
| A | 0 | 58974 | 5 |
| B | 0 | 63412 | 7 |
| C | 0 | 59498 | 5 |
| D | 0 | 115103 | 5 |
| Mode SS | |||
|---|---|---|---|
| Quadrant | BADHDUFLAG | Total packets | Discarded packets |
| A | 0 | 542 | 0 |
| B | 0 | 542 | 0 |
| C | 0 | 542 | 0 |
| D | 0 | 542 | 0 |
| Mode M9 | |||
|---|---|---|---|
| Quadrant | BADHDUFLAG | Total packets | Discarded packets |
| A | 0 | 52 | 0 |
| B | 0 | 52 | 0 |
| C | 0 | 52 | 0 |
| D | 0 | 52 | 0 |
| Quadrant | Total seconds | Saturated seconds | Saturation percentage |
|---|---|---|---|
| A | 26501 | 442 | 1.667862% |
| B | 26500 | 964 | 3.637736% |
| C | 26501 | 542 | 2.045206% |
| D | 26501 | 5767 | 21.761443% |
Noise dominated data is calculated using 1-second bins in cleaned event files. If a bin has >2000 counts, and if more than 50% of those come from <1% of pixels, then it is considered to be noise-dominated and hence unusable.
| Quadrant | # 1 sec bins | Bins with >0 counts | Bins with >2000 counts | High rate bins dominated by noise | Noise dominated (total time) | Noise dominated (detector-on time) | Marked lightcurve |
|---|---|---|---|---|---|---|---|
| A | 31841 | 26506 | 311 | 311 | 0.98% | 1.17% | 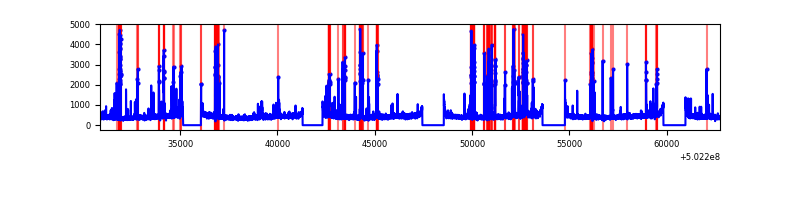 |
| B | 31841 | 26506 | 522 | 522 | 1.64% | 1.97% | 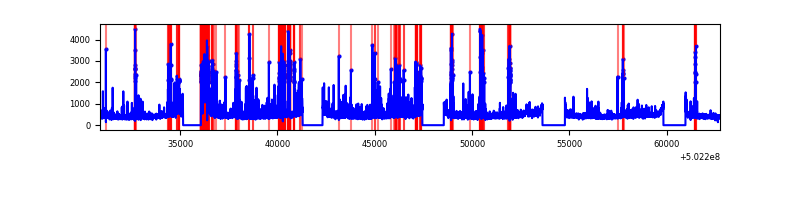 |
| C | 31841 | 26506 | 421 | 421 | 1.32% | 1.59% | 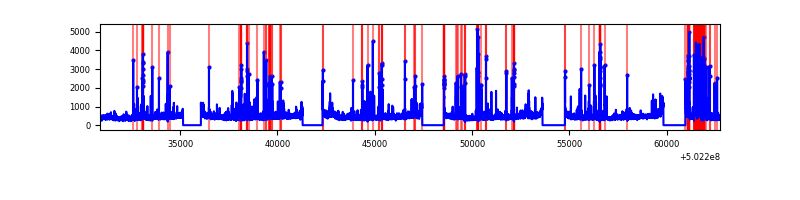 |
| D | 31841 | 26506 | 5069 | 5069 | 15.92% | 19.12% | 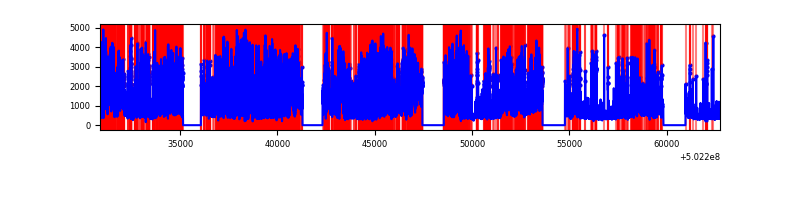 |
Top three noisy pixels from each quadrant. If the there are fewer than three noisy pixels in the level2.evt file, extra rows are filled as -1
| Pixel properties | Quadrant properties | ||||||
|---|---|---|---|---|---|---|---|
| Quadrant | DetID | PixID | Counts | Sigma | Mean | Median | Sigma |
| A | 0 | 8 | 1568778 | 2244.27 | 2872 | 2808 | 697.8 |
| A | 0 | 250 | 88409 | 122.68 | 2872 | 2808 | 697.8 |
| A | 5 | 241 | 61823 | 84.58 | 2872 | 2808 | 697.8 |
| B | 4 | 81 | 3037302 | 5049.53 | 2820 | 2710 | 601.0 |
| B | 5 | 185 | 580507 | 961.45 | 2820 | 2710 | 601.0 |
| B | 12 | 111 | 73603 | 117.96 | 2820 | 2710 | 601.0 |
| C | 12 | 250 | 906451 | 1185.41 | 2784 | 2758 | 762.3 |
| C | 13 | 3 | 601012 | 784.76 | 2784 | 2758 | 762.3 |
| C | 12 | 252 | 216744 | 280.69 | 2784 | 2758 | 762.3 |
| D | 11 | 129 | 16022445 | 22345.57 | 2528 | 2417 | 716.9 |
| D | 15 | 94 | 1304637 | 1816.4 | 2528 | 2417 | 716.9 |
| D | 11 | 176 | 1205051 | 1677.5 | 2528 | 2417 | 716.9 |
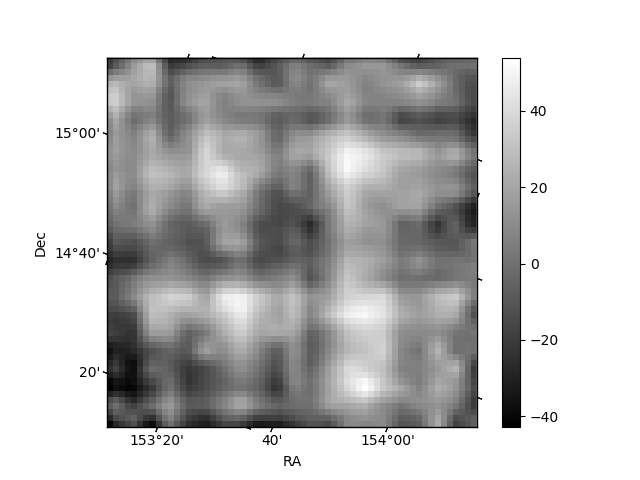
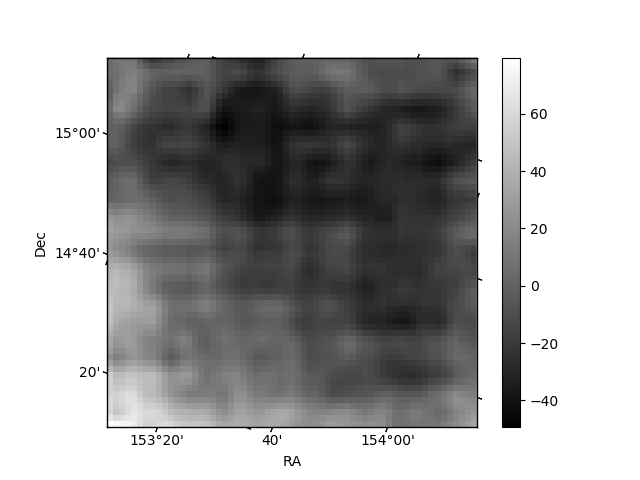
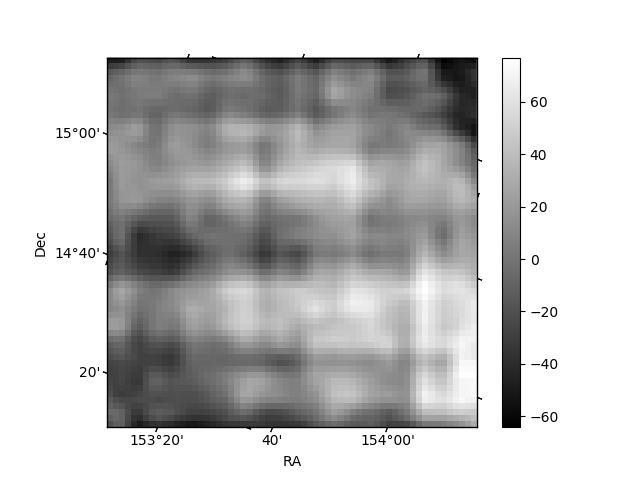
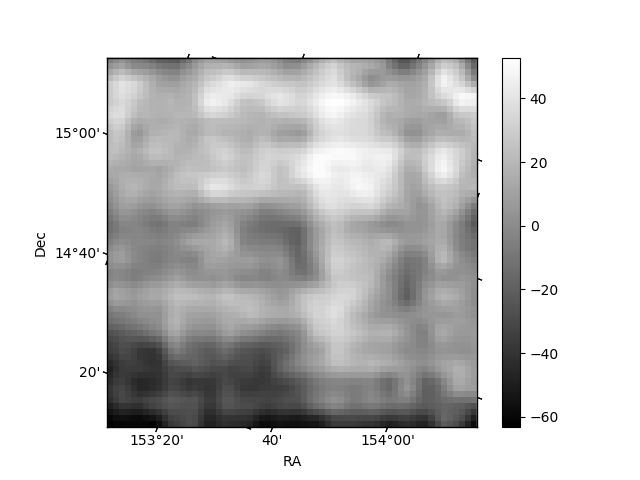
Histogram calculated using DETX and DETY for each event in the final _common_clean file
| Quadrant A | 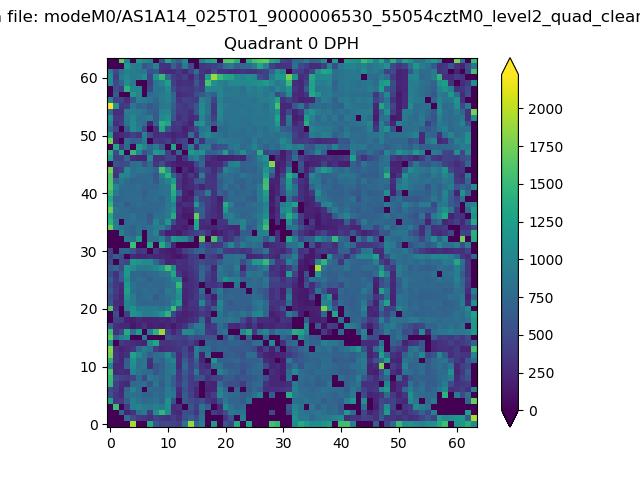 |
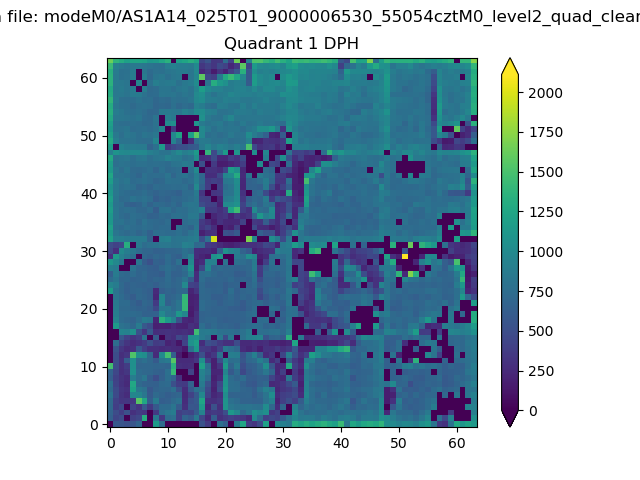 |
Quadrant B |
|---|---|---|---|
| Quadrant D | 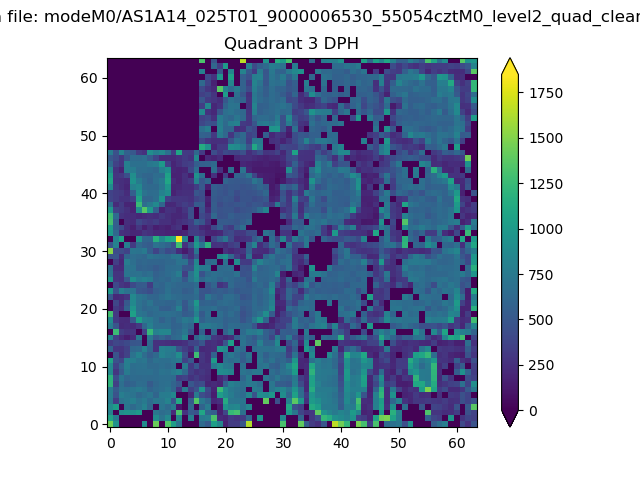 |
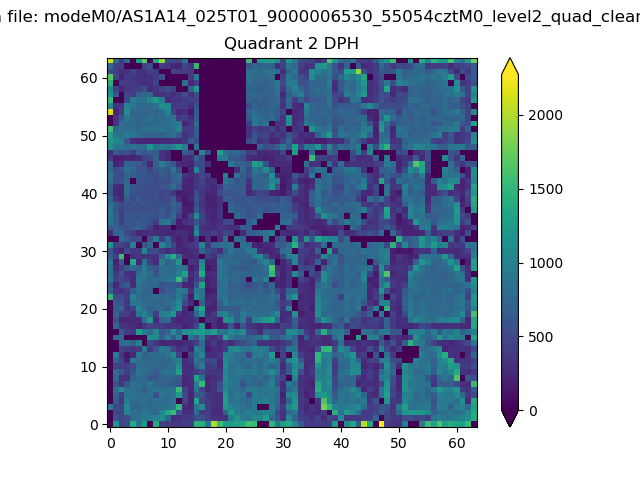 |
Quadrant C |
| Plot type | Count rate plots | Images |
|---|---|---|
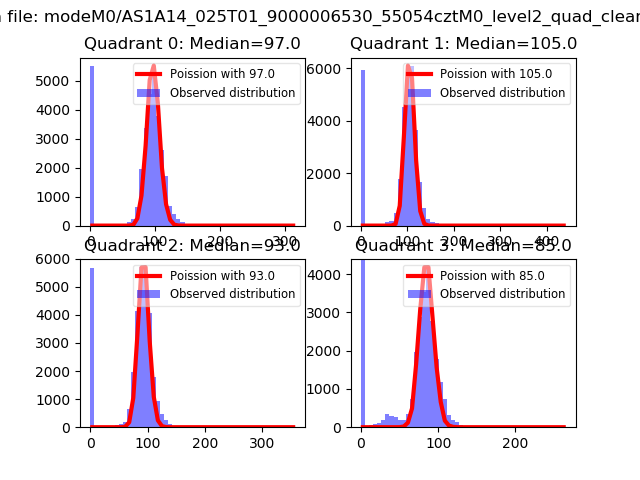
| Comparison with Poisson distribution Blue bars denote a histogram of data divided into 1 sec bins. Red curve is a Poisson curve with rate = median count rate of data. |
 |
 |
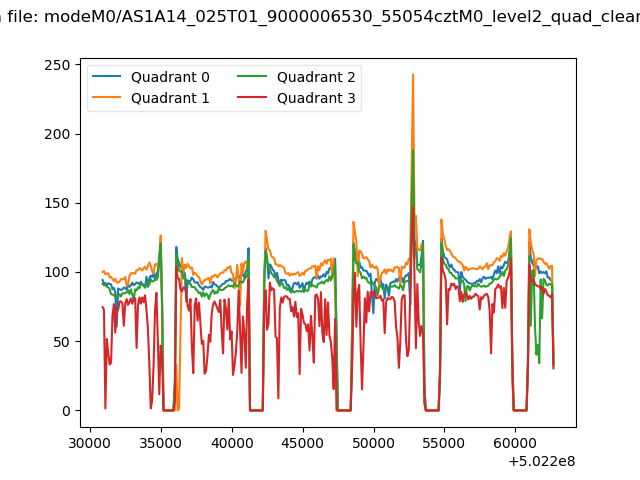
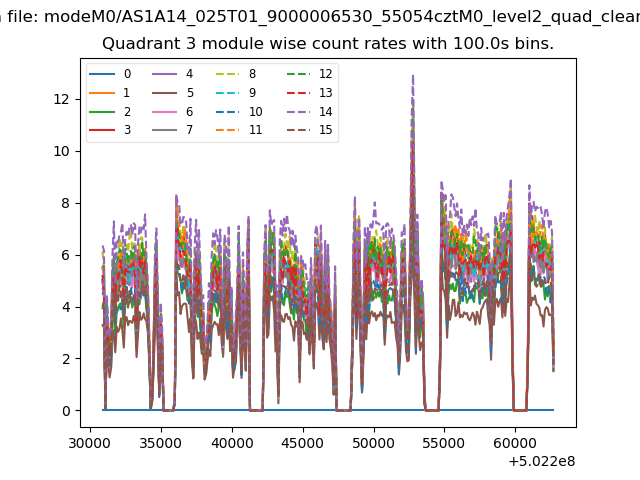
| Quadrant-wise count rates Data is divided into 100 sec bins |
 |
|
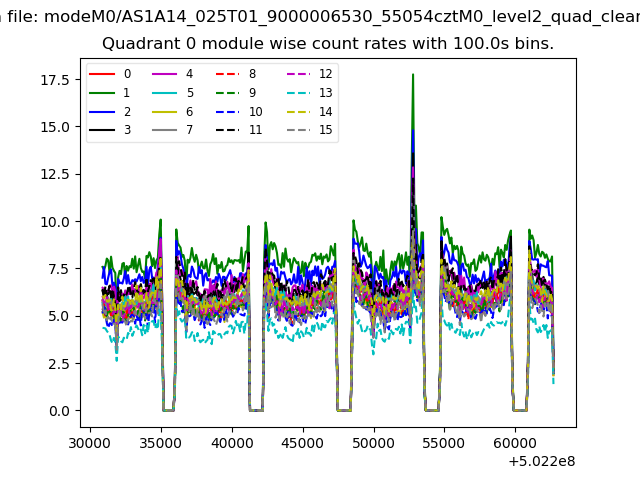
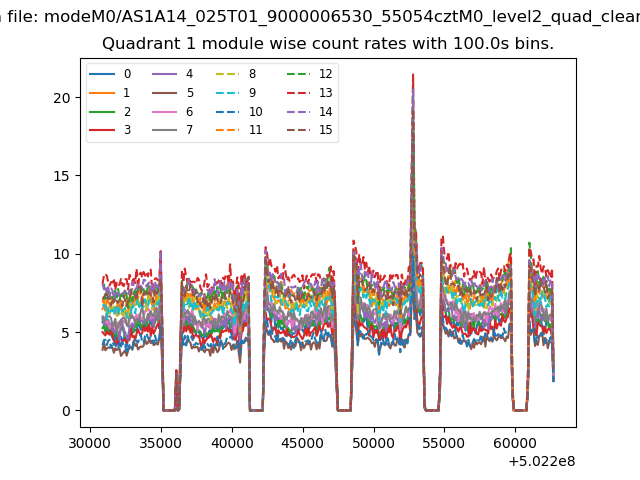
| Module-wise count rates for Quadrant A Data is divided into 100 sec bins |
 |
 |
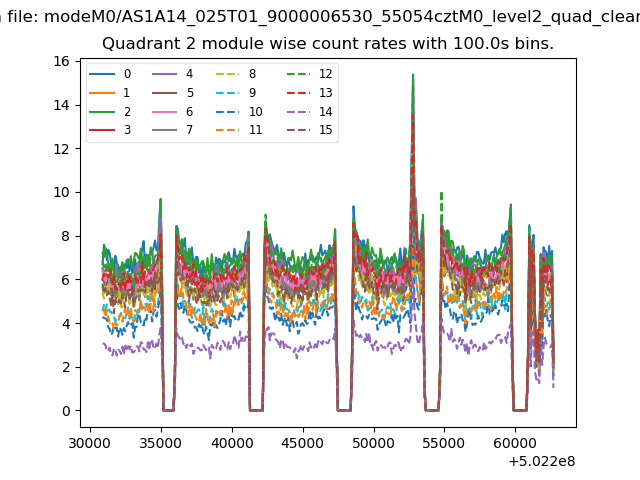
| Module-wise count rates for Quadrant B Data is divided into 100 sec bins |
 |
 |
| Module-wise count rates for Quadrant C Data is divided into 100 sec bins |
 |
 |
| Module-wise count rates for Quadrant D Data is divided into 100 sec bins |
 |
 |
| Parameter | Plot |
|---|---|
| CZT HV Monitor | 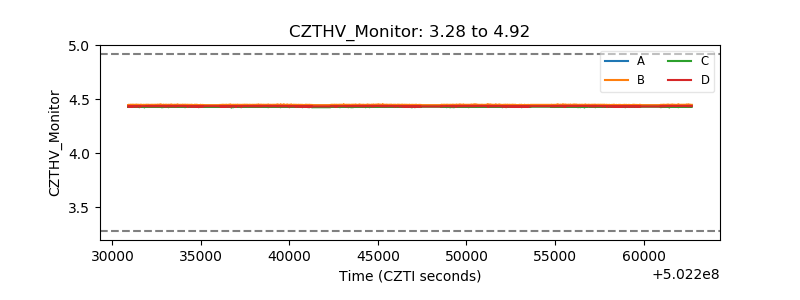 |
| D_VDD | 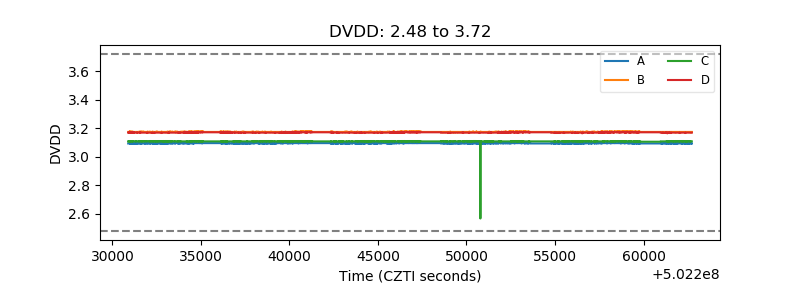 |
| Temperature 1 | 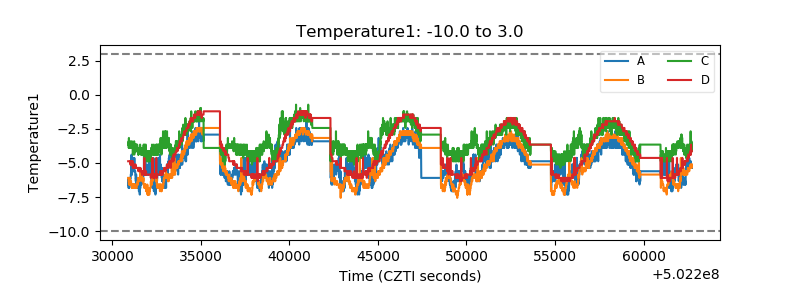 |
| Veto HV Monitor |  |
| Veto LLD | 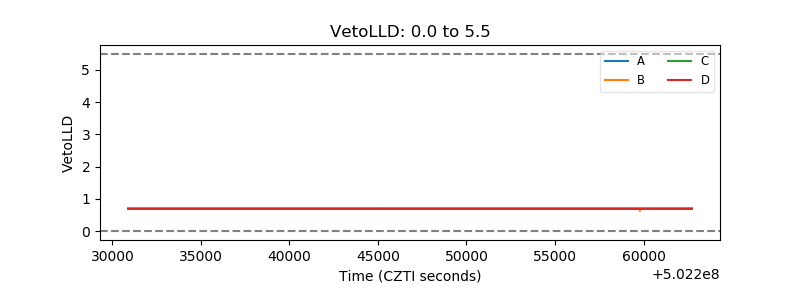 |
| Alpha Counter | 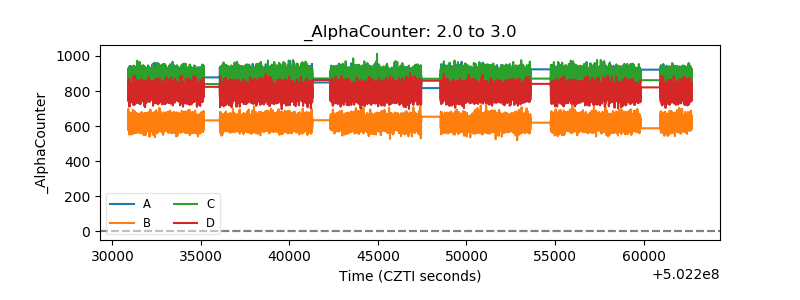 |
| _CPM_Rate | 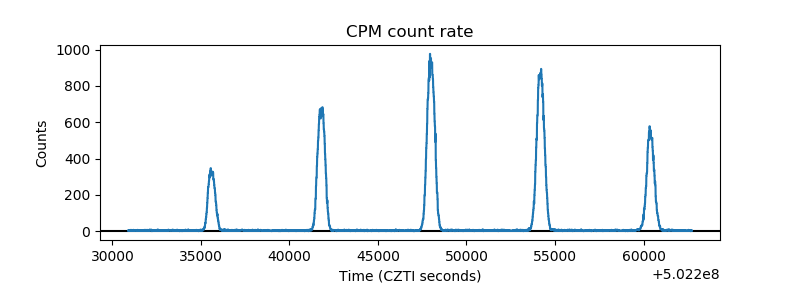 |
| CZT Counter | 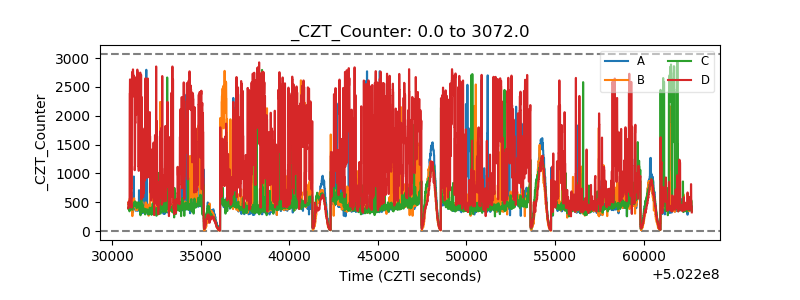 |
| +2.5 Volts monitor | 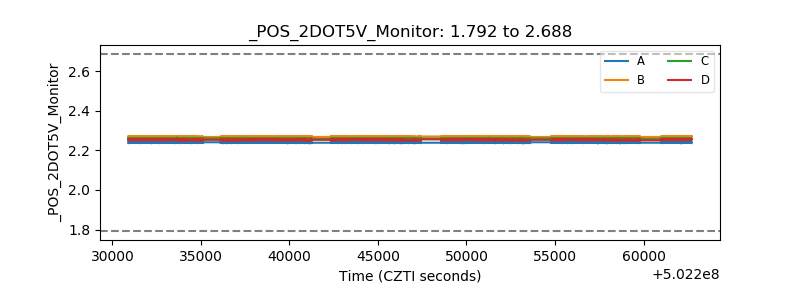 |
| +5 Volts monitor |  |
| _ROLL_ROT | 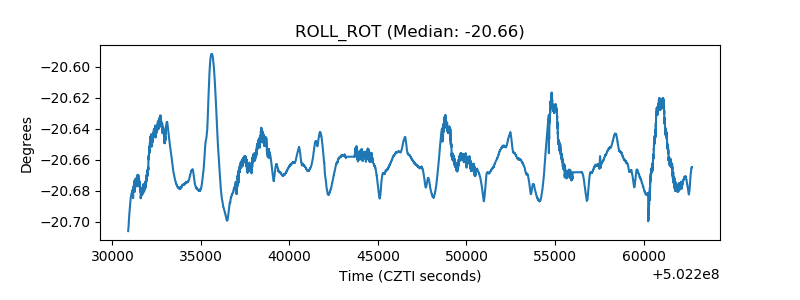 |
| _Roll_DEC | 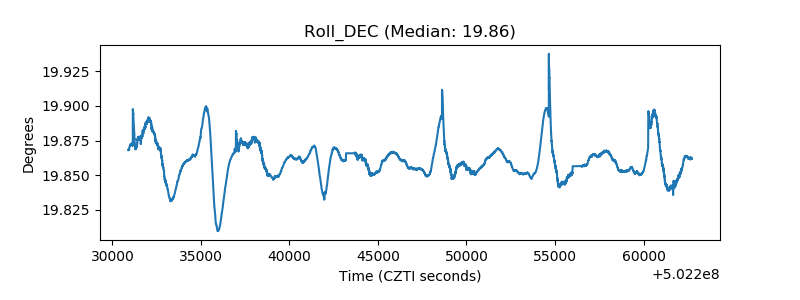 |
| _Roll_RA | 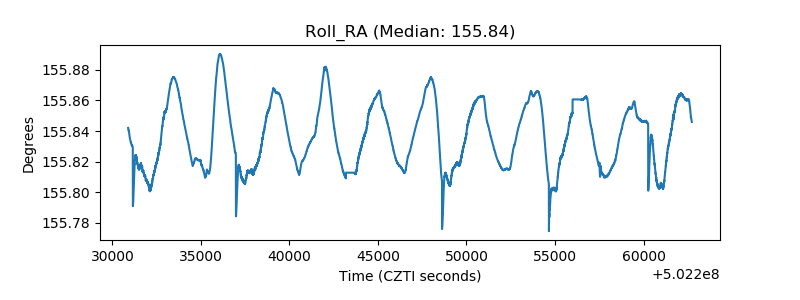 |
| Veto Counter | 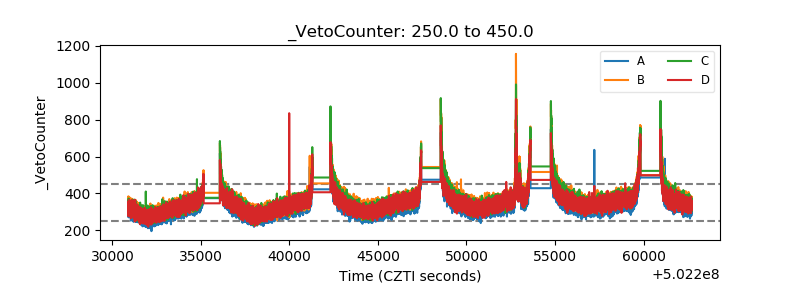 |