| Param | Original file | Final file |
|---|---|---|
| Filename | modeM0/AS1A14_025T01_9000006530_55055cztM0_level2.fits | modeM0/AS1A14_025T01_9000006530_55055cztM0_level2_quad_clean.evt |
| Size (bytes) | 406,091,520 | 100,794,240 |
| Size | 387.3 MB | 96.1 MB |
| Events in quadrant A | 3,172,466 | 667,971 |
| Events in quadrant B | 3,080,180 | 723,599 |
| Events in quadrant C | 4,287,997 | 600,344 |
| Events in quadrant D | 3,963,267 | 586,894 |
| Mode M0 | |||
|---|---|---|---|
| Quadrant | BADHDUFLAG | Total packets | Discarded packets |
| A | 0 | 14488 | 2 |
| B | 0 | 14238 | 2 |
| C | 0 | 17691 | 2 |
| D | 0 | 16573 | 2 |
| Mode SS | |||
|---|---|---|---|
| Quadrant | BADHDUFLAG | Total packets | Discarded packets |
| A | 0 | 140 | 0 |
| B | 0 | 140 | 0 |
| C | 0 | 140 | 0 |
| D | 0 | 140 | 0 |
| Mode M9 | |||
|---|---|---|---|
| Quadrant | BADHDUFLAG | Total packets | Discarded packets |
| A | 0 | 11 | 0 |
| B | 0 | 11 | 0 |
| C | 0 | 11 | 0 |
| D | 0 | 12 | 0 |
| Quadrant | Total seconds | Saturated seconds | Saturation percentage |
|---|---|---|---|
| A | 6787 | 98 | 1.443937% |
| B | 6787 | 122 | 1.797554% |
| C | 6787 | 439 | 6.468248% |
| D | 6787 | 169 | 2.490055% |
Noise dominated data is calculated using 1-second bins in cleaned event files. If a bin has >2000 counts, and if more than 50% of those come from <1% of pixels, then it is considered to be noise-dominated and hence unusable.
| Quadrant | # 1 sec bins | Bins with >0 counts | Bins with >2000 counts | High rate bins dominated by noise | Noise dominated (total time) | Noise dominated (detector-on time) | Marked lightcurve |
|---|---|---|---|---|---|---|---|
| A | 7827 | 6788 | 9 | 9 | 0.11% | 0.13% | 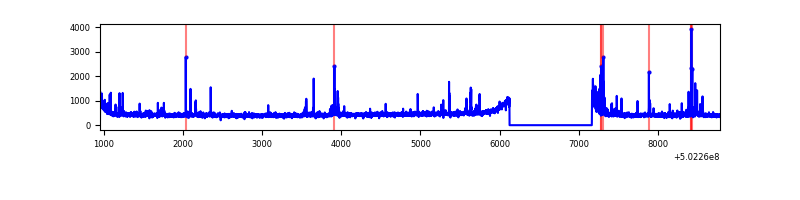 |
| B | 7827 | 6788 | 11 | 11 | 0.14% | 0.16% | 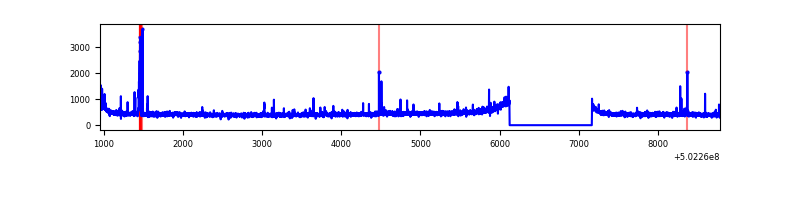 |
| C | 7827 | 6788 | 349 | 349 | 4.46% | 5.14% | 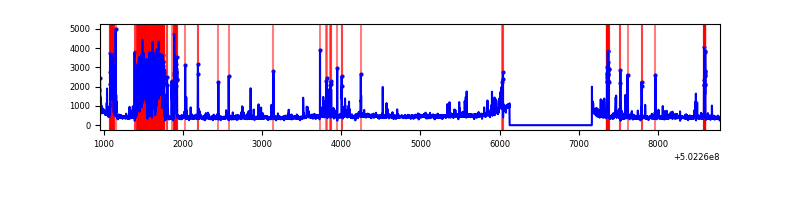 |
| D | 7827 | 6788 | 103 | 103 | 1.32% | 1.52% | 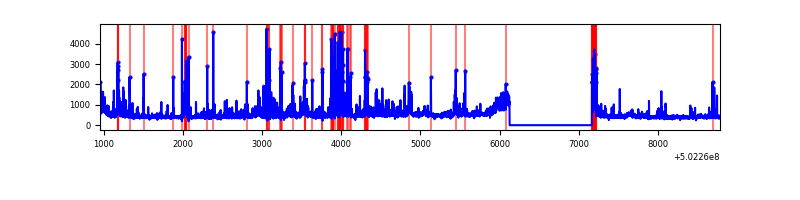 |
Top three noisy pixels from each quadrant. If the there are fewer than three noisy pixels in the level2.evt file, extra rows are filled as -1
| Pixel properties | Quadrant properties | ||||||
|---|---|---|---|---|---|---|---|
| Quadrant | DetID | PixID | Counts | Sigma | Mean | Median | Sigma |
| A | 0 | 8 | 154442 | 832.6 | 758 | 740 | 184.6 |
| A | 6 | 161 | 23884 | 125.37 | 758 | 740 | 184.6 |
| A | 15 | 32 | 20425 | 106.63 | 758 | 740 | 184.6 |
| B | 5 | 185 | 82947 | 505.56 | 747 | 719 | 162.6 |
| B | 12 | 111 | 19797 | 117.3 | 747 | 719 | 162.6 |
| B | 11 | 111 | 18320 | 108.22 | 747 | 719 | 162.6 |
| C | 12 | 250 | 1108952 | 5618.48 | 717 | 710 | 197.2 |
| C | 6 | 223 | 118209 | 595.69 | 717 | 710 | 197.2 |
| C | 13 | 3 | 94000 | 472.95 | 717 | 710 | 197.2 |
| D | 3 | 12 | 210491 | 1023.01 | 723 | 690 | 205.1 |
| D | 10 | 181 | 139317 | 675.96 | 723 | 690 | 205.1 |
| D | 12 | 6 | 132211 | 641.31 | 723 | 690 | 205.1 |
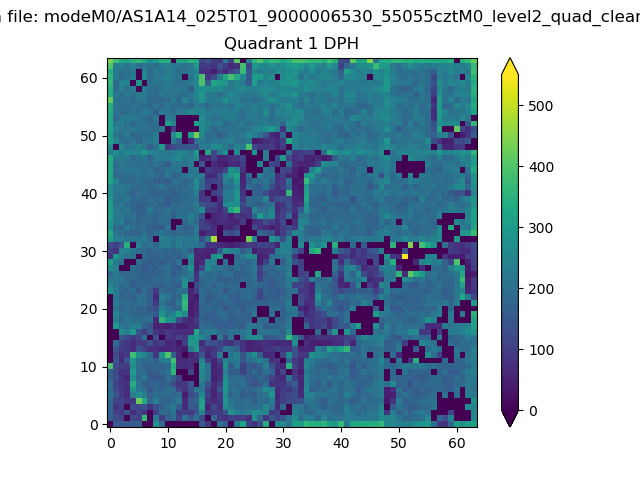
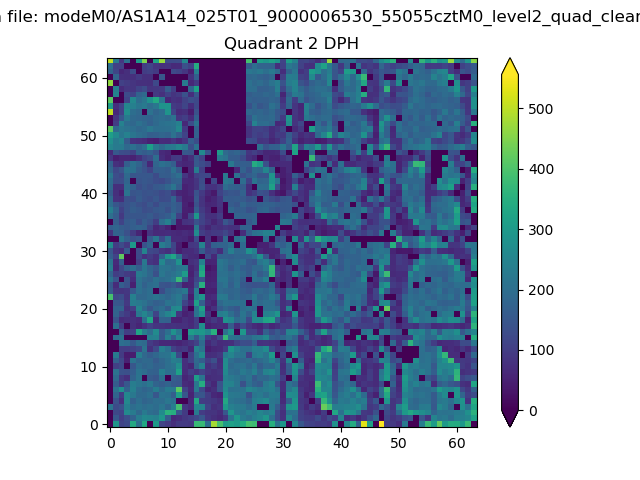
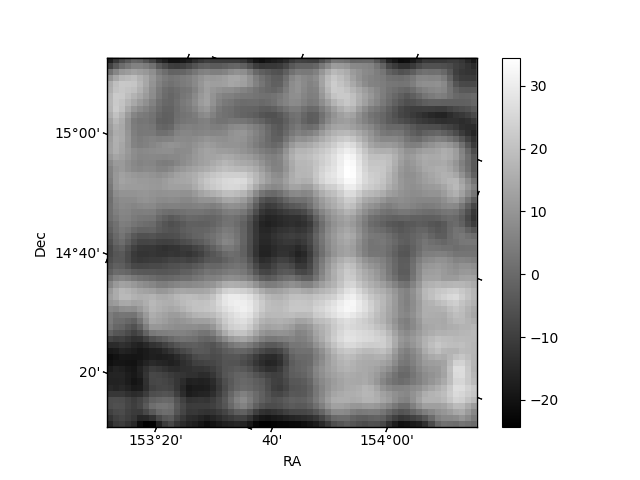
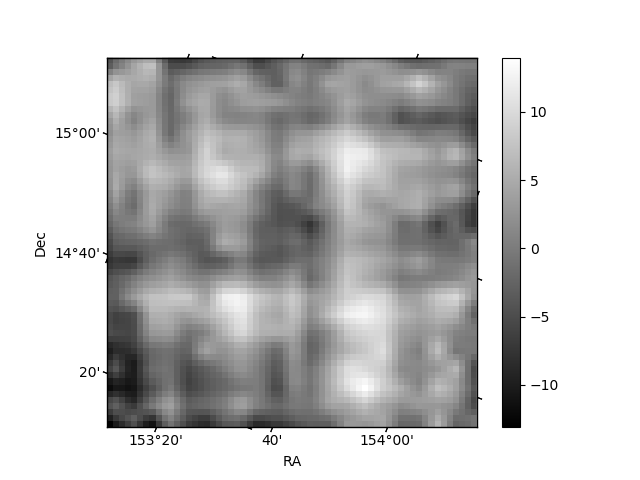
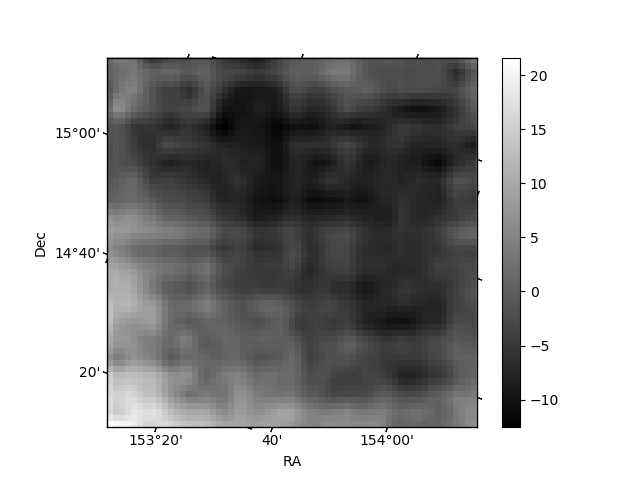
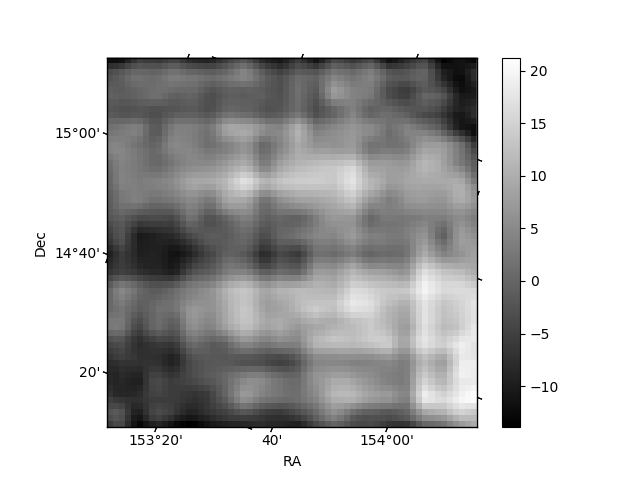
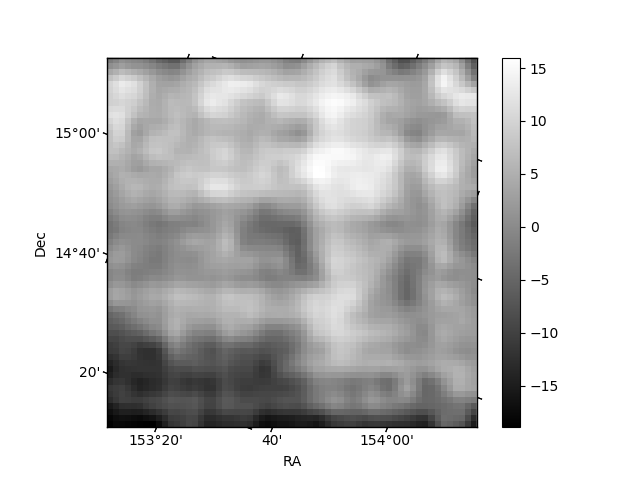
Histogram calculated using DETX and DETY for each event in the final _common_clean file
| Quadrant A |  |
 |
Quadrant B |
|---|---|---|---|
| Quadrant D | 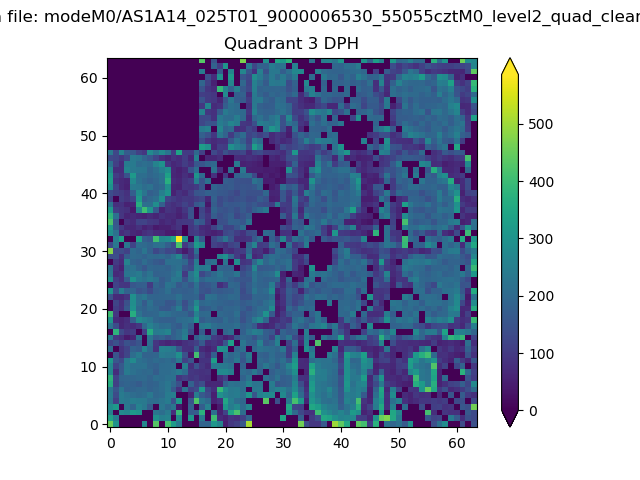 |
 |
Quadrant C |
| Plot type | Count rate plots | Images |
|---|---|---|
| Comparison with Poisson distribution Blue bars denote a histogram of data divided into 1 sec bins. Red curve is a Poisson curve with rate = median count rate of data. |
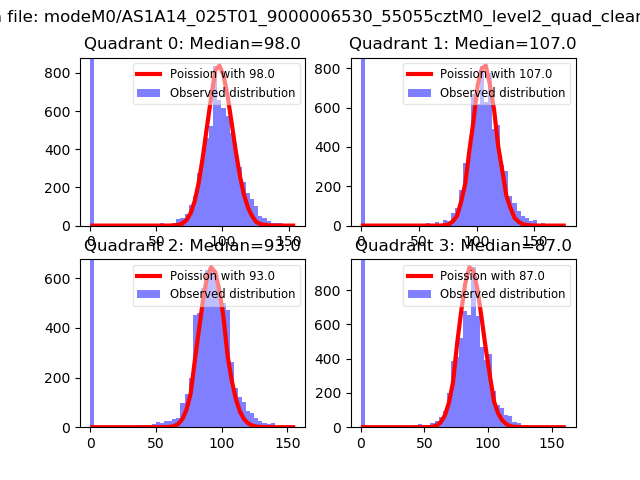 |
 |
| Quadrant-wise count rates Data is divided into 100 sec bins |
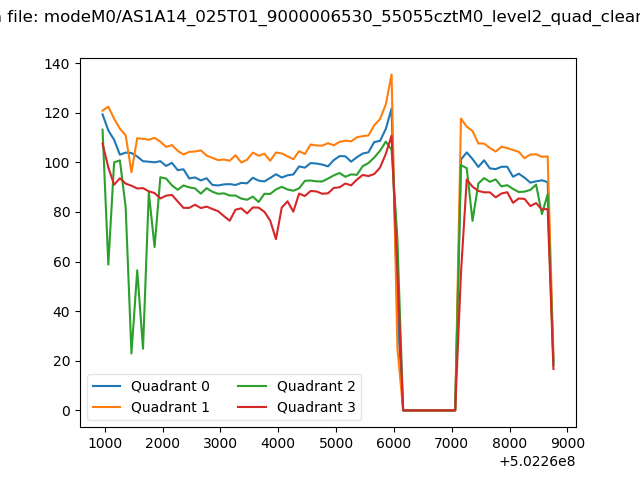 |
|
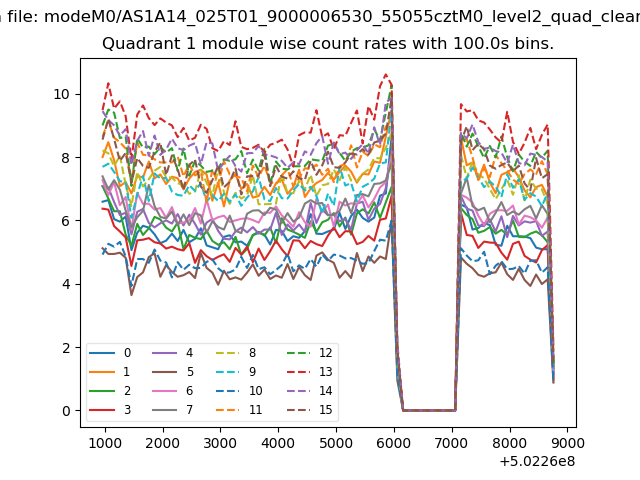
| Module-wise count rates for Quadrant A Data is divided into 100 sec bins |
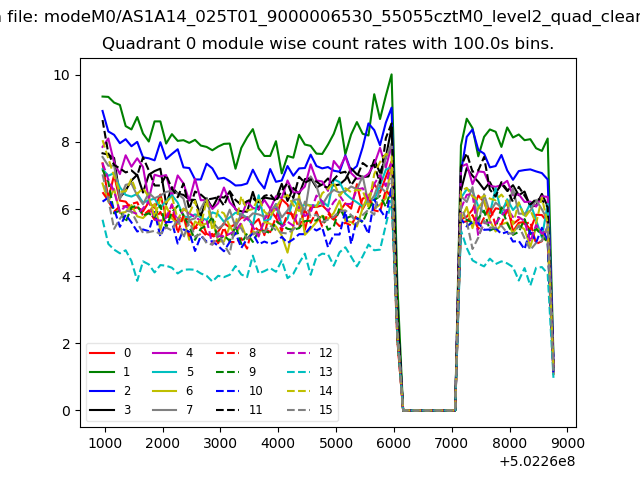 |
 |
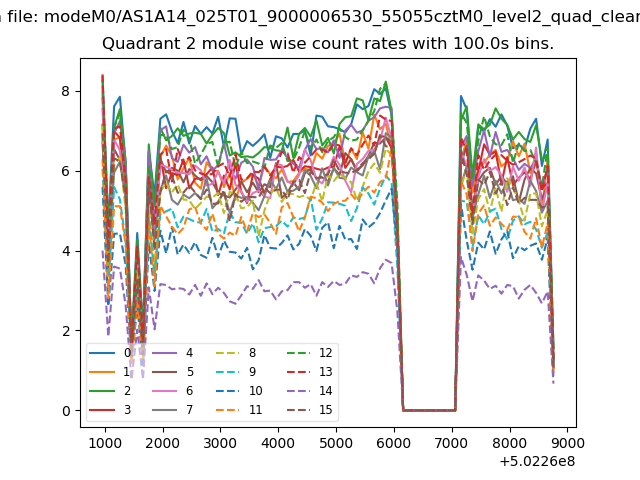
| Module-wise count rates for Quadrant B Data is divided into 100 sec bins |
 |
 |
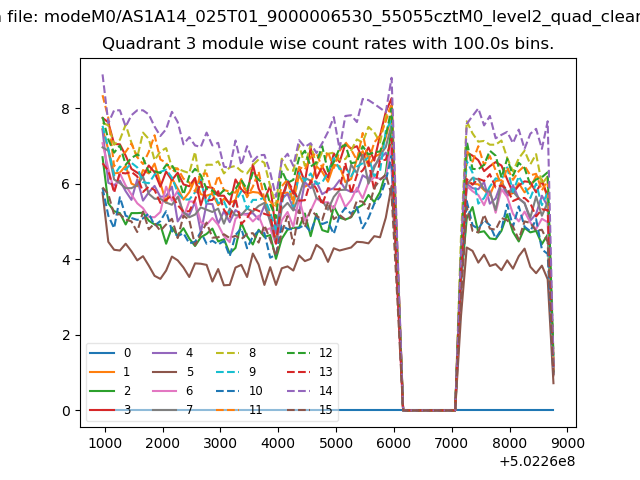
| Module-wise count rates for Quadrant C Data is divided into 100 sec bins |
 |
 |
| Module-wise count rates for Quadrant D Data is divided into 100 sec bins |
 |
 |
| Parameter | Plot |
|---|---|
| CZT HV Monitor | 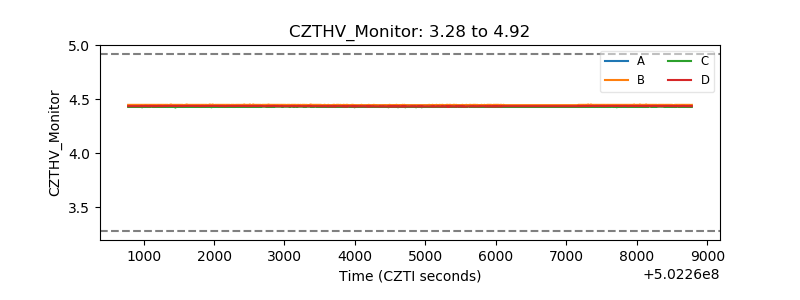 |
| D_VDD | 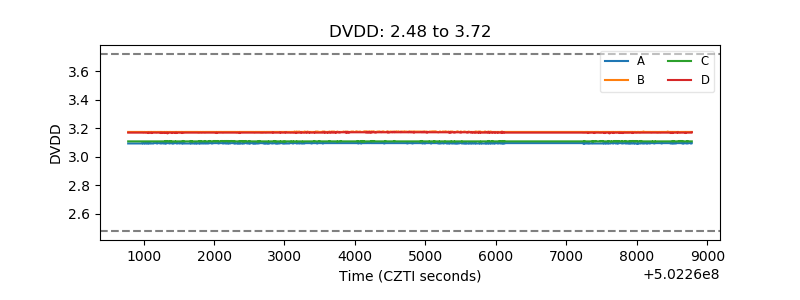 |
| Temperature 1 | 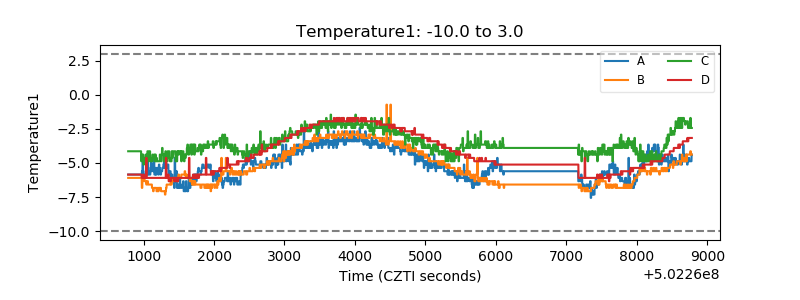 |
| Veto HV Monitor |  |
| Veto LLD | 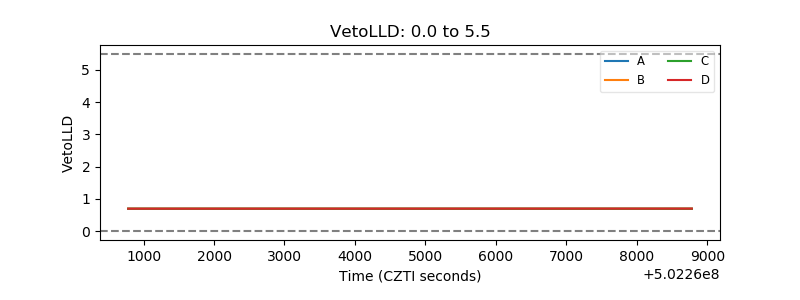 |
| Alpha Counter | 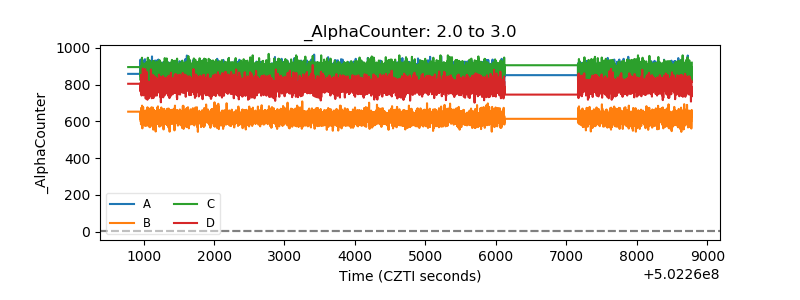 |
| _CPM_Rate |  |
| CZT Counter | 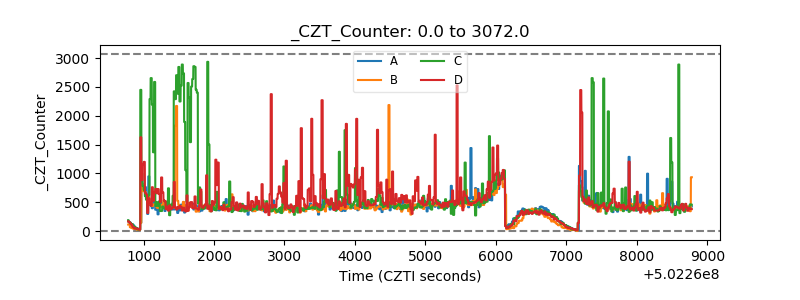 |
| +2.5 Volts monitor | 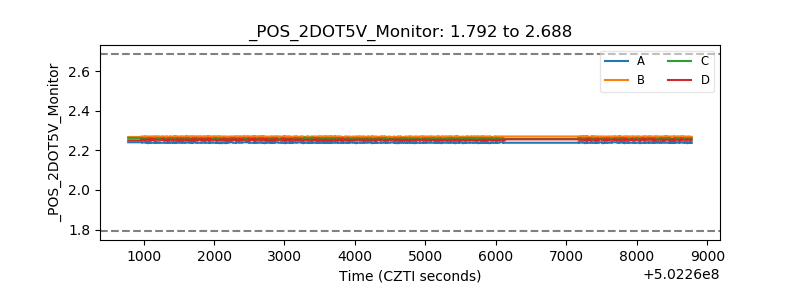 |
| +5 Volts monitor | 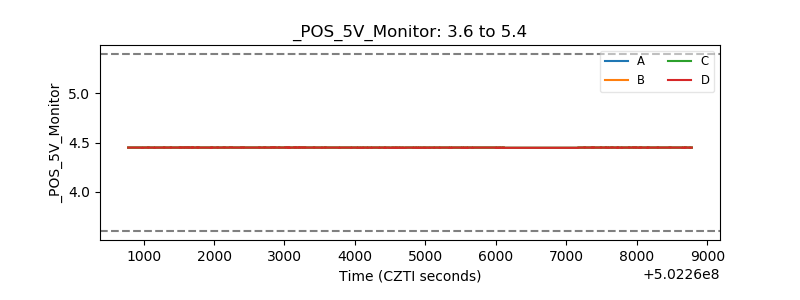 |
| _ROLL_ROT | 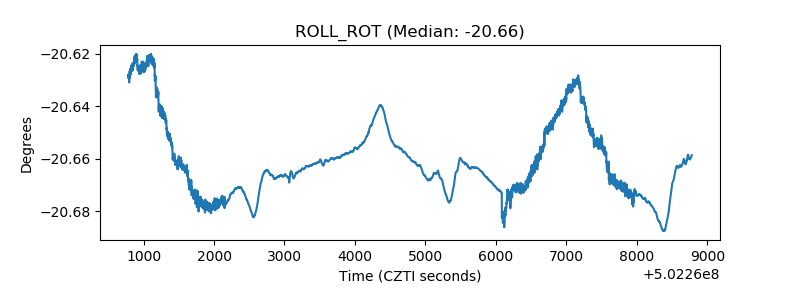 |
| _Roll_DEC |  |
| _Roll_RA | 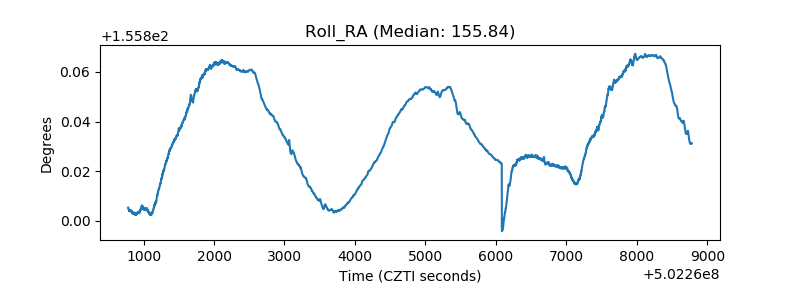 |
| Veto Counter | 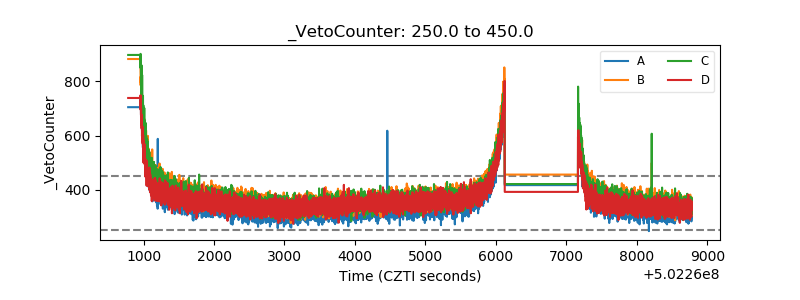 |