| Param | Original file | Final file |
|---|---|---|
| Filename | modeM0/AS1A14_025T01_9000006530_55056cztM0_level2.fits | modeM0/AS1A14_025T01_9000006530_55056cztM0_level2_quad_clean.evt |
| Size (bytes) | 638,055,360 | 143,280,000 |
| Size | 608.5 MB | 136.6 MB |
| Events in quadrant A | 4,766,782 | 942,813 |
| Events in quadrant B | 5,714,387 | 981,383 |
| Events in quadrant C | 5,362,142 | 898,799 |
| Events in quadrant D | 6,986,167 | 811,136 |
| Mode M0 | |||
|---|---|---|---|
| Quadrant | BADHDUFLAG | Total packets | Discarded packets |
| A | 0 | 23452 | 1779 |
| B | 0 | 26604 | 2164 |
| C | 0 | 25137 | 1855 |
| D | 0 | 30111 | 2390 |
| Mode SS | |||
|---|---|---|---|
| Quadrant | BADHDUFLAG | Total packets | Discarded packets |
| A | 0 | 226 | 16 |
| B | 0 | 226 | 18 |
| C | 0 | 226 | 20 |
| D | 0 | 226 | 14 |
| Mode M9 | |||
|---|---|---|---|
| Quadrant | BADHDUFLAG | Total packets | Discarded packets |
| A | 0 | 17 | 0 |
| B | 0 | 17 | 0 |
| C | 0 | 17 | 0 |
| D | 0 | 17 | 0 |
| Quadrant | Total seconds | Saturated seconds | Saturation percentage |
|---|---|---|---|
| A | 10180 | 211 | 2.072692% |
| B | 10111 | 561 | 5.548413% |
| C | 10175 | 230 | 2.260442% |
| D | 10139 | 493 | 4.862412% |
Noise dominated data is calculated using 1-second bins in cleaned event files. If a bin has >2000 counts, and if more than 50% of those come from <1% of pixels, then it is considered to be noise-dominated and hence unusable.
| Quadrant | # 1 sec bins | Bins with >0 counts | Bins with >2000 counts | High rate bins dominated by noise | Noise dominated (total time) | Noise dominated (detector-on time) | Marked lightcurve |
|---|---|---|---|---|---|---|---|
| A | 12823 | 10492 | 20 | 20 | 0.16% | 0.19% | 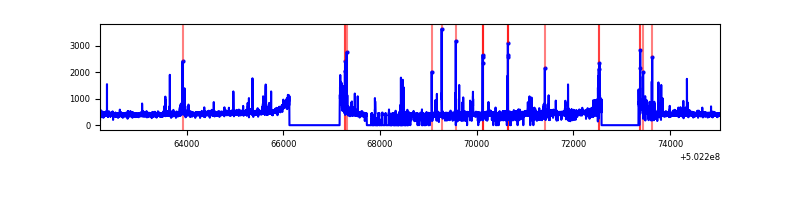 |
| B | 12823 | 10463 | 264 | 264 | 2.06% | 2.52% | 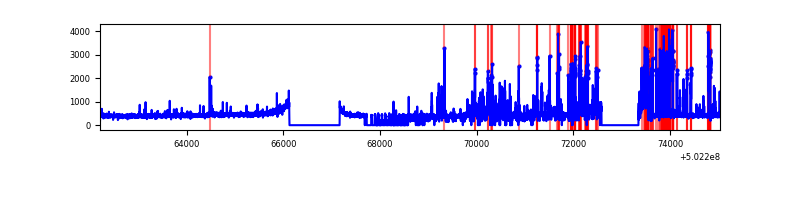 |
| C | 12822 | 10500 | 103 | 103 | 0.80% | 0.98% | 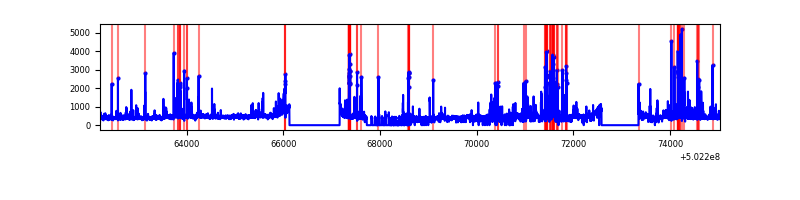 |
| D | 12823 | 10486 | 307 | 307 | 2.39% | 2.93% | 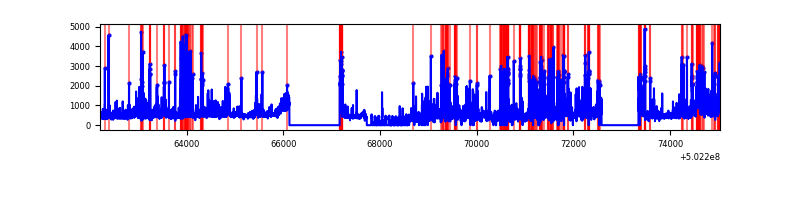 |
Top three noisy pixels from each quadrant. If the there are fewer than three noisy pixels in the level2.evt file, extra rows are filled as -1
| Pixel properties | Quadrant properties | ||||||
|---|---|---|---|---|---|---|---|
| Quadrant | DetID | PixID | Counts | Sigma | Mean | Median | Sigma |
| A | 0 | 8 | 164641 | 584.66 | 1142 | 1115 | 279.7 |
| A | 6 | 161 | 81037 | 285.75 | 1142 | 1115 | 279.7 |
| A | 9 | 129 | 21828 | 74.06 | 1142 | 1115 | 279.7 |
| B | 4 | 81 | 1156731 | 4868.35 | 1101 | 1057 | 237.4 |
| B | 0 | 182 | 70463 | 292.38 | 1101 | 1057 | 237.4 |
| B | 5 | 185 | 69848 | 289.79 | 1101 | 1057 | 237.4 |
| C | 12 | 250 | 369834 | 1219.98 | 1106 | 1097 | 302.2 |
| C | 13 | 3 | 194923 | 641.28 | 1106 | 1097 | 302.2 |
| C | 6 | 223 | 125170 | 410.5 | 1106 | 1097 | 302.2 |
| D | 6 | 239 | 444284 | 1433.1 | 1084 | 1037 | 309.3 |
| D | 11 | 129 | 442141 | 1426.18 | 1084 | 1037 | 309.3 |
| D | 3 | 12 | 345767 | 1114.58 | 1084 | 1037 | 309.3 |
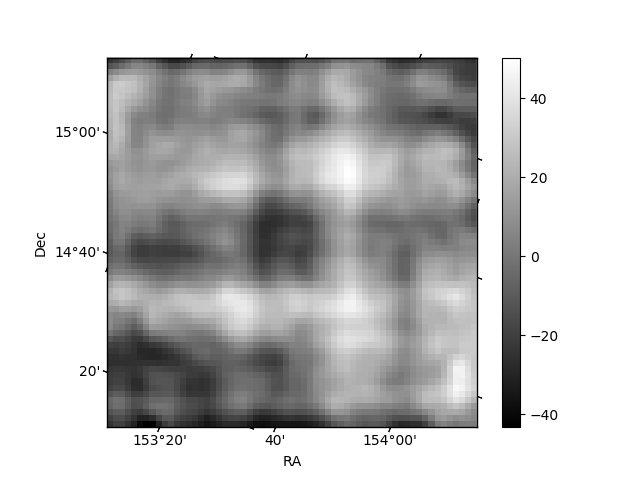
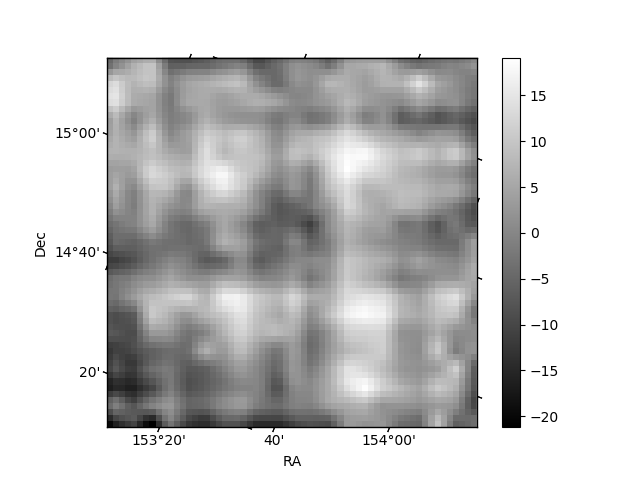
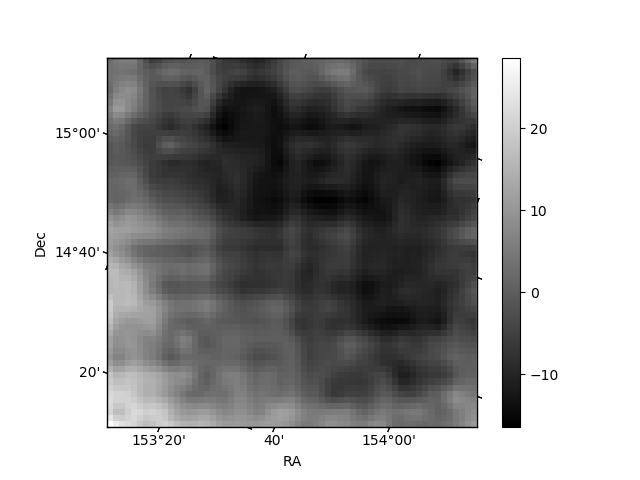
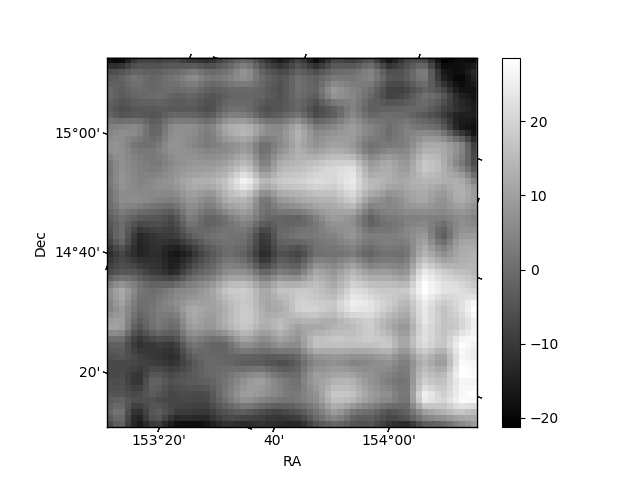
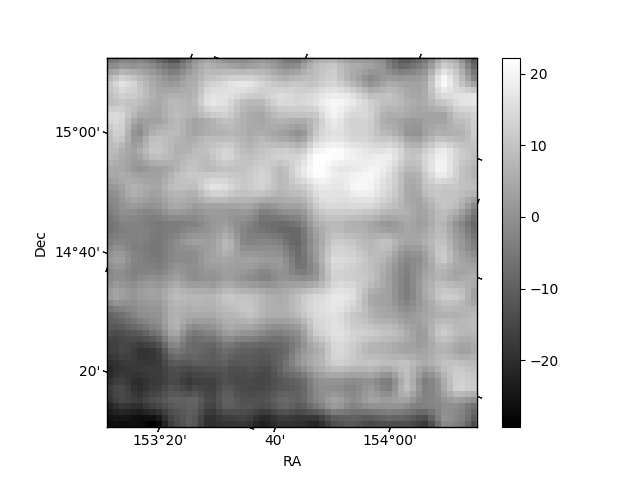
Histogram calculated using DETX and DETY for each event in the final _common_clean file
| Quadrant A | 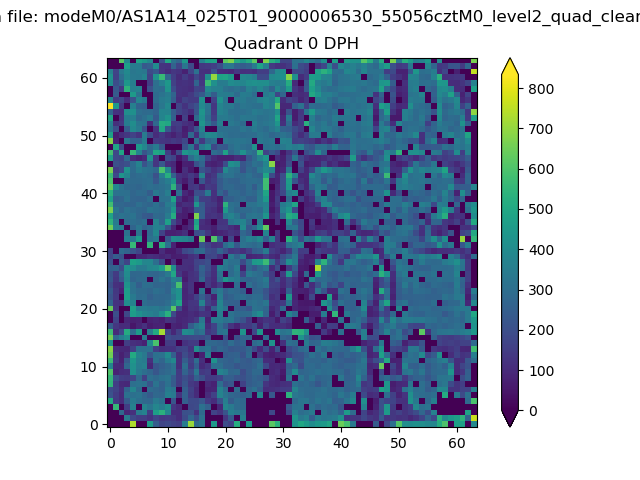 |
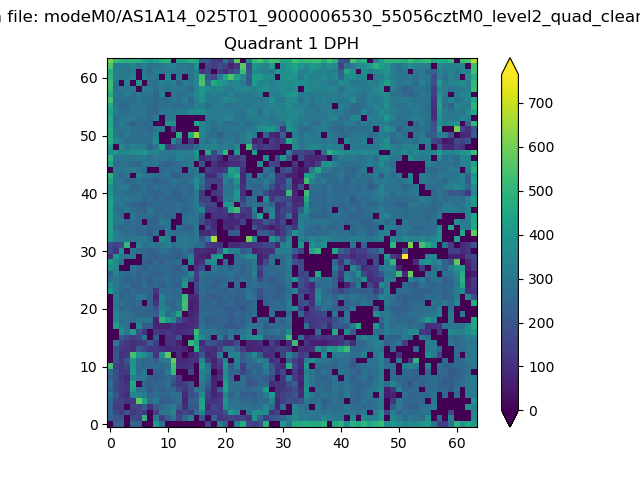 |
Quadrant B |
|---|---|---|---|
| Quadrant D | 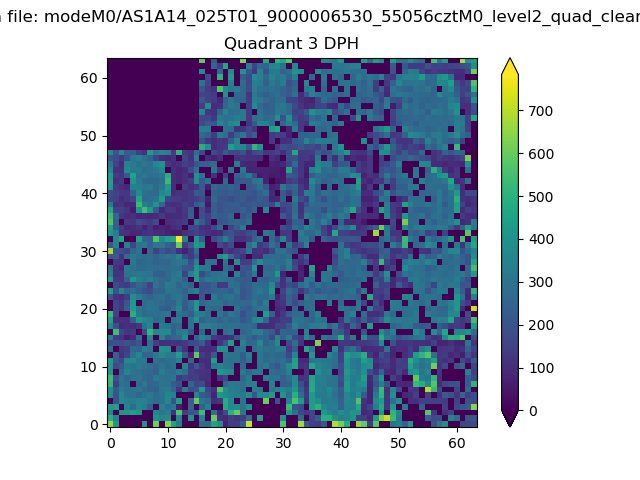 |
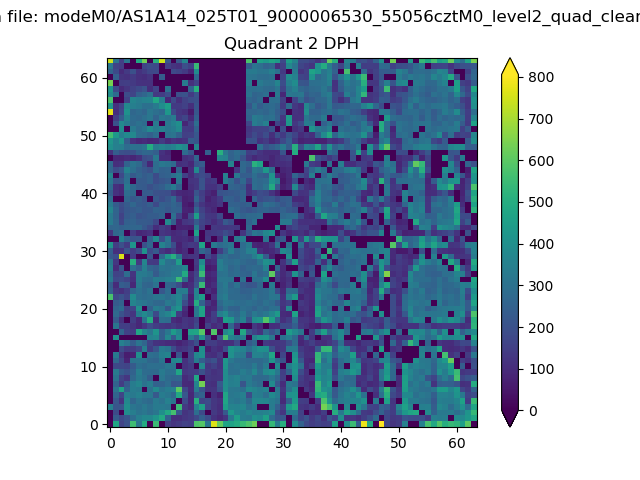 |
Quadrant C |
| Plot type | Count rate plots | Images |
|---|---|---|
| Comparison with Poisson distribution Blue bars denote a histogram of data divided into 1 sec bins. Red curve is a Poisson curve with rate = median count rate of data. |
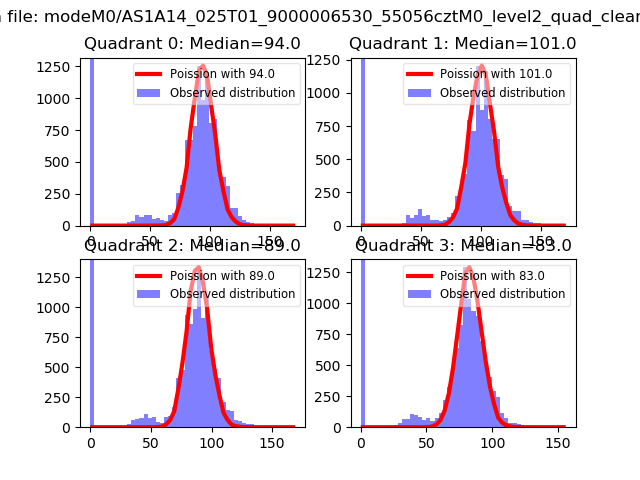 |
 |
| Quadrant-wise count rates Data is divided into 100 sec bins |
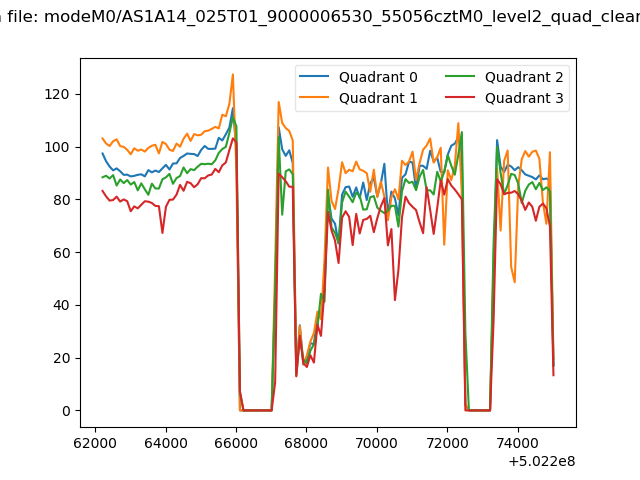 |
|
| Module-wise count rates for Quadrant A Data is divided into 100 sec bins |
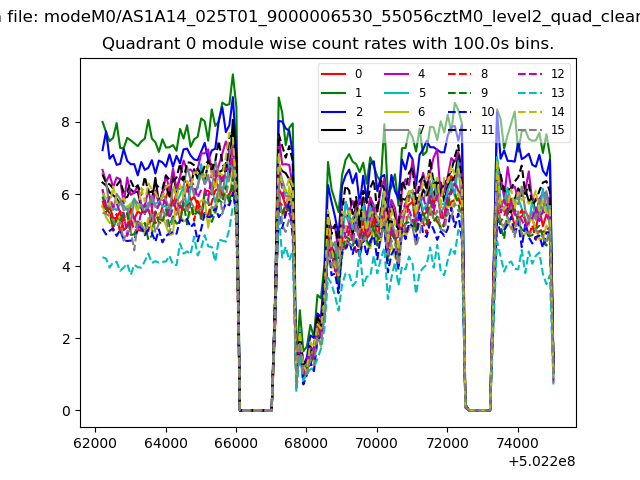 |
 |
| Module-wise count rates for Quadrant B Data is divided into 100 sec bins |
 |
 |
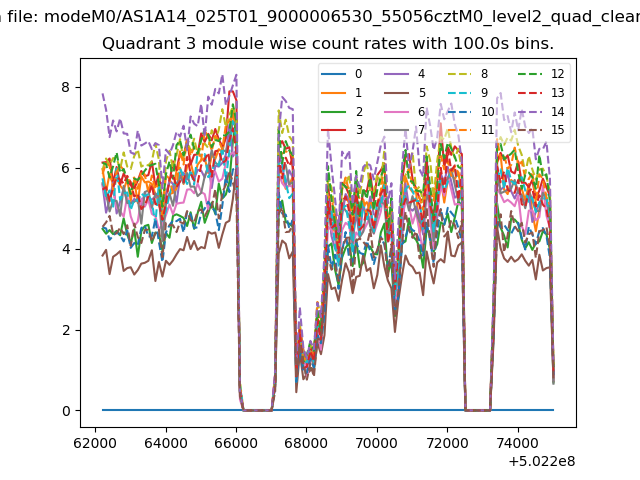
| Module-wise count rates for Quadrant C Data is divided into 100 sec bins |
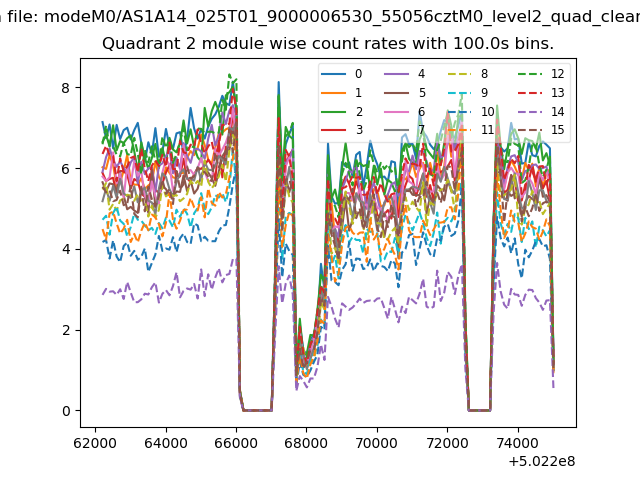 |
 |
| Module-wise count rates for Quadrant D Data is divided into 100 sec bins |
 |
 |
| Parameter | Plot |
|---|---|
| CZT HV Monitor | 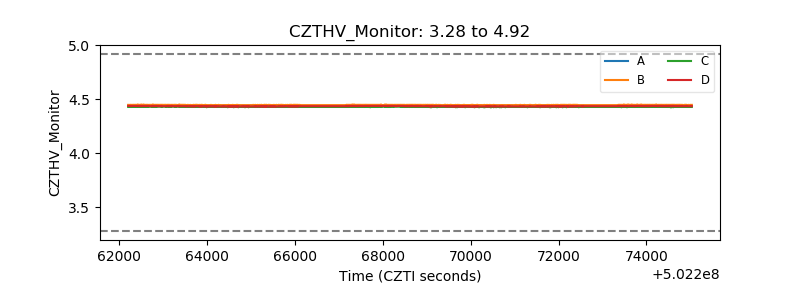 |
| D_VDD | 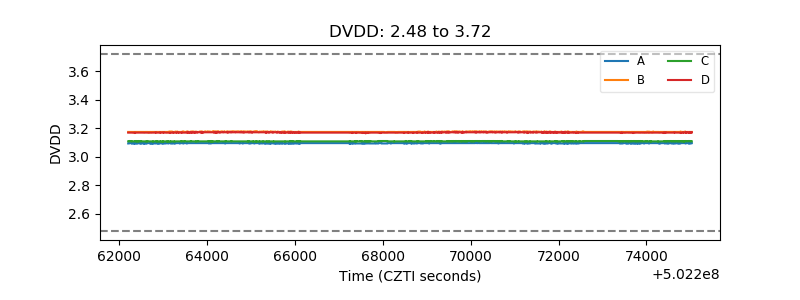 |
| Temperature 1 | 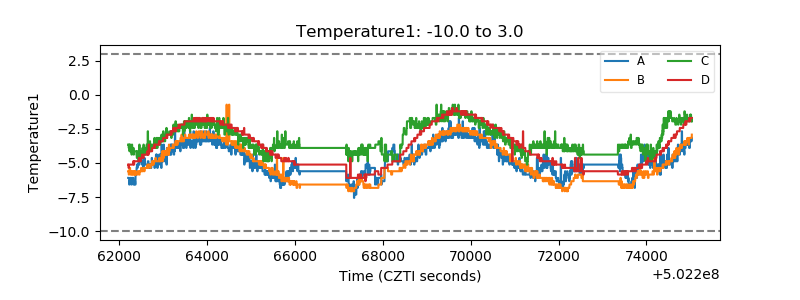 |
| Veto HV Monitor | 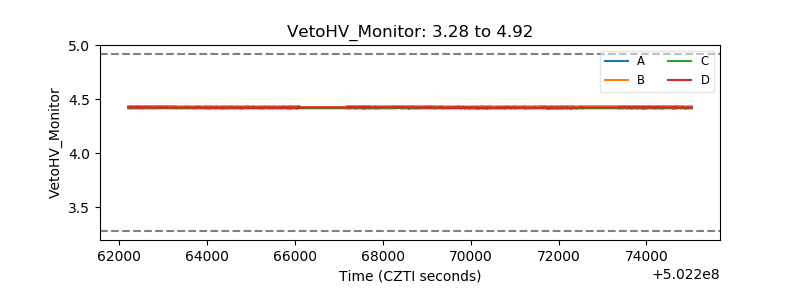 |
| Veto LLD | 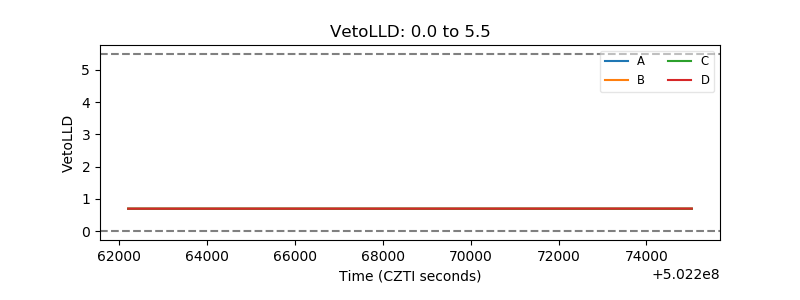 |
| Alpha Counter | 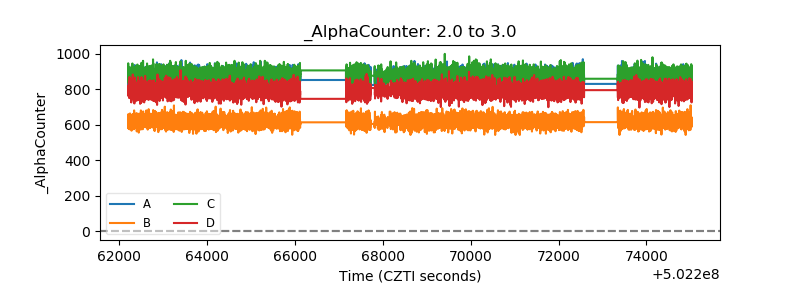 |
| _CPM_Rate | 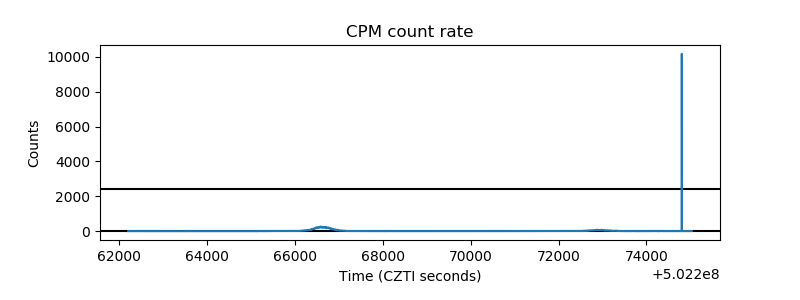 |
| CZT Counter | 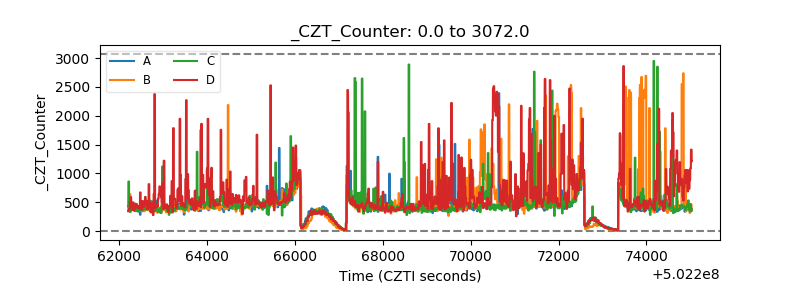 |
| +2.5 Volts monitor |  |
| +5 Volts monitor |  |
| _ROLL_ROT | 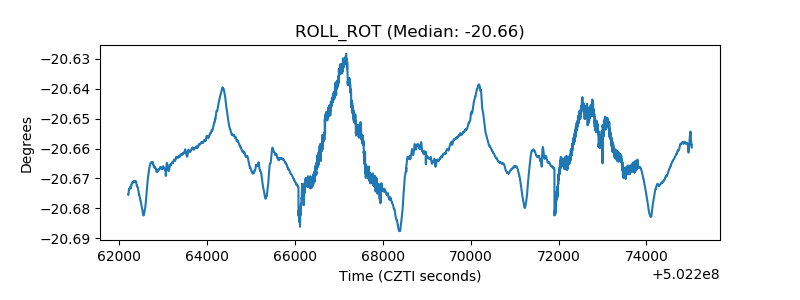 |
| _Roll_DEC | 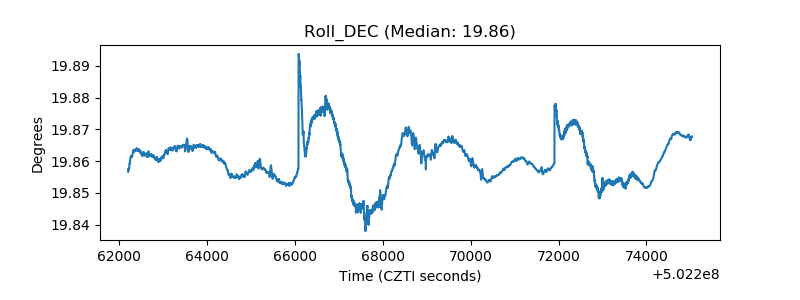 |
| _Roll_RA | 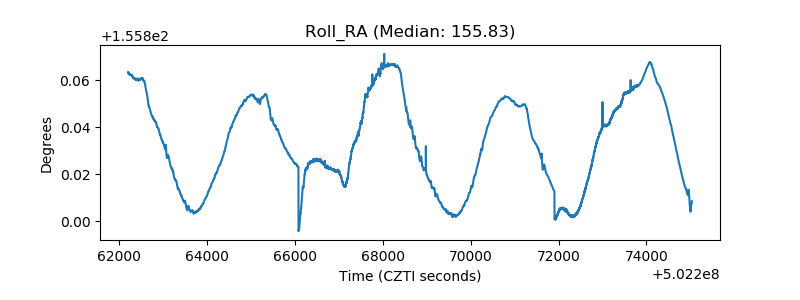 |
| Veto Counter | 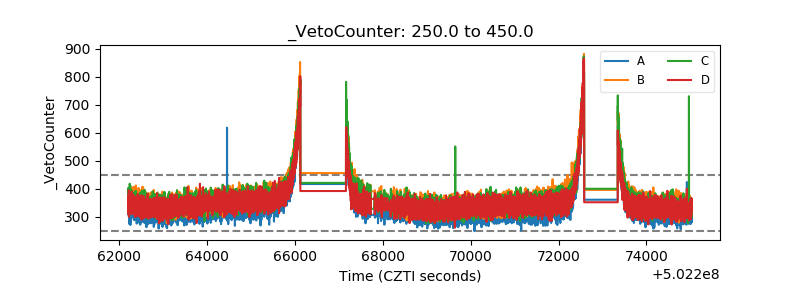 |