| Param | Original file | Final file |
|---|---|---|
| Filename | modeM0/AS1A14_025T01_9000006530_55059cztM0_level2.fits | modeM0/AS1A14_025T01_9000006530_55059cztM0_level2_quad_clean.evt |
| Size (bytes) | 398,283,840 | 83,468,160 |
| Size | 379.8 MB | 79.6 MB |
| Events in quadrant A | 2,736,170 | 551,148 |
| Events in quadrant B | 3,516,936 | 590,138 |
| Events in quadrant C | 3,080,289 | 522,693 |
| Events in quadrant D | 4,954,360 | 454,351 |
| Mode M0 | |||
|---|---|---|---|
| Quadrant | BADHDUFLAG | Total packets | Discarded packets |
| A | 0 | 13428 | 871 |
| B | 0 | 16089 | 1612 |
| C | 0 | 14724 | 1243 |
| D | 0 | 19912 | 1197 |
| Mode SS | |||
|---|---|---|---|
| Quadrant | BADHDUFLAG | Total packets | Discarded packets |
| A | 0 | 128 | 12 |
| B | 0 | 127 | 9 |
| C | 0 | 127 | 11 |
| D | 0 | 128 | 10 |
| Quadrant | Total seconds | Saturated seconds | Saturation percentage |
|---|---|---|---|
| A | 5871 | 41 | 0.698348% |
| B | 5828 | 55 | 0.943720% |
| C | 5866 | 56 | 0.954654% |
| D | 5844 | 513 | 8.778234% |
Noise dominated data is calculated using 1-second bins in cleaned event files. If a bin has >2000 counts, and if more than 50% of those come from <1% of pixels, then it is considered to be noise-dominated and hence unusable.
| Quadrant | # 1 sec bins | Bins with >0 counts | Bins with >2000 counts | High rate bins dominated by noise | Noise dominated (total time) | Noise dominated (detector-on time) | Marked lightcurve |
|---|---|---|---|---|---|---|---|
| A | 7751 | 5954 | 34 | 34 | 0.44% | 0.57% | 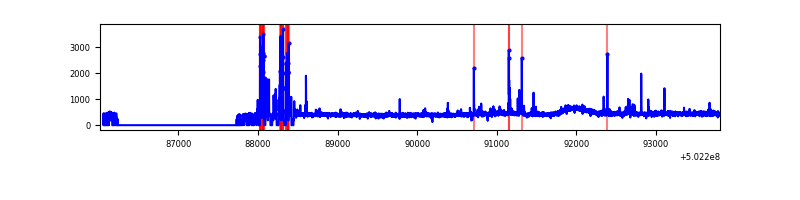 |
| B | 7736 | 5894 | 38 | 38 | 0.49% | 0.64% | 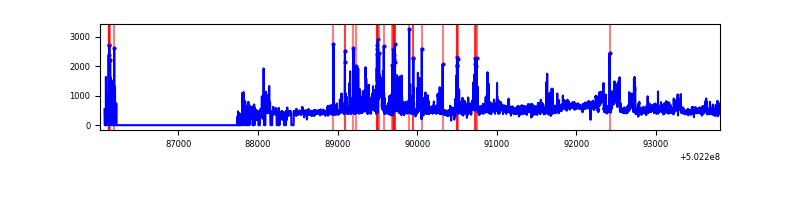 |
| C | 7793 | 5944 | 57 | 57 | 0.73% | 0.96% | 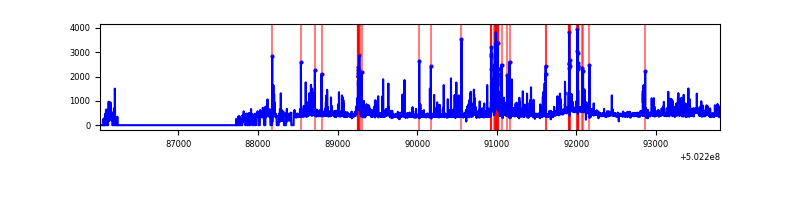 |
| D | 7758 | 5926 | 476 | 476 | 6.14% | 8.03% | 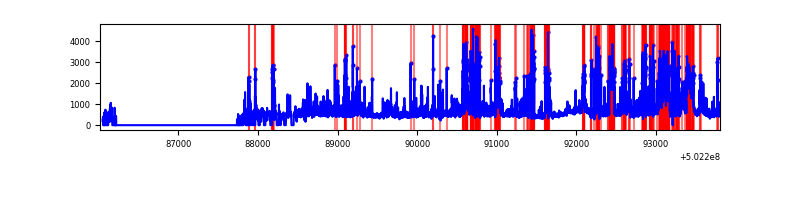 |
Top three noisy pixels from each quadrant. If the there are fewer than three noisy pixels in the level2.evt file, extra rows are filled as -1
| Pixel properties | Quadrant properties | ||||||
|---|---|---|---|---|---|---|---|
| Quadrant | DetID | PixID | Counts | Sigma | Mean | Median | Sigma |
| A | 0 | 8 | 163125 | 1032.6 | 639 | 623 | 157.4 |
| A | 0 | 250 | 39459 | 246.78 | 639 | 623 | 157.4 |
| A | 7 | 190 | 15317 | 93.37 | 639 | 623 | 157.4 |
| B | 4 | 81 | 738088 | 5401.67 | 625 | 602 | 136.5 |
| B | 5 | 185 | 266391 | 1946.75 | 625 | 602 | 136.5 |
| B | 12 | 111 | 16930 | 119.59 | 625 | 602 | 136.5 |
| C | 12 | 250 | 141381 | 828.02 | 619 | 614 | 170.0 |
| C | 1 | 16 | 96583 | 564.51 | 619 | 614 | 170.0 |
| C | 13 | 3 | 91493 | 534.57 | 619 | 614 | 170.0 |
| D | 15 | 94 | 1365585 | 8121.39 | 593 | 568 | 168.1 |
| D | 11 | 129 | 457961 | 2721.34 | 593 | 568 | 168.1 |
| D | 6 | 239 | 206383 | 1224.53 | 593 | 568 | 168.1 |
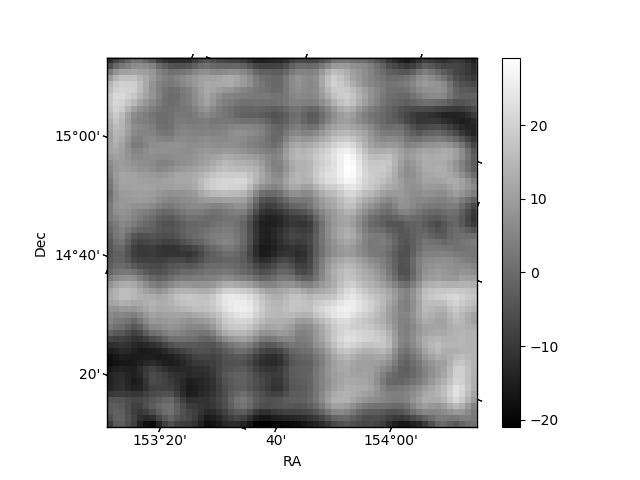
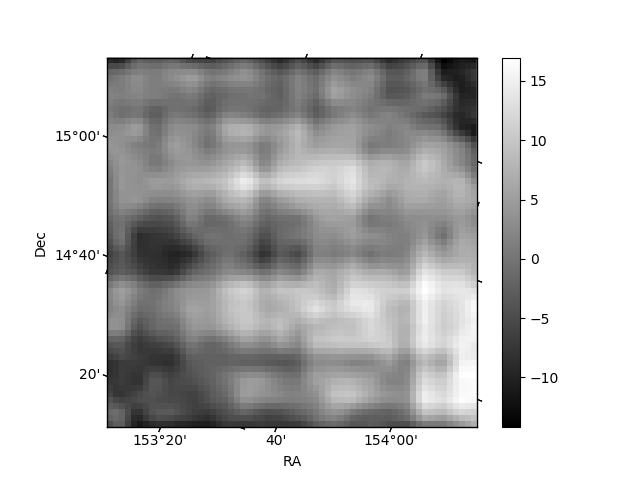
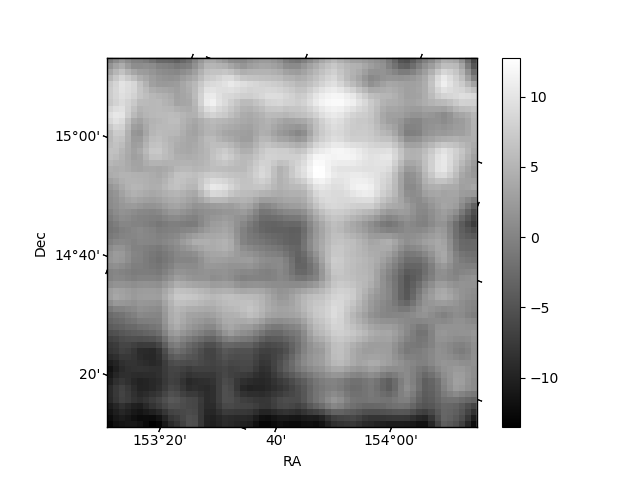
Histogram calculated using DETX and DETY for each event in the final _common_clean file
| Quadrant A | 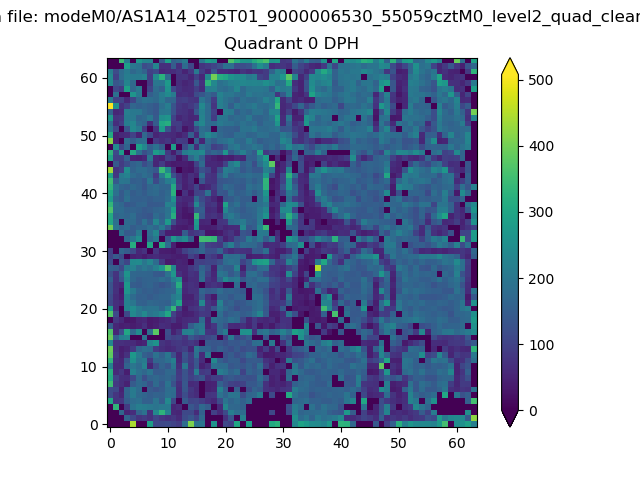 |
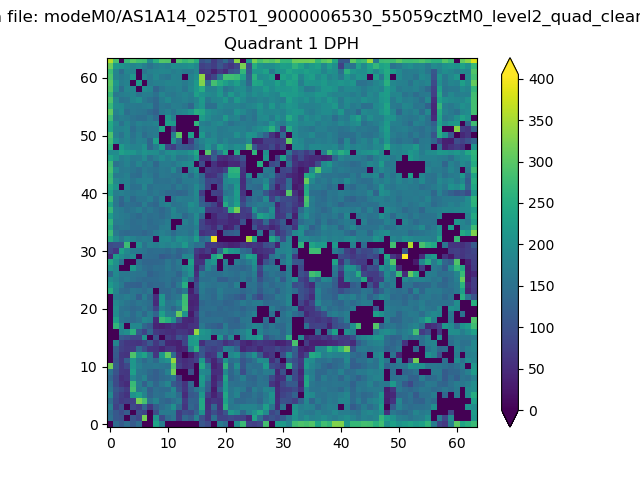 |
Quadrant B |
|---|---|---|---|
| Quadrant D | 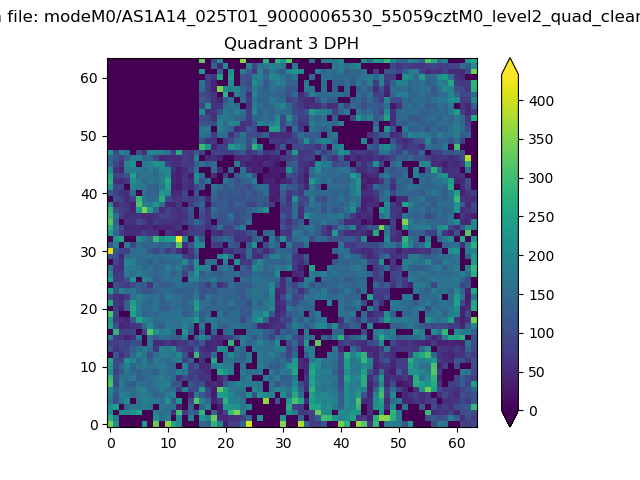 |
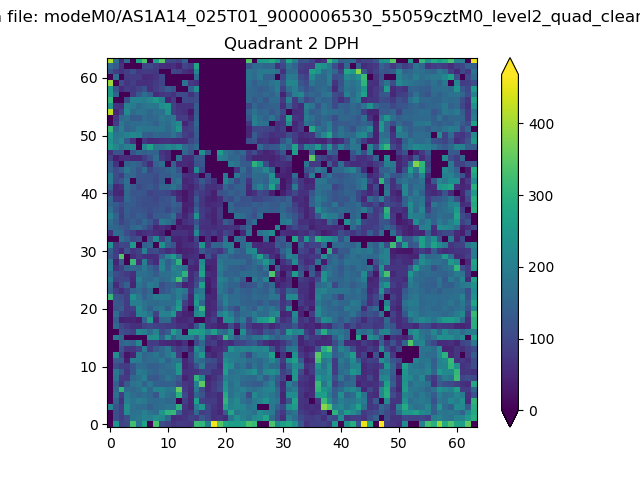 |
Quadrant C |
| Plot type | Count rate plots | Images |
|---|---|---|
| Comparison with Poisson distribution Blue bars denote a histogram of data divided into 1 sec bins. Red curve is a Poisson curve with rate = median count rate of data. |
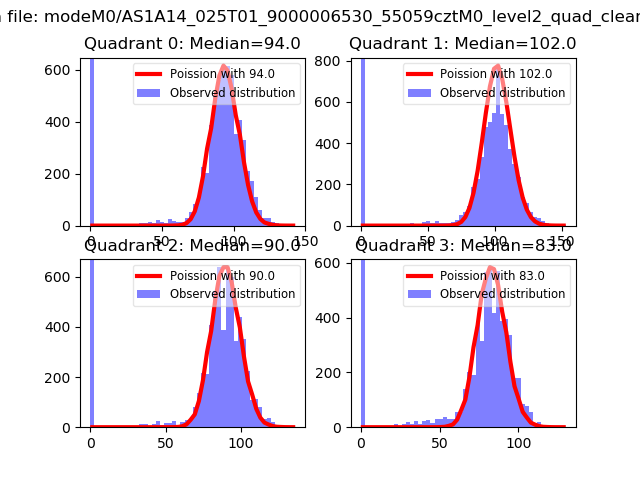 |
 |
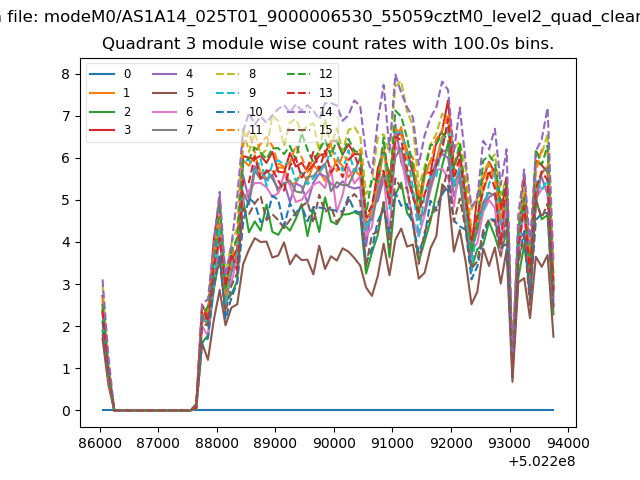
| Quadrant-wise count rates Data is divided into 100 sec bins |
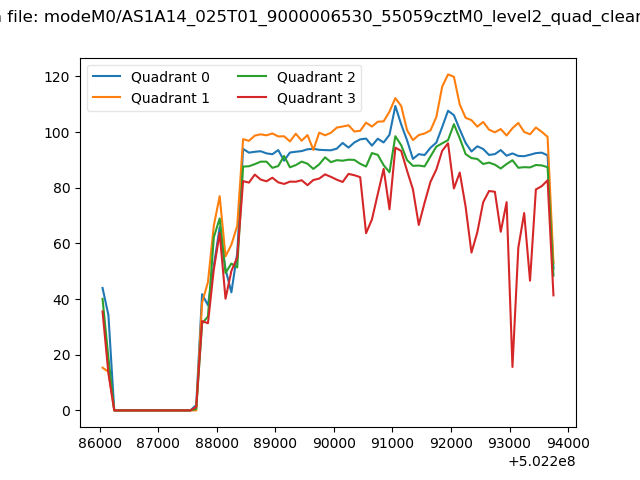 |
|
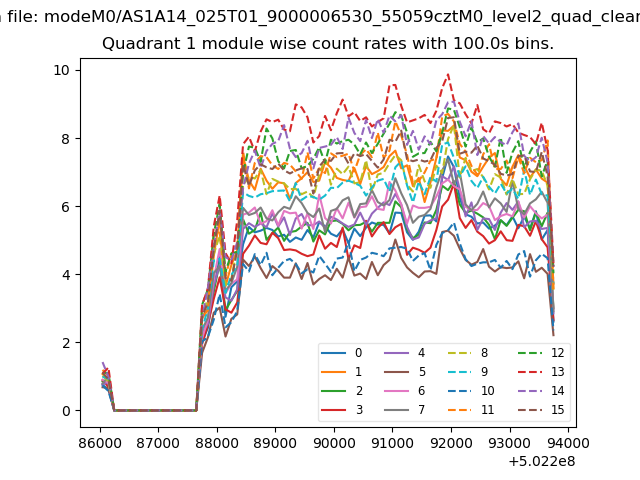
| Module-wise count rates for Quadrant A Data is divided into 100 sec bins |
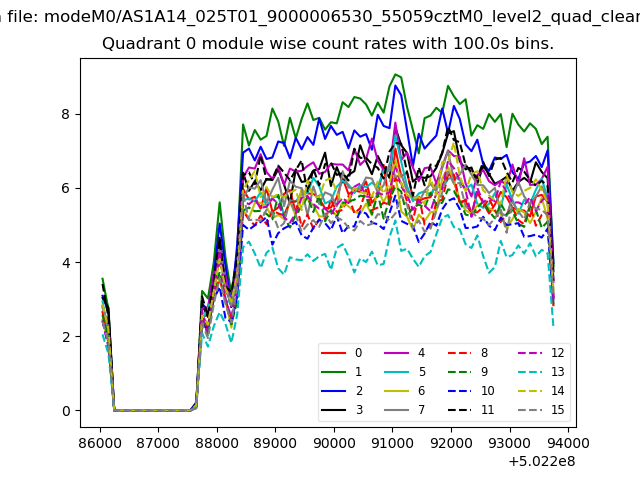 |
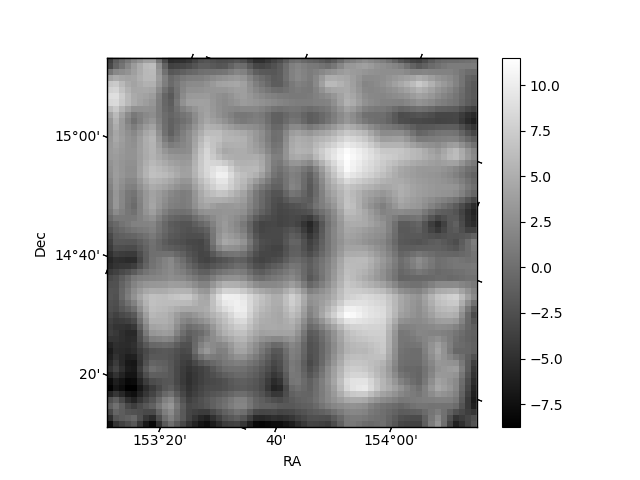 |
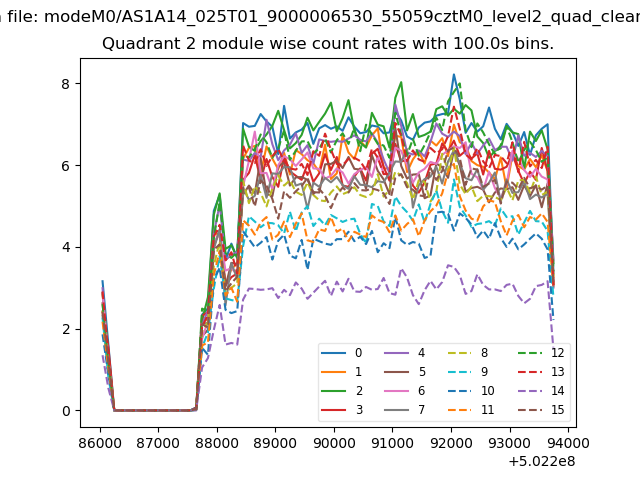
| Module-wise count rates for Quadrant B Data is divided into 100 sec bins |
 |
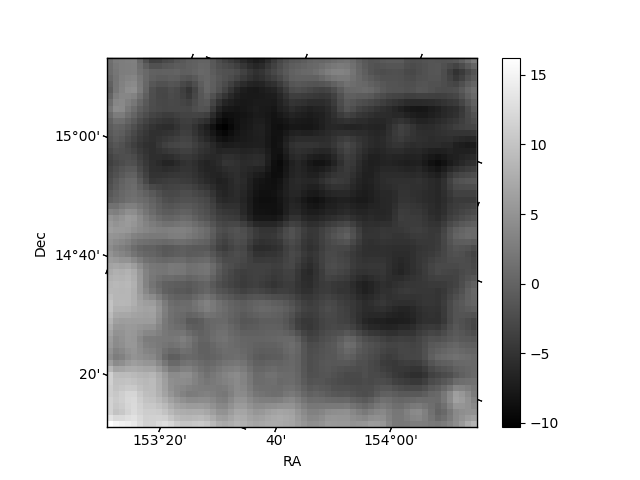 |
| Module-wise count rates for Quadrant C Data is divided into 100 sec bins |
 |
 |
| Module-wise count rates for Quadrant D Data is divided into 100 sec bins |
 |
 |
| Parameter | Plot |
|---|---|
| CZT HV Monitor | 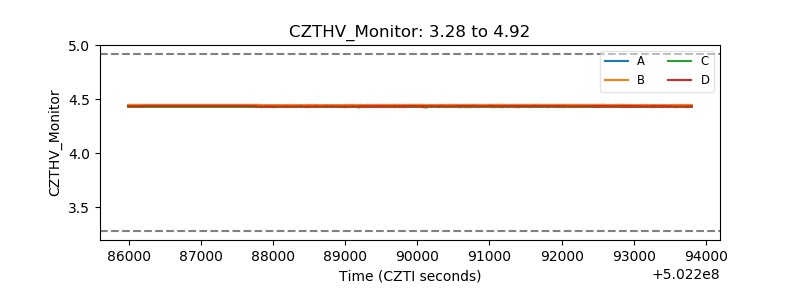 |
| D_VDD | 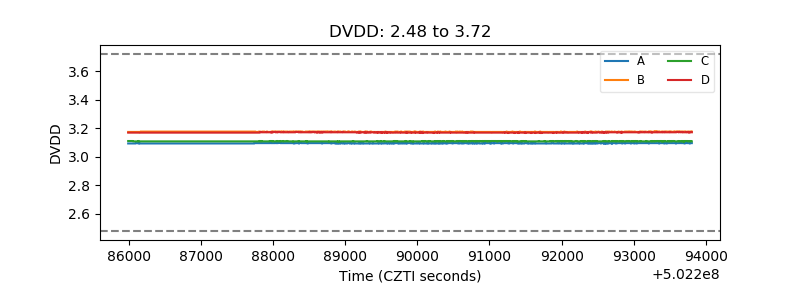 |
| Temperature 1 | 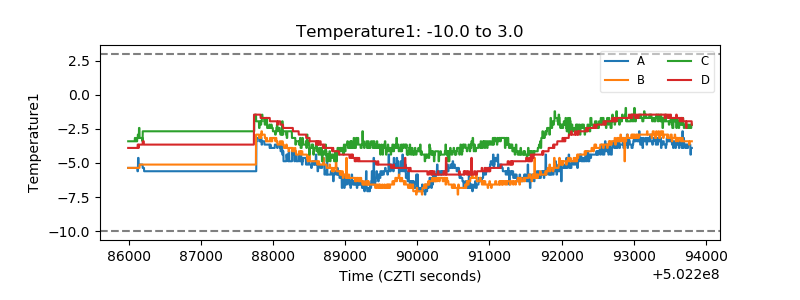 |
| Veto HV Monitor | 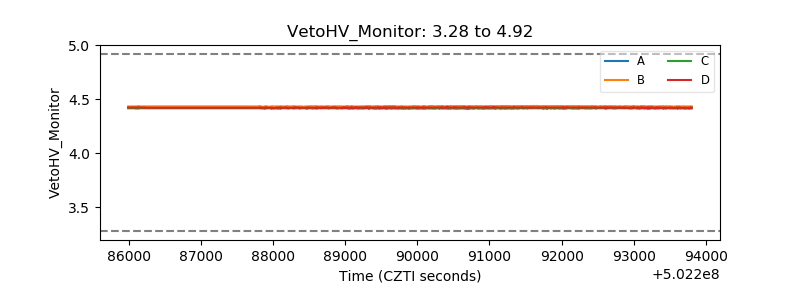 |
| Veto LLD | 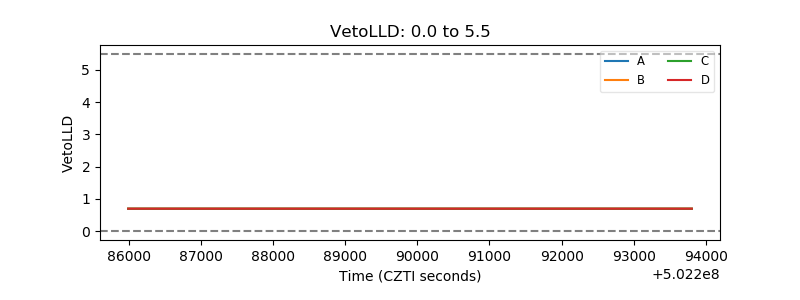 |
| Alpha Counter |  |
| _CPM_Rate | 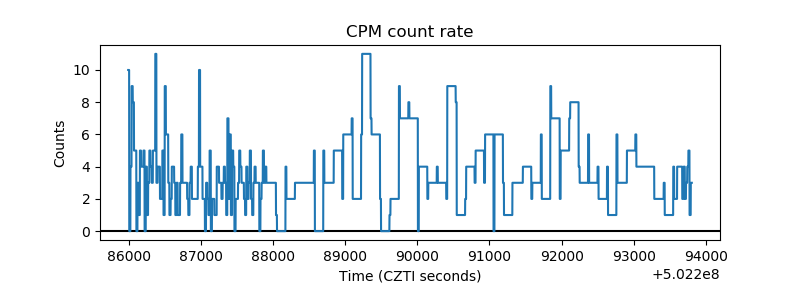 |
| CZT Counter | 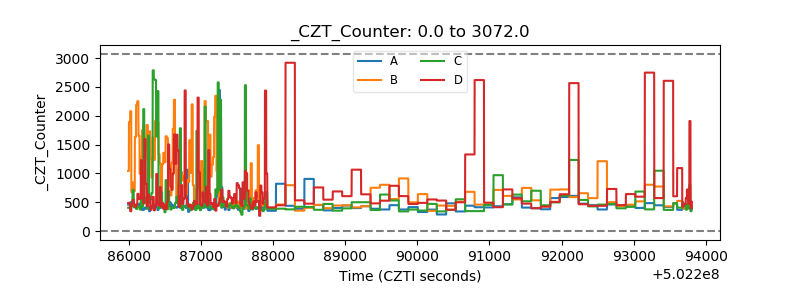 |
| +2.5 Volts monitor |  |
| +5 Volts monitor |  |
| _ROLL_ROT | 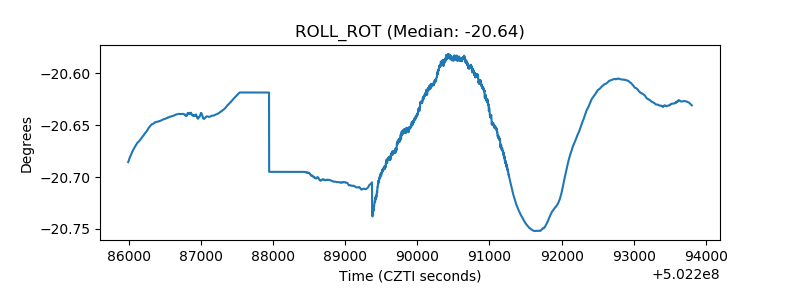 |
| _Roll_DEC | 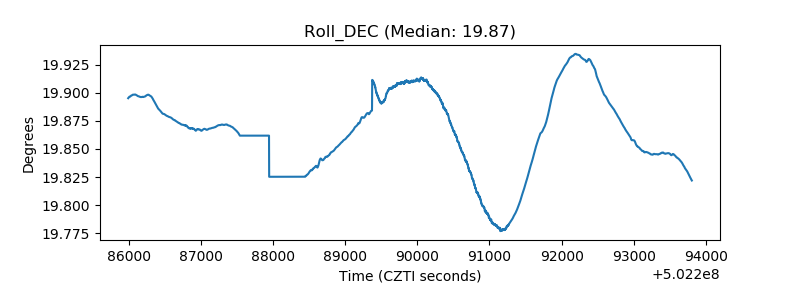 |
| _Roll_RA | 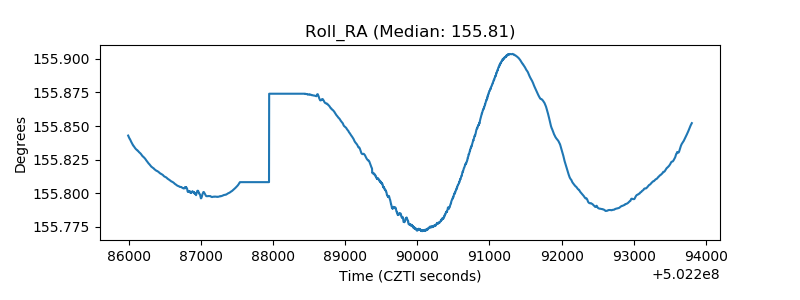 |
| Veto Counter | 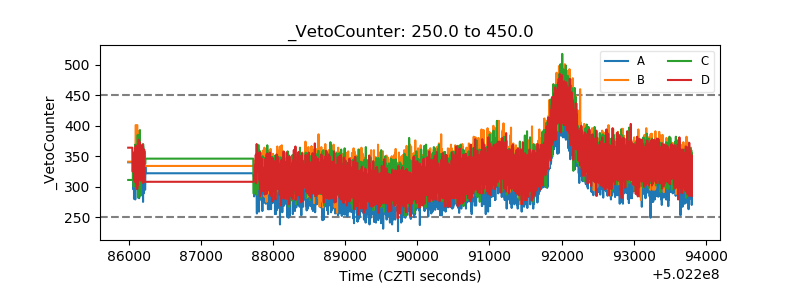 |