| Param | Original file | Final file |
|---|---|---|
| Filename | modeM0/AS1A14_025T01_9000006530_55067cztM0_level2.fits | modeM0/AS1A14_025T01_9000006530_55067cztM0_level2_quad_clean.evt |
| Size (bytes) | 1,530,512,640 | 307,969,920 |
| Size | 1.4 GB | 293.7 MB |
| Events in quadrant A | 11,545,794 | 2,049,297 |
| Events in quadrant B | 11,797,824 | 2,220,622 |
| Events in quadrant C | 11,345,780 | 1,964,400 |
| Events in quadrant D | 20,283,027 | 1,593,291 |
| Mode M0 | |||
|---|---|---|---|
| Quadrant | BADHDUFLAG | Total packets | Discarded packets |
| A | 0 | 54929 | 4368 |
| B | 0 | 55256 | 4508 |
| C | 0 | 53914 | 4113 |
| D | 0 | 83154 | 7697 |
| Mode SS | |||
|---|---|---|---|
| Quadrant | BADHDUFLAG | Total packets | Discarded packets |
| A | 0 | 476 | 34 |
| B | 0 | 475 | 37 |
| C | 0 | 476 | 36 |
| D | 0 | 473 | 33 |
| Mode M9 | |||
|---|---|---|---|
| Quadrant | BADHDUFLAG | Total packets | Discarded packets |
| A | 0 | 20 | 0 |
| B | 0 | 20 | 0 |
| C | 0 | 21 | 0 |
| D | 0 | 22 | 1 |
| Quadrant | Total seconds | Saturated seconds | Saturation percentage |
|---|---|---|---|
| A | 21802 | 587 | 2.692414% |
| B | 21694 | 440 | 2.028211% |
| C | 21749 | 363 | 1.669042% |
| D | 21685 | 3101 | 14.300208% |
Noise dominated data is calculated using 1-second bins in cleaned event files. If a bin has >2000 counts, and if more than 50% of those come from <1% of pixels, then it is considered to be noise-dominated and hence unusable.
| Quadrant | # 1 sec bins | Bins with >0 counts | Bins with >2000 counts | High rate bins dominated by noise | Noise dominated (total time) | Noise dominated (detector-on time) | Marked lightcurve |
|---|---|---|---|---|---|---|---|
| A | 51321 | 22017 | 483 | 483 | 0.94% | 2.19% | 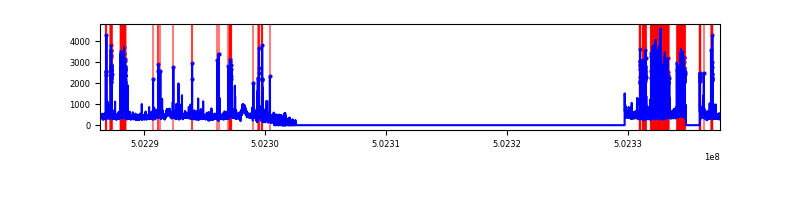 |
| B | 51320 | 21938 | 195 | 195 | 0.38% | 0.89% | 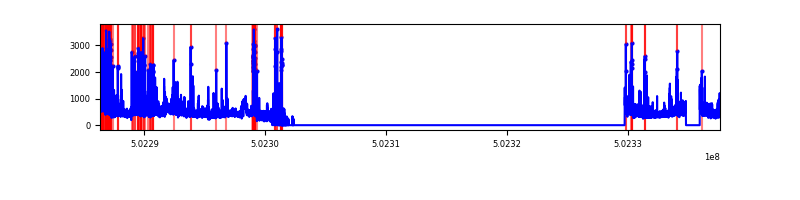 |
| C | 51320 | 21977 | 270 | 270 | 0.53% | 1.23% | 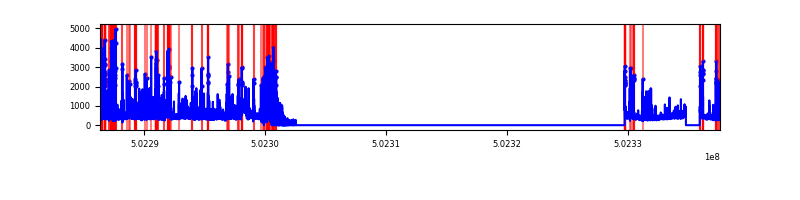 |
| D | 51321 | 21915 | 2708 | 2708 | 5.28% | 12.36% | 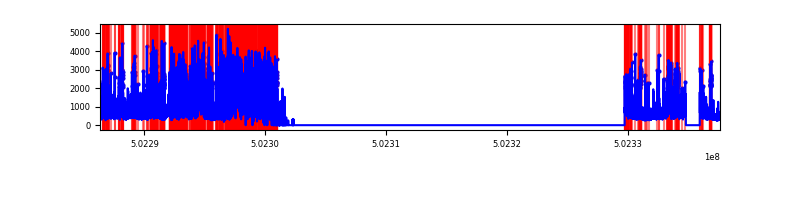 |
Top three noisy pixels from each quadrant. If the there are fewer than three noisy pixels in the level2.evt file, extra rows are filled as -1
| Pixel properties | Quadrant properties | ||||||
|---|---|---|---|---|---|---|---|
| Quadrant | DetID | PixID | Counts | Sigma | Mean | Median | Sigma |
| A | 0 | 8 | 1613379 | 2815.23 | 2362 | 2316 | 572.3 |
| A | 15 | 32 | 185860 | 320.73 | 2362 | 2316 | 572.3 |
| A | 3 | 14 | 133325 | 228.93 | 2362 | 2316 | 572.3 |
| B | 5 | 185 | 1365731 | 2714.53 | 2341 | 2254 | 502.3 |
| B | 4 | 81 | 1027175 | 2040.5 | 2341 | 2254 | 502.3 |
| B | 10 | 247 | 88031 | 170.77 | 2341 | 2254 | 502.3 |
| C | 13 | 3 | 670446 | 1058.38 | 2306 | 2287 | 631.3 |
| C | 9 | 38 | 339051 | 533.44 | 2306 | 2287 | 631.3 |
| C | 1 | 16 | 253055 | 397.22 | 2306 | 2287 | 631.3 |
| D | 15 | 94 | 3411092 | 5616.89 | 2145 | 2051 | 606.9 |
| D | 11 | 129 | 3258838 | 5366.03 | 2145 | 2051 | 606.9 |
| D | 3 | 12 | 1465756 | 2411.67 | 2145 | 2051 | 606.9 |
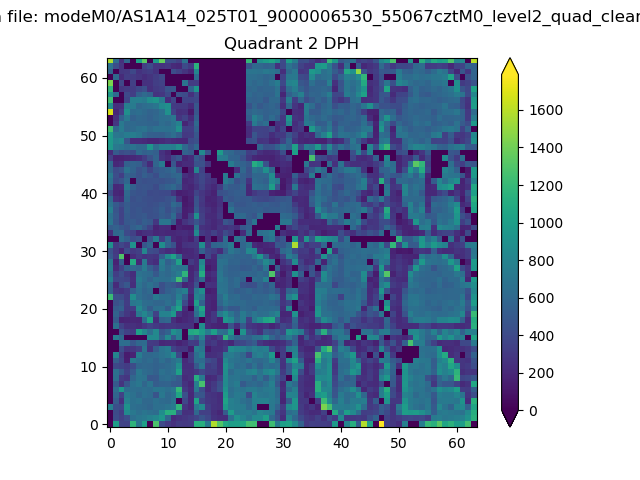
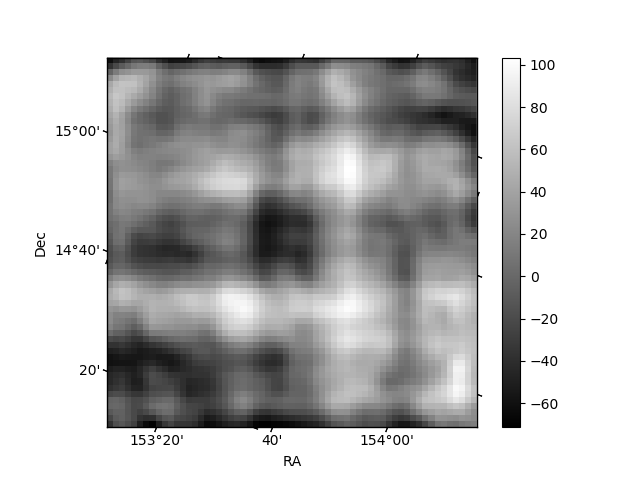
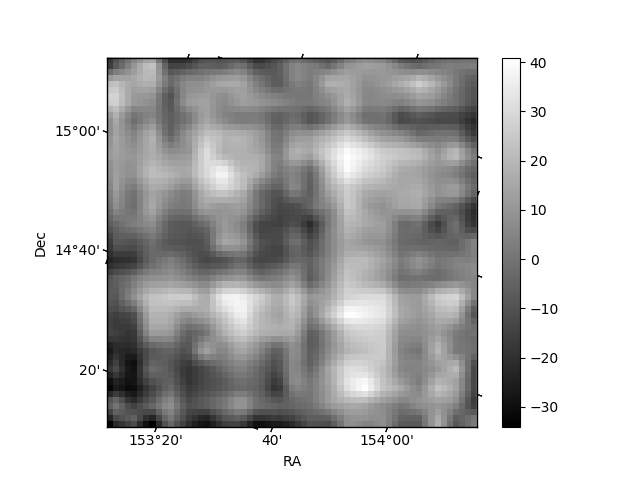
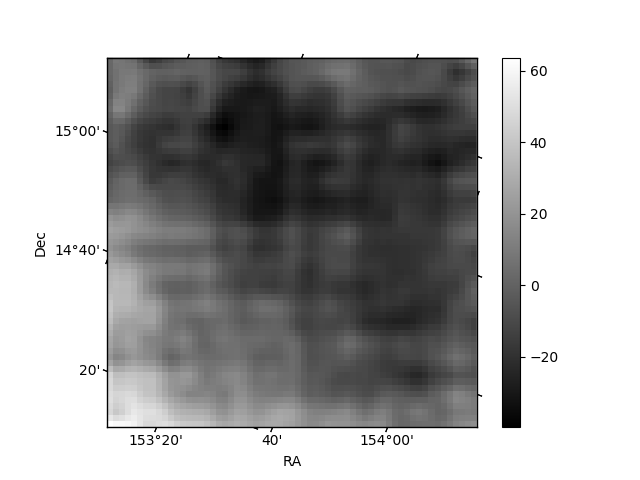
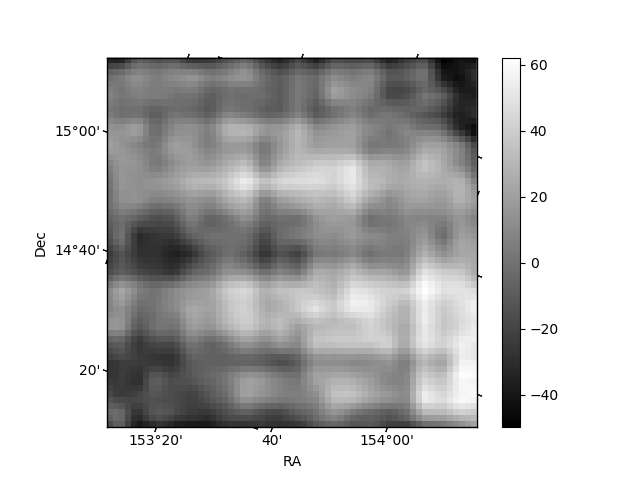
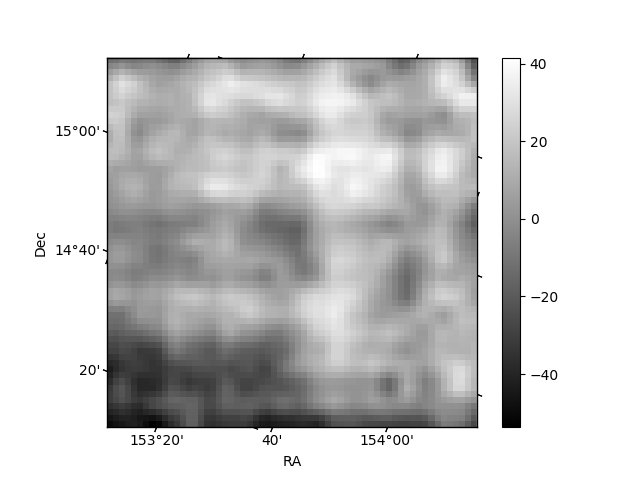
Histogram calculated using DETX and DETY for each event in the final _common_clean file
| Quadrant A | 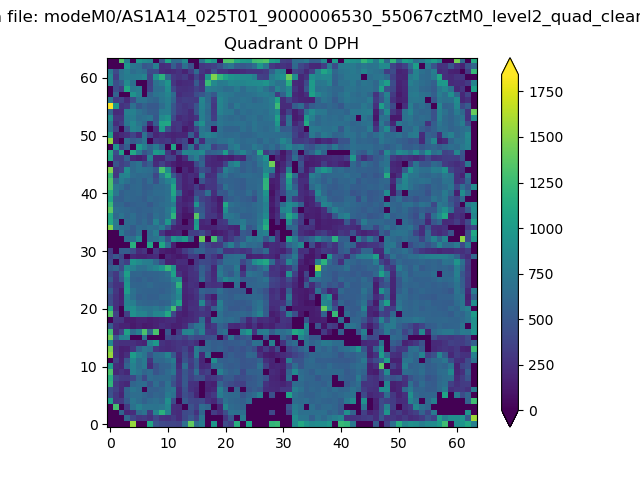 |
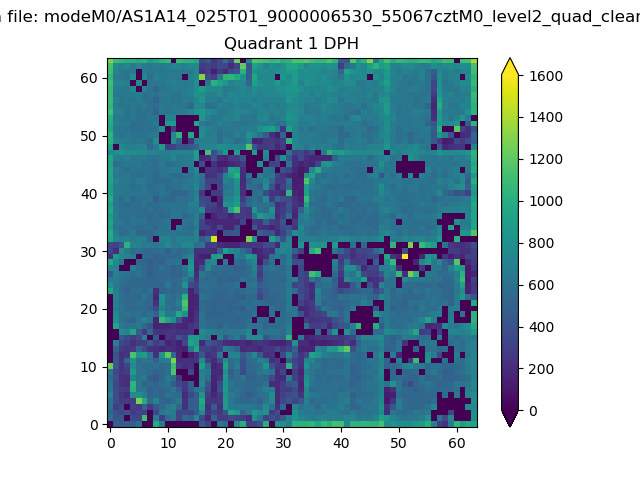 |
Quadrant B |
|---|---|---|---|
| Quadrant D | 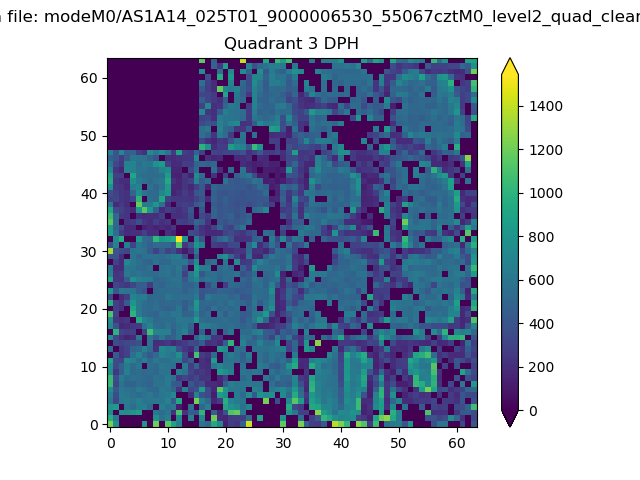 |
 |
Quadrant C |
| Plot type | Count rate plots | Images |
|---|---|---|
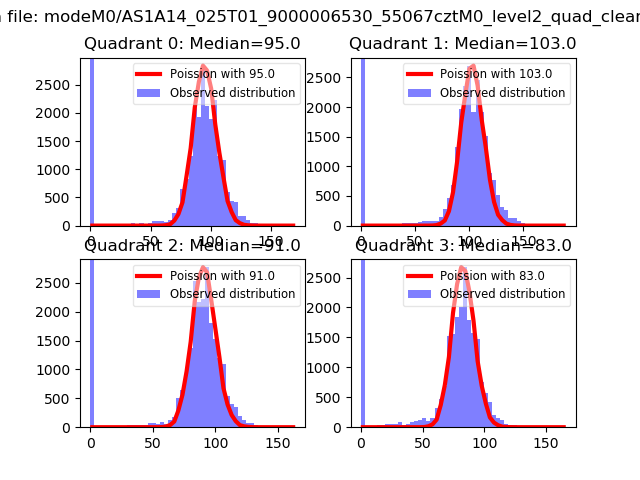
| Comparison with Poisson distribution Blue bars denote a histogram of data divided into 1 sec bins. Red curve is a Poisson curve with rate = median count rate of data. |
 |
 |
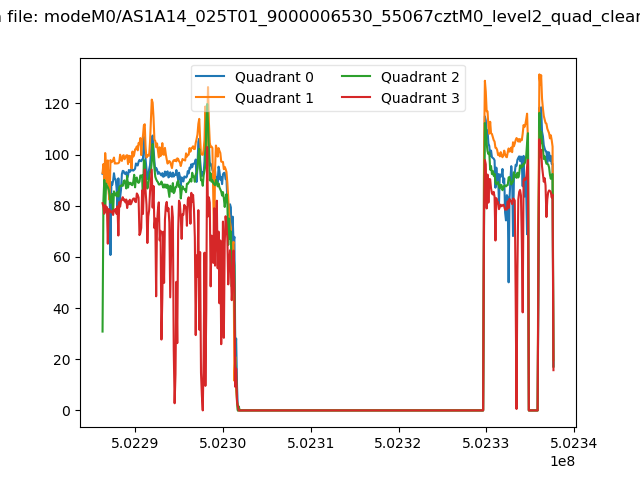
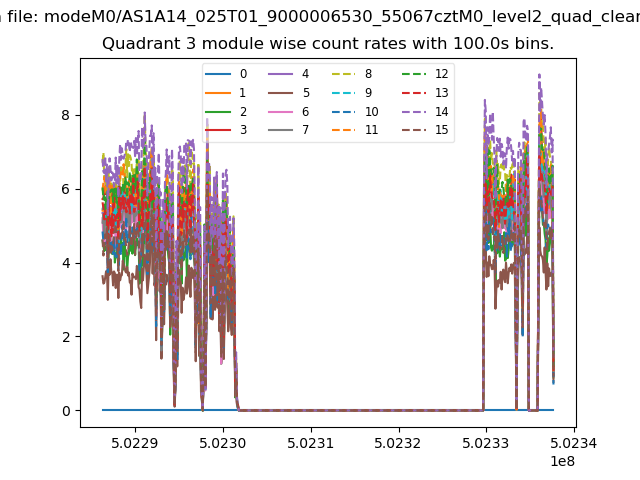
| Quadrant-wise count rates Data is divided into 100 sec bins |
 |
|
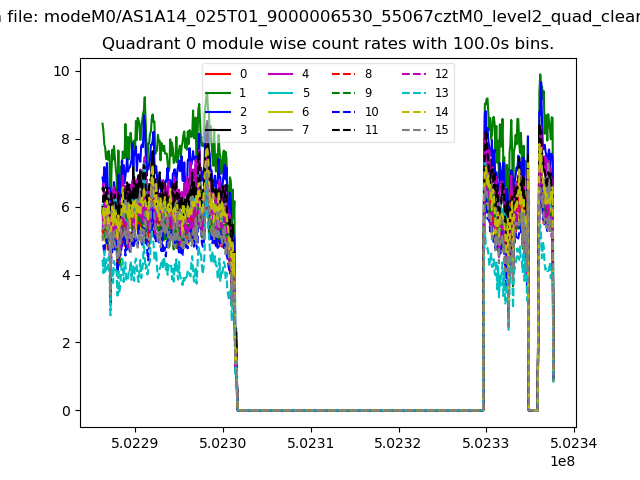
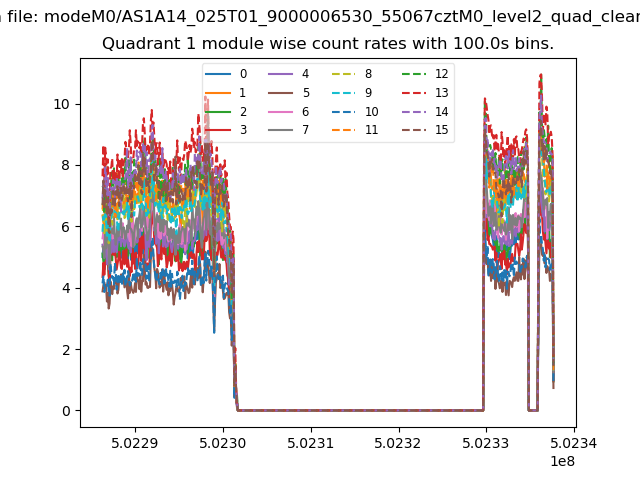
| Module-wise count rates for Quadrant A Data is divided into 100 sec bins |
 |
 |
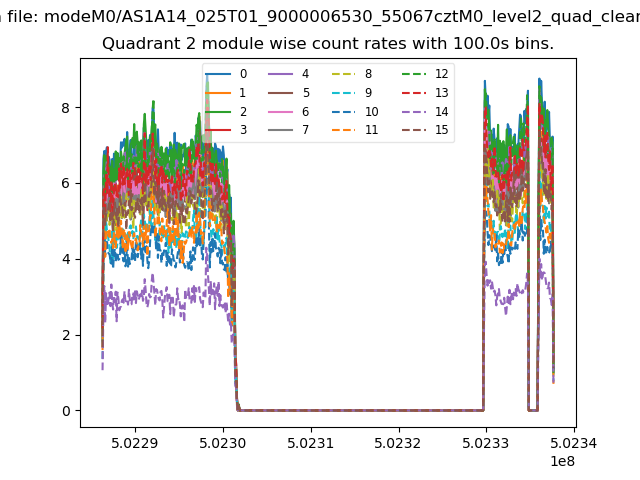
| Module-wise count rates for Quadrant B Data is divided into 100 sec bins |
 |
 |
| Module-wise count rates for Quadrant C Data is divided into 100 sec bins |
 |
 |
| Module-wise count rates for Quadrant D Data is divided into 100 sec bins |
 |
 |
| Parameter | Plot |
|---|---|
| CZT HV Monitor | 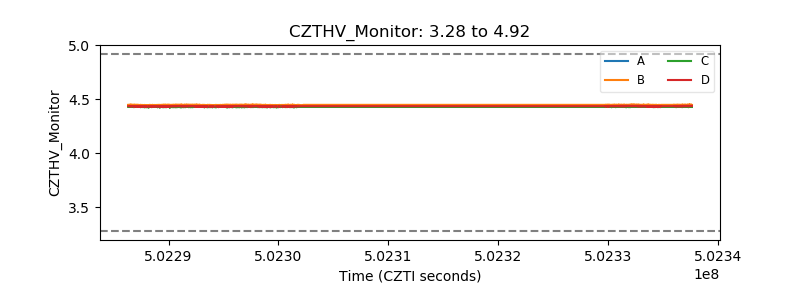 |
| D_VDD | 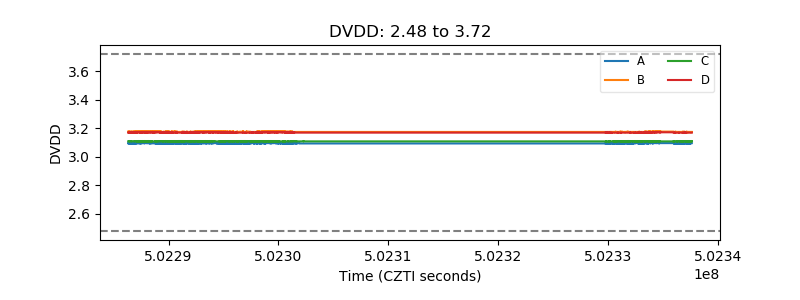 |
| Temperature 1 | 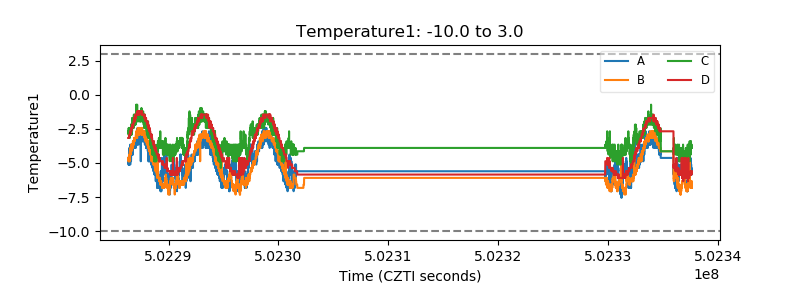 |
| Veto HV Monitor | 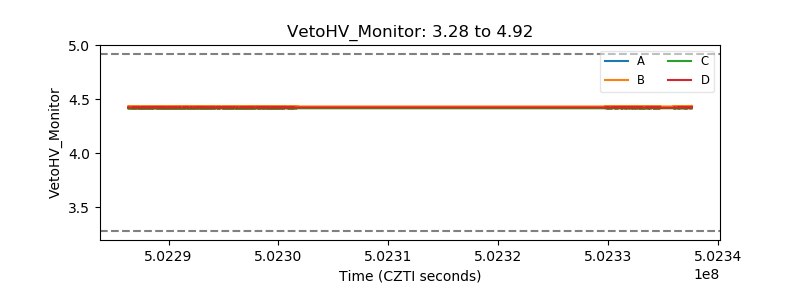 |
| Veto LLD | 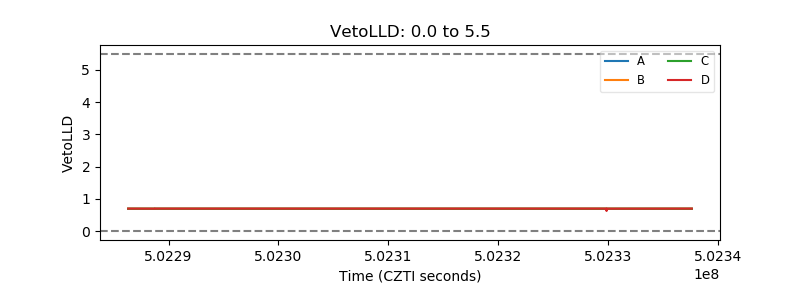 |
| Alpha Counter | 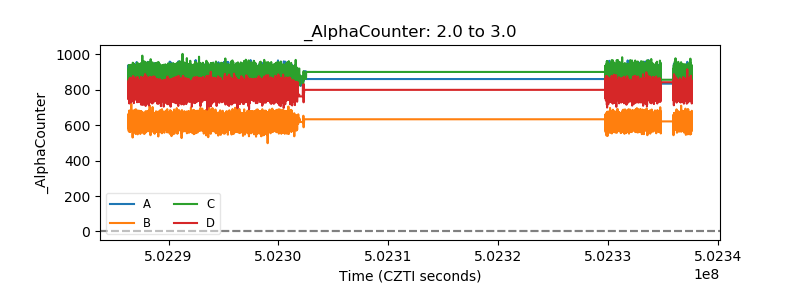 |
| _CPM_Rate | 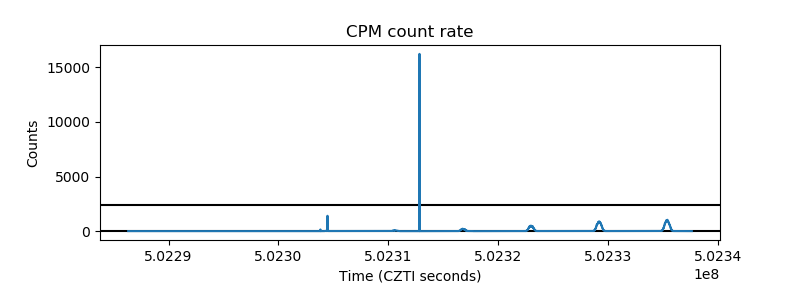 |
| CZT Counter | 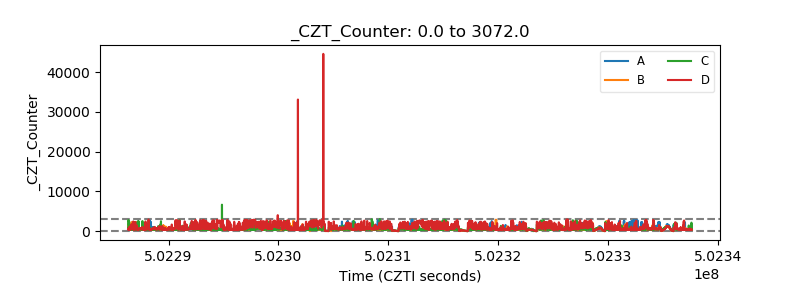 |
| +2.5 Volts monitor | 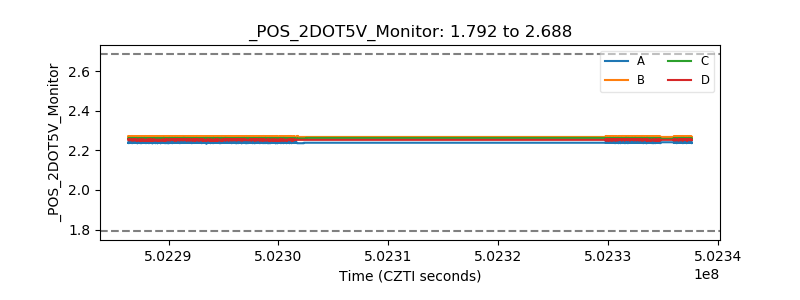 |
| +5 Volts monitor |  |
| _ROLL_ROT | 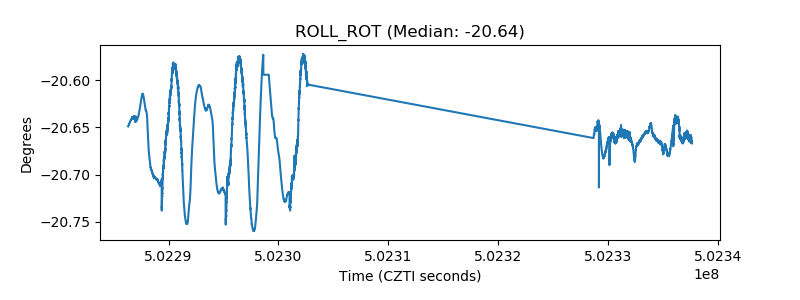 |
| _Roll_DEC | 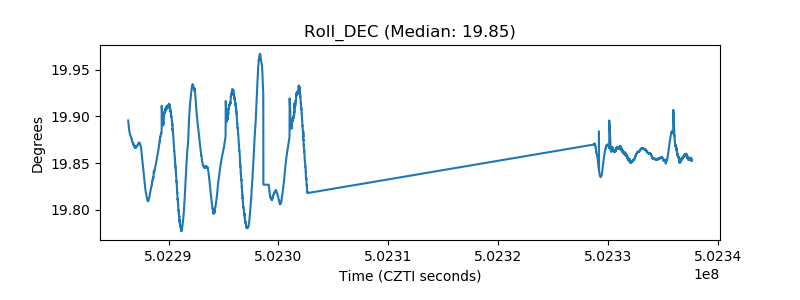 |
| _Roll_RA | 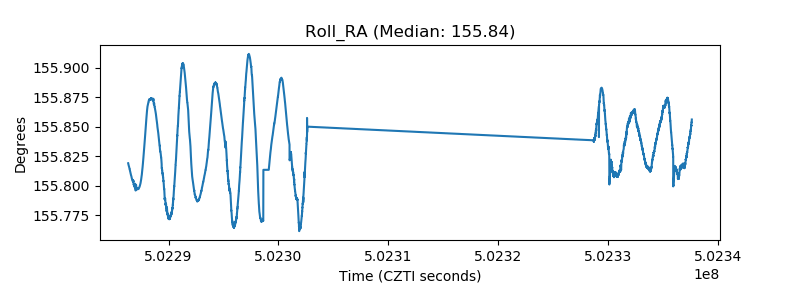 |
| Veto Counter | 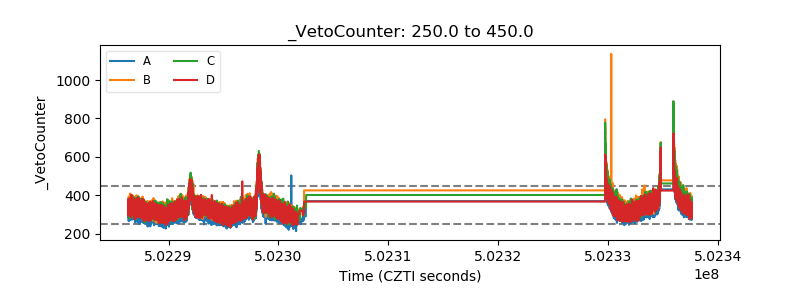 |