| Param | Original file | Final file |
|---|---|---|
| Filename | modeM0/AS1A14_025T01_9000006530_55069cztM0_level2.fits | modeM0/AS1A14_025T01_9000006530_55069cztM0_level2_quad_clean.evt |
| Size (bytes) | 431,720,640 | 92,661,120 |
| Size | 411.7 MB | 88.4 MB |
| Events in quadrant A | 3,861,187 | 602,547 |
| Events in quadrant B | 3,992,808 | 637,707 |
| Events in quadrant C | 3,132,276 | 591,760 |
| Events in quadrant D | 4,506,560 | 536,149 |
| Mode M0 | |||
|---|---|---|---|
| Quadrant | BADHDUFLAG | Total packets | Discarded packets |
| A | 0 | 15947 | 1 |
| B | 0 | 16245 | 2 |
| C | 0 | 13974 | 1 |
| D | 0 | 17729 | 1 |
| Mode SS | |||
|---|---|---|---|
| Quadrant | BADHDUFLAG | Total packets | Discarded packets |
| A | 0 | 126 | 0 |
| B | 0 | 126 | 0 |
| C | 0 | 126 | 0 |
| D | 0 | 126 | 0 |
| Mode M9 | |||
|---|---|---|---|
| Quadrant | BADHDUFLAG | Total packets | Discarded packets |
| A | 0 | 12 | 0 |
| B | 0 | 12 | 0 |
| C | 0 | 12 | 0 |
| D | 0 | 12 | 0 |
| Quadrant | Total seconds | Saturated seconds | Saturation percentage |
|---|---|---|---|
| A | 6277 | 267 | 4.253624% |
| B | 6276 | 449 | 7.154238% |
| C | 6277 | 55 | 0.876215% |
| D | 6277 | 266 | 4.237693% |
Noise dominated data is calculated using 1-second bins in cleaned event files. If a bin has >2000 counts, and if more than 50% of those come from <1% of pixels, then it is considered to be noise-dominated and hence unusable.
| Quadrant | # 1 sec bins | Bins with >0 counts | Bins with >2000 counts | High rate bins dominated by noise | Noise dominated (total time) | Noise dominated (detector-on time) | Marked lightcurve |
|---|---|---|---|---|---|---|---|
| A | 7422 | 6279 | 220 | 220 | 2.96% | 3.50% | 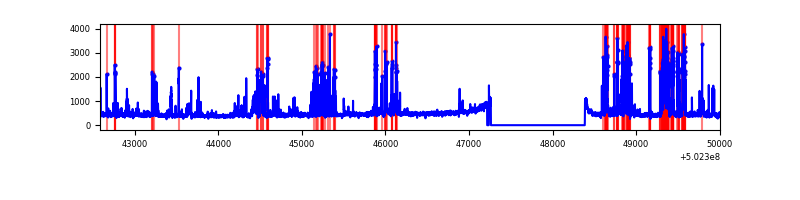 |
| B | 7421 | 6278 | 221 | 221 | 2.98% | 3.52% | 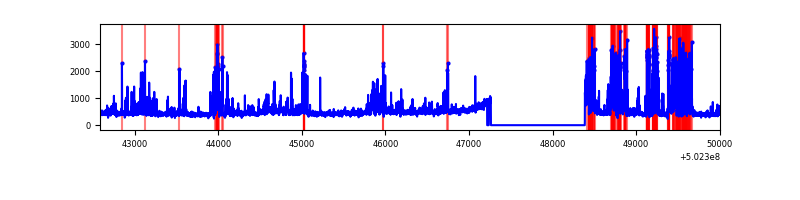 |
| C | 7422 | 6279 | 38 | 38 | 0.51% | 0.61% | 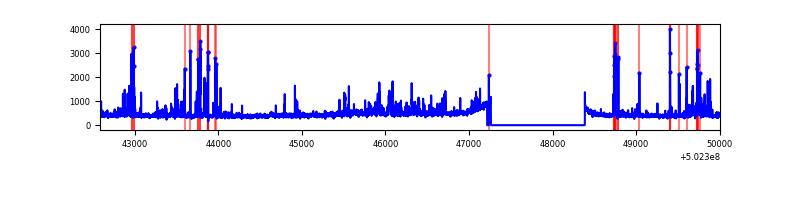 |
| D | 7422 | 6279 | 253 | 253 | 3.41% | 4.03% | 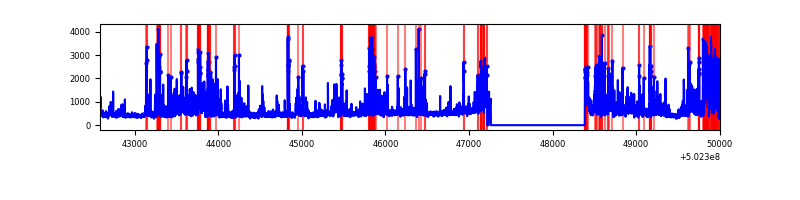 |
Top three noisy pixels from each quadrant. If the there are fewer than three noisy pixels in the level2.evt file, extra rows are filled as -1
| Pixel properties | Quadrant properties | ||||||
|---|---|---|---|---|---|---|---|
| Quadrant | DetID | PixID | Counts | Sigma | Mean | Median | Sigma |
| A | 15 | 32 | 869520 | 5180.51 | 680 | 663 | 167.7 |
| A | 0 | 8 | 153278 | 909.96 | 680 | 663 | 167.7 |
| A | 0 | 250 | 138705 | 823.07 | 680 | 663 | 167.7 |
| B | 5 | 185 | 1300594 | 9153.93 | 664 | 642 | 142.0 |
| B | 10 | 247 | 24868 | 170.59 | 664 | 642 | 142.0 |
| B | 12 | 111 | 17339 | 117.58 | 664 | 642 | 142.0 |
| C | 13 | 3 | 152528 | 827.29 | 668 | 662 | 183.6 |
| C | 14 | 254 | 119298 | 646.27 | 668 | 662 | 183.6 |
| C | 9 | 38 | 110885 | 600.44 | 668 | 662 | 183.6 |
| D | 6 | 239 | 701625 | 3778.13 | 650 | 623 | 185.5 |
| D | 9 | 1 | 466528 | 2511.05 | 650 | 623 | 185.5 |
| D | 3 | 224 | 211464 | 1136.35 | 650 | 623 | 185.5 |
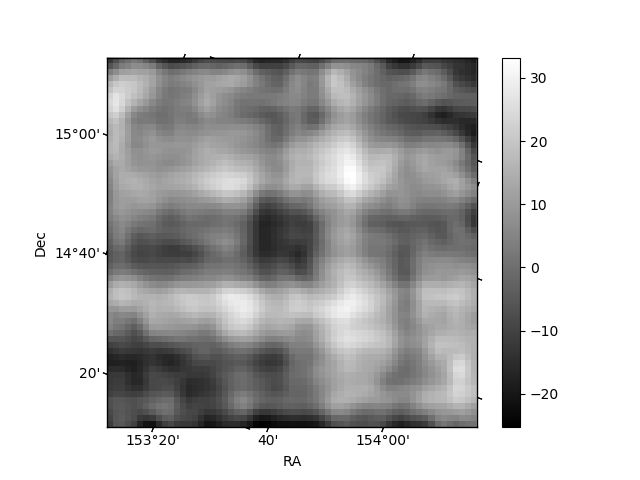
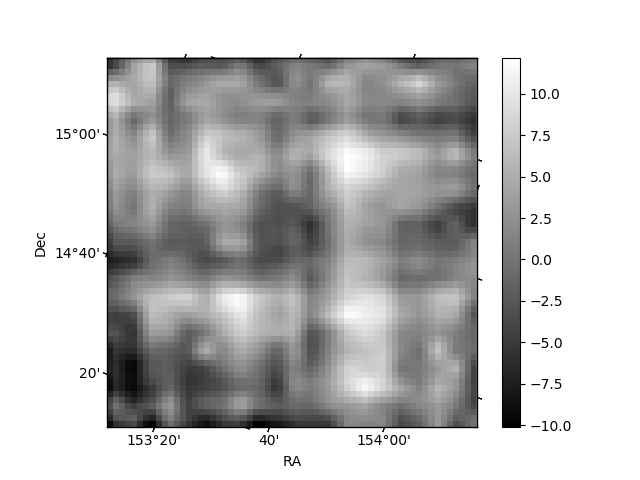
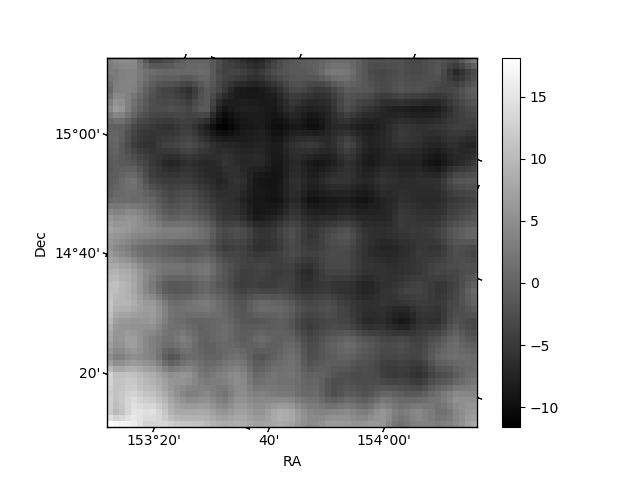
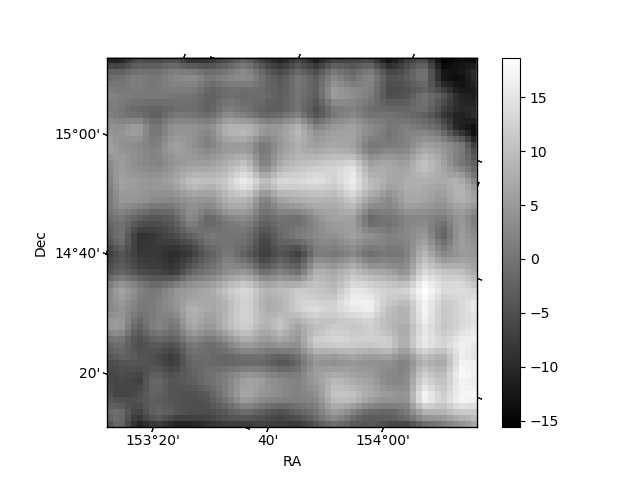
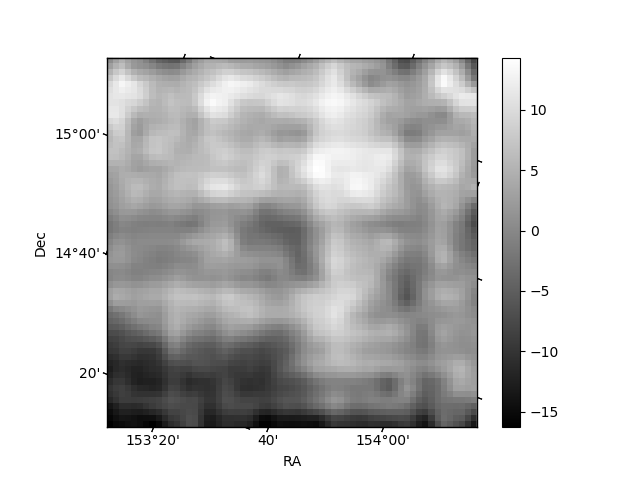
Histogram calculated using DETX and DETY for each event in the final _common_clean file
| Quadrant A | 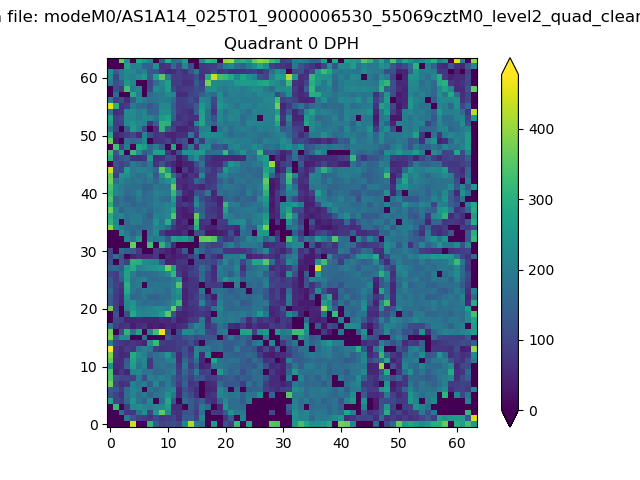 |
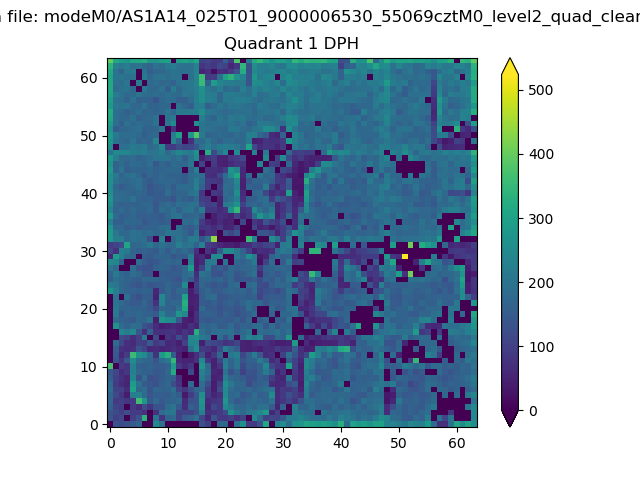 |
Quadrant B |
|---|---|---|---|
| Quadrant D | 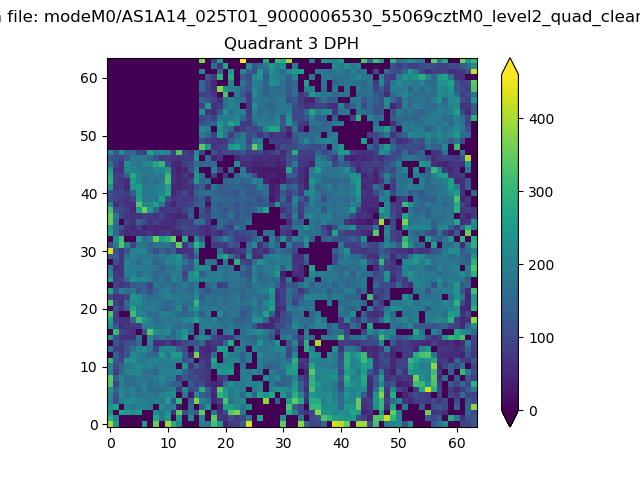 |
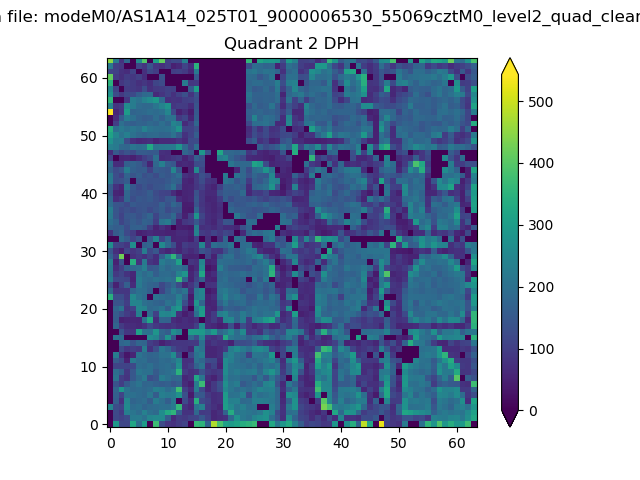 |
Quadrant C |
| Plot type | Count rate plots | Images |
|---|---|---|
| Comparison with Poisson distribution Blue bars denote a histogram of data divided into 1 sec bins. Red curve is a Poisson curve with rate = median count rate of data. |
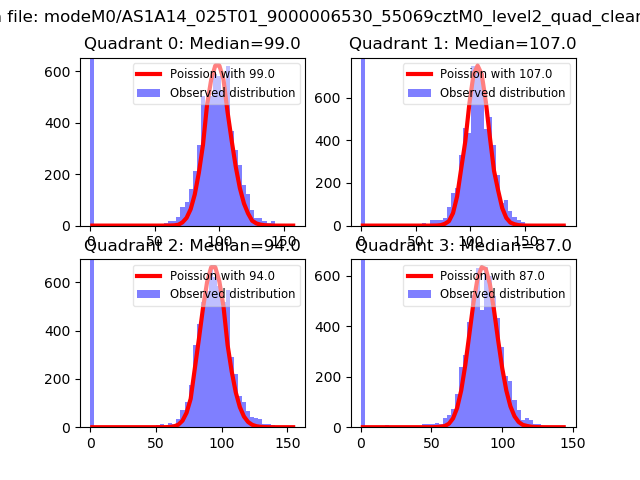 |
 |
| Quadrant-wise count rates Data is divided into 100 sec bins |
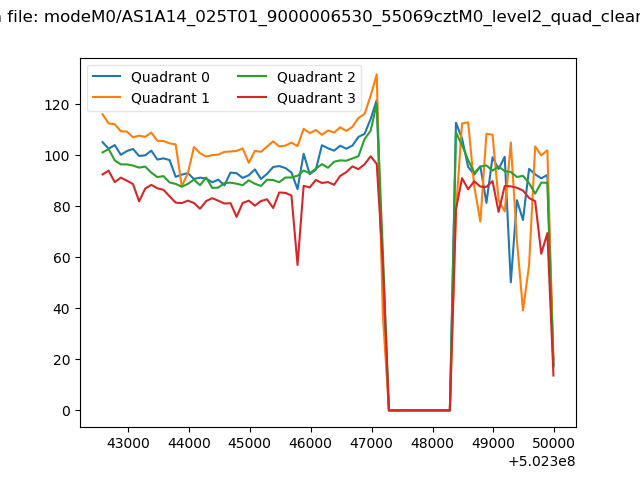 |
|
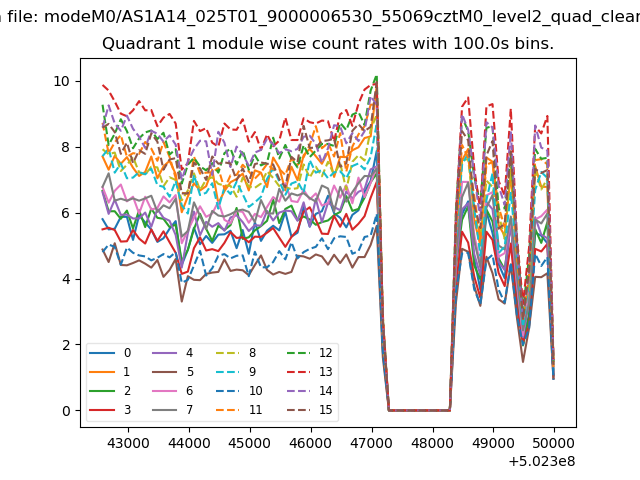
| Module-wise count rates for Quadrant A Data is divided into 100 sec bins |
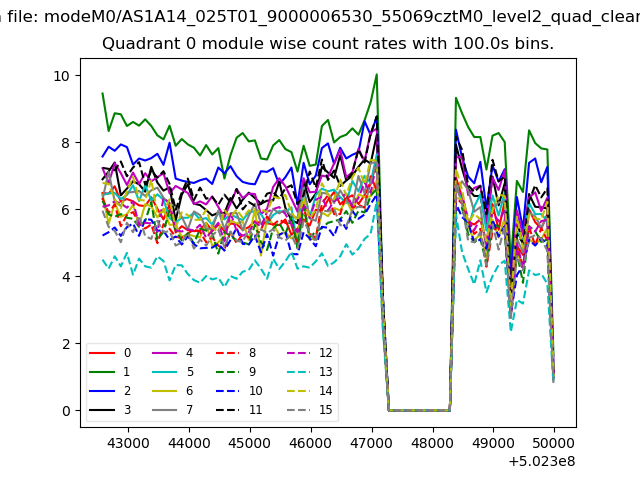 |
 |
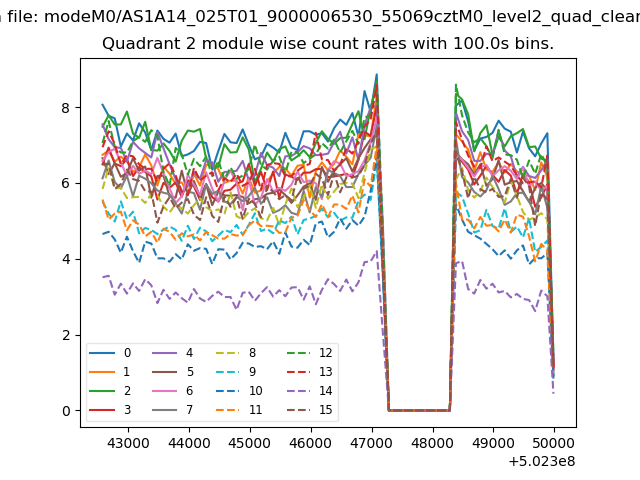
| Module-wise count rates for Quadrant B Data is divided into 100 sec bins |
 |
 |
| Module-wise count rates for Quadrant C Data is divided into 100 sec bins |
 |
 |
| Module-wise count rates for Quadrant D Data is divided into 100 sec bins |
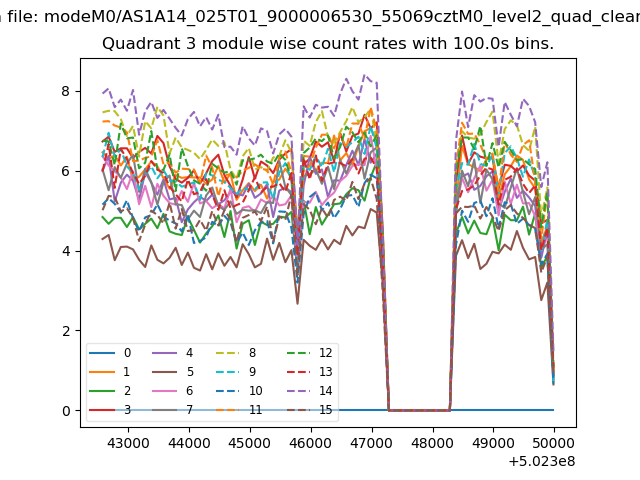 |
 |
| Parameter | Plot |
|---|---|
| CZT HV Monitor | 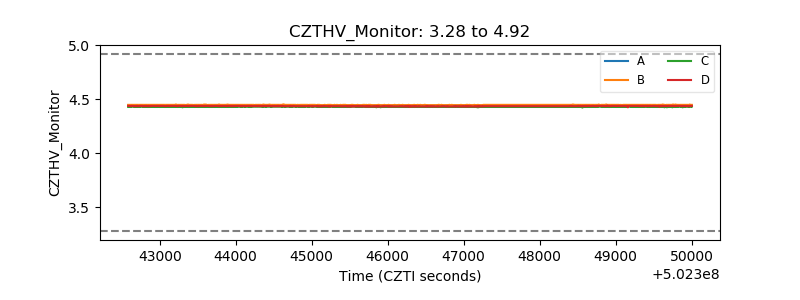 |
| D_VDD | 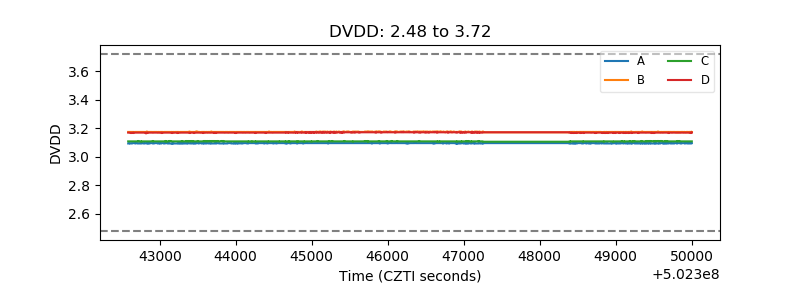 |
| Temperature 1 |  |
| Veto HV Monitor |  |
| Veto LLD | 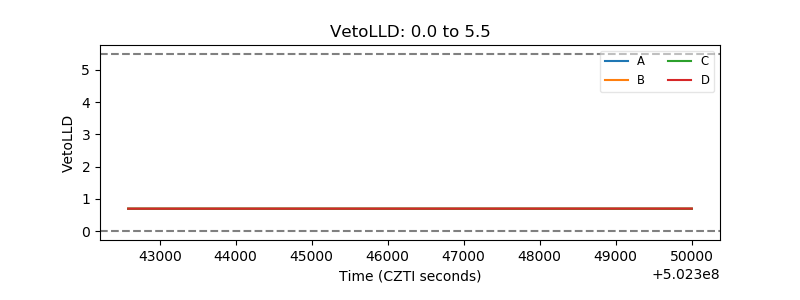 |
| Alpha Counter | 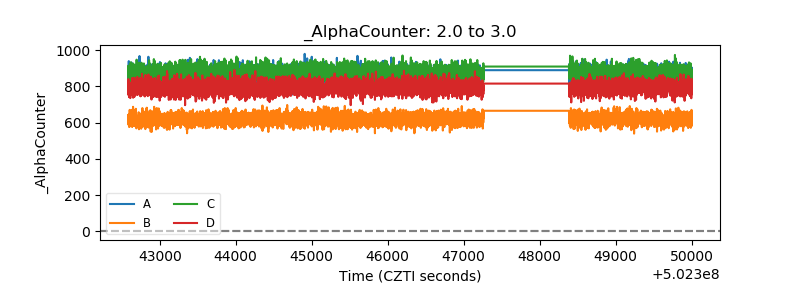 |
| _CPM_Rate | 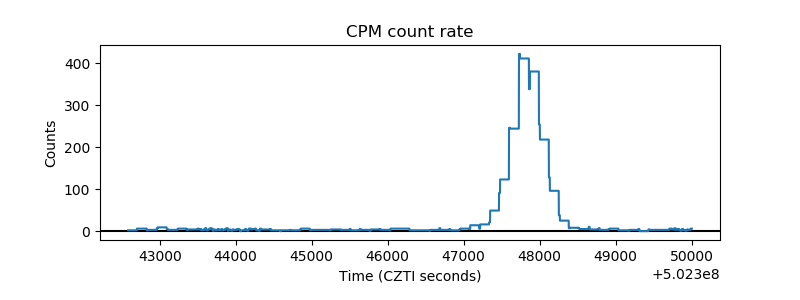 |
| CZT Counter | 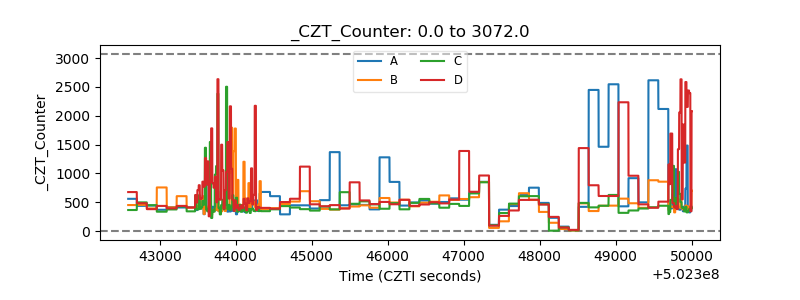 |
| +2.5 Volts monitor | 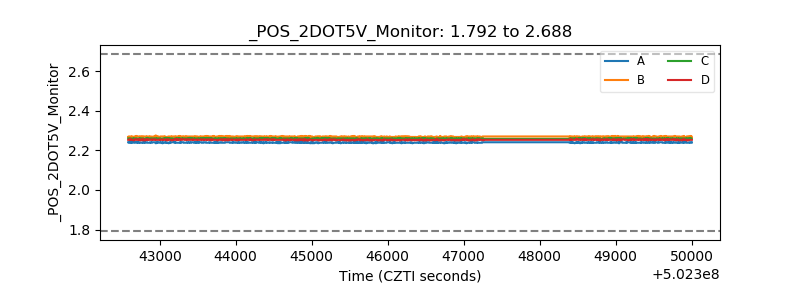 |
| +5 Volts monitor | 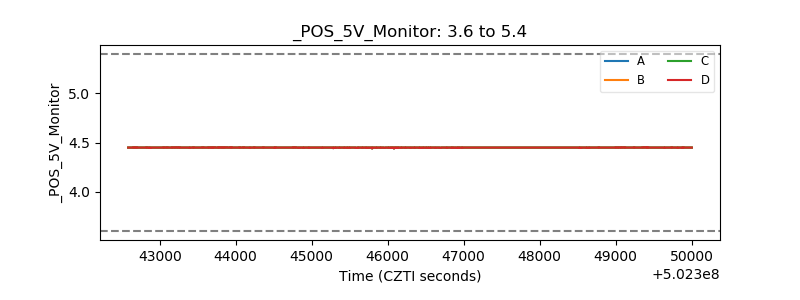 |
| _ROLL_ROT | 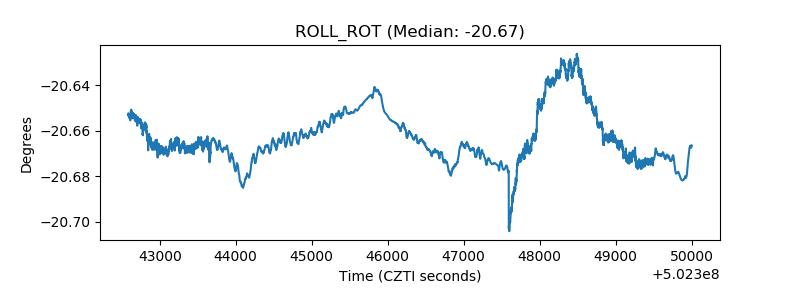 |
| _Roll_DEC | 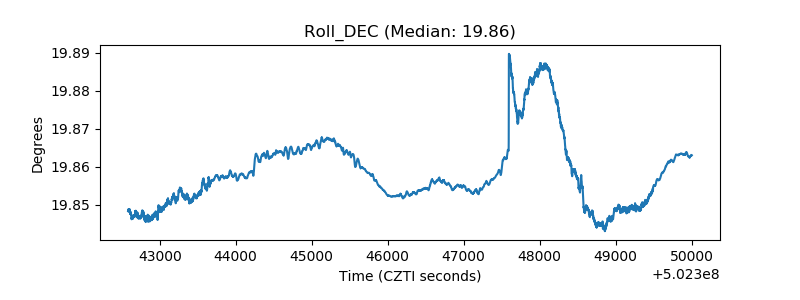 |
| _Roll_RA | 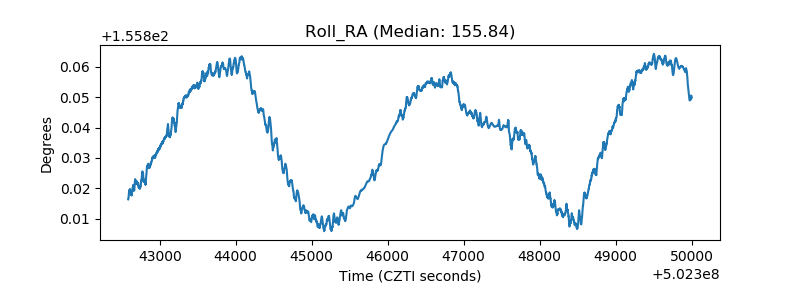 |
| Veto Counter | 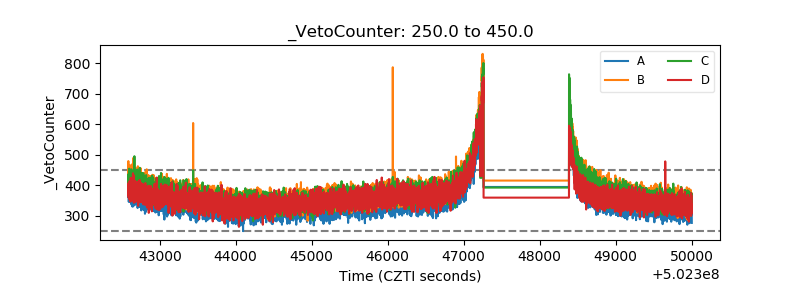 |