| Param | Original file | Final file |
|---|---|---|
| Filename | modeM0/AS1A14_025T01_9000006530_55070cztM0_level2.fits | modeM0/AS1A14_025T01_9000006530_55070cztM0_level2_quad_clean.evt |
| Size (bytes) | 2,872,376,640 | 593,375,040 |
| Size | 2.7 GB | 565.9 MB |
| Events in quadrant A | 23,858,894 | 3,886,167 |
| Events in quadrant B | 21,780,448 | 4,243,502 |
| Events in quadrant C | 20,610,445 | 3,761,869 |
| Events in quadrant D | 36,900,390 | 3,252,073 |
| Mode M0 | |||
|---|---|---|---|
| Quadrant | BADHDUFLAG | Total packets | Discarded packets |
| A | 0 | 100452 | 10 |
| B | 0 | 94307 | 8 |
| C | 0 | 92097 | 8 |
| D | 0 | 138592 | 8 |
| Mode SS | |||
|---|---|---|---|
| Quadrant | BADHDUFLAG | Total packets | Discarded packets |
| A | 0 | 842 | 0 |
| B | 0 | 842 | 0 |
| C | 0 | 842 | 0 |
| D | 0 | 842 | 0 |
| Mode M9 | |||
|---|---|---|---|
| Quadrant | BADHDUFLAG | Total packets | Discarded packets |
| A | 0 | 78 | 0 |
| B | 0 | 78 | 0 |
| C | 0 | 78 | 0 |
| D | 0 | 78 | 0 |
| Quadrant | Total seconds | Saturated seconds | Saturation percentage |
|---|---|---|---|
| A | 41092 | 1397 | 3.399689% |
| B | 41094 | 1173 | 2.854431% |
| C | 41094 | 723 | 1.759381% |
| D | 41094 | 4390 | 10.682825% |
Noise dominated data is calculated using 1-second bins in cleaned event files. If a bin has >2000 counts, and if more than 50% of those come from <1% of pixels, then it is considered to be noise-dominated and hence unusable.
| Quadrant | # 1 sec bins | Bins with >0 counts | Bins with >2000 counts | High rate bins dominated by noise | Noise dominated (total time) | Noise dominated (detector-on time) | Marked lightcurve |
|---|---|---|---|---|---|---|---|
| A | 49018 | 41101 | 1115 | 1115 | 2.27% | 2.71% | 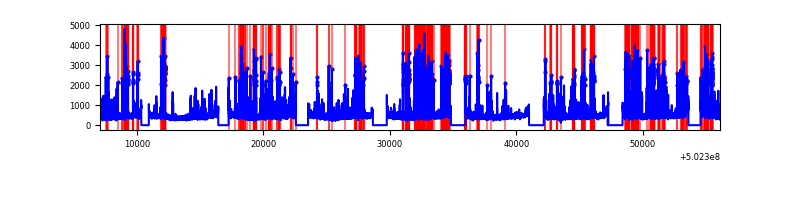 |
| B | 49019 | 41103 | 526 | 526 | 1.07% | 1.28% | 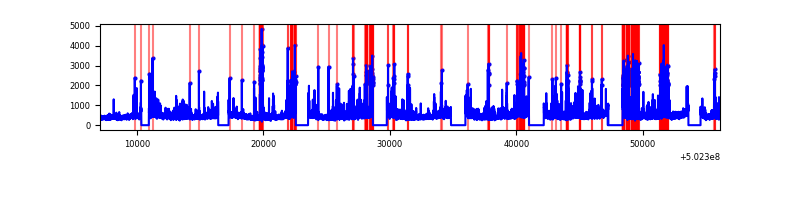 |
| C | 49019 | 41103 | 558 | 558 | 1.14% | 1.36% | 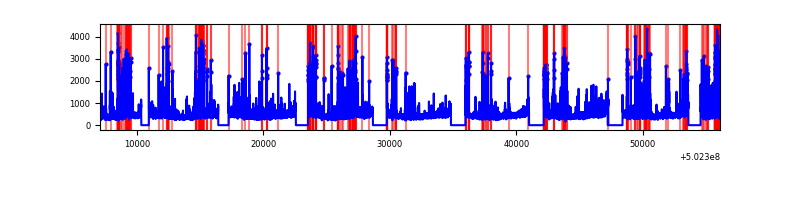 |
| D | 49019 | 41102 | 3854 | 3854 | 7.86% | 9.38% | 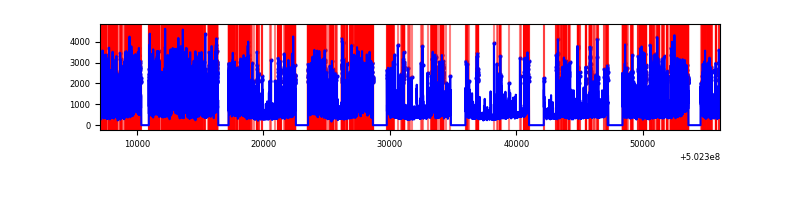 |
Top three noisy pixels from each quadrant. If the there are fewer than three noisy pixels in the level2.evt file, extra rows are filled as -1
| Pixel properties | Quadrant properties | ||||||
|---|---|---|---|---|---|---|---|
| Quadrant | DetID | PixID | Counts | Sigma | Mean | Median | Sigma |
| A | 0 | 8 | 2809327 | 2603.65 | 4427 | 4326 | 1077.3 |
| A | 15 | 32 | 2651591 | 2457.23 | 4427 | 4326 | 1077.3 |
| A | 0 | 250 | 456778 | 419.97 | 4427 | 4326 | 1077.3 |
| B | 5 | 185 | 2816239 | 2991.41 | 4397 | 4225 | 940.0 |
| B | 2 | 249 | 573724 | 605.83 | 4397 | 4225 | 940.0 |
| B | 4 | 81 | 390973 | 411.42 | 4397 | 4225 | 940.0 |
| C | 13 | 3 | 1734841 | 1462.56 | 4333 | 4294 | 1183.2 |
| C | 6 | 223 | 702463 | 590.05 | 4333 | 4294 | 1183.2 |
| C | 12 | 252 | 448225 | 375.19 | 4333 | 4294 | 1183.2 |
| D | 11 | 129 | 8616698 | 7402.99 | 4148 | 3978 | 1163.4 |
| D | 2 | 249 | 4008321 | 3441.9 | 4148 | 3978 | 1163.4 |
| D | 6 | 239 | 1995554 | 1711.84 | 4148 | 3978 | 1163.4 |
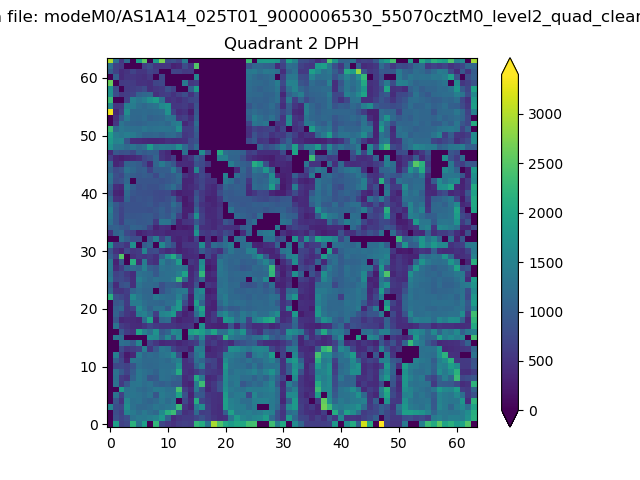
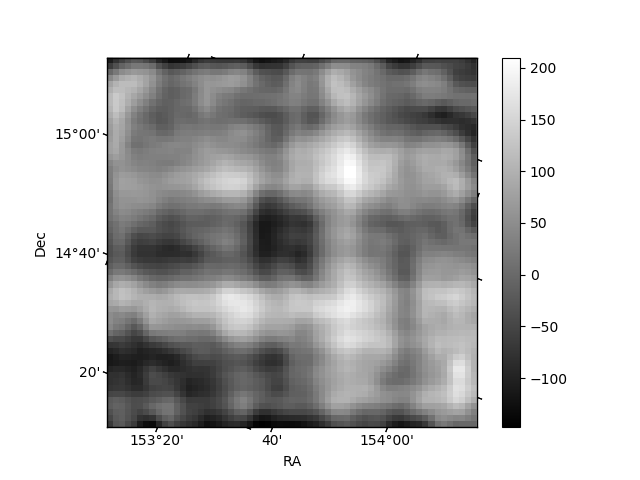
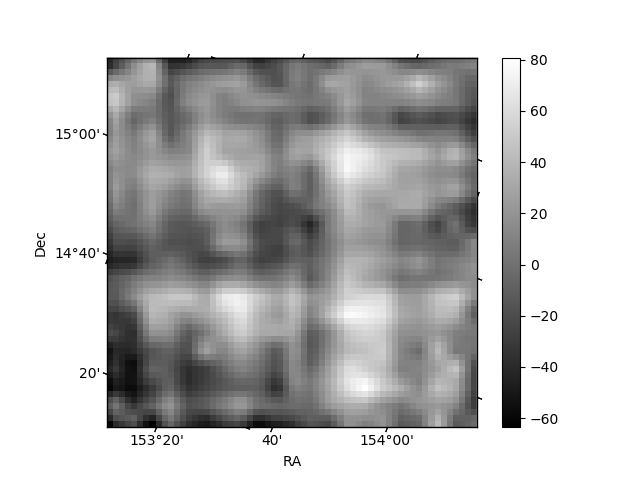
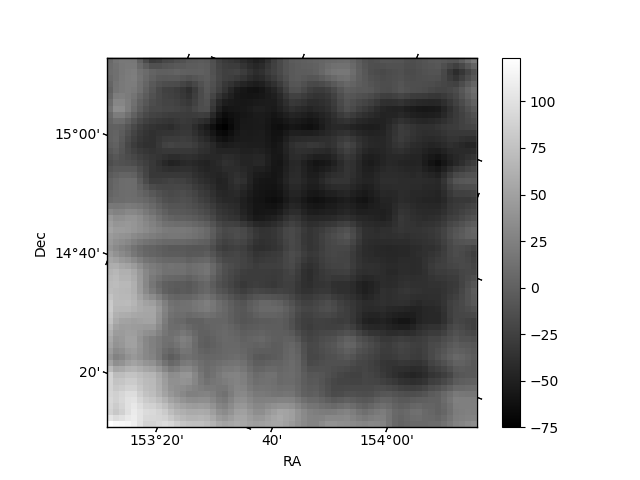
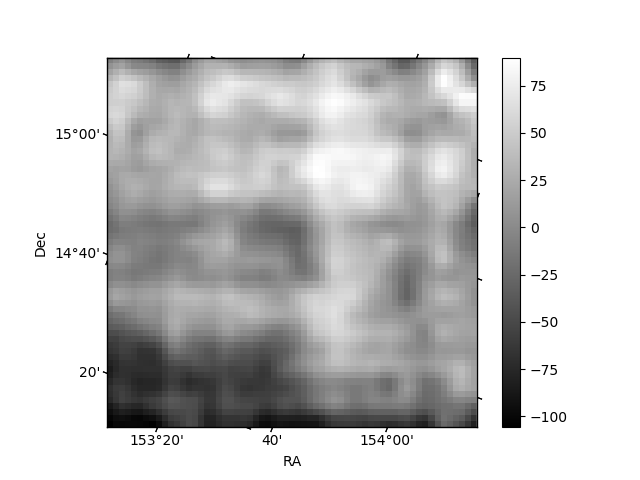
Histogram calculated using DETX and DETY for each event in the final _common_clean file
| Quadrant A | 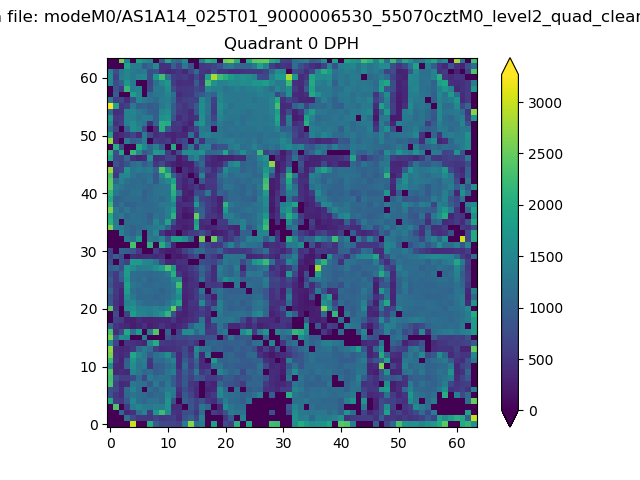 |
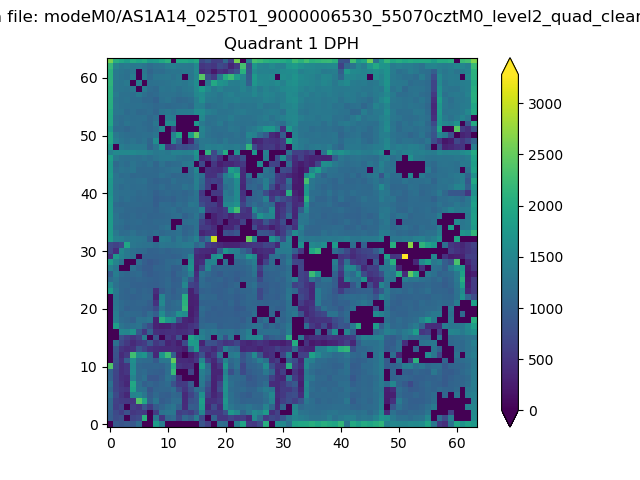 |
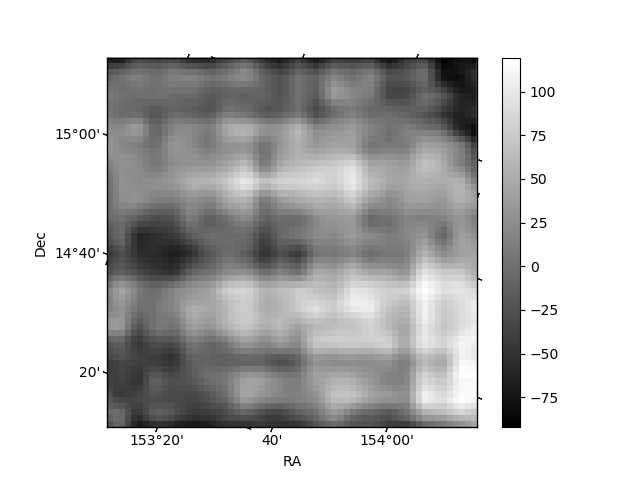
Quadrant B |
|---|---|---|---|
| Quadrant D | 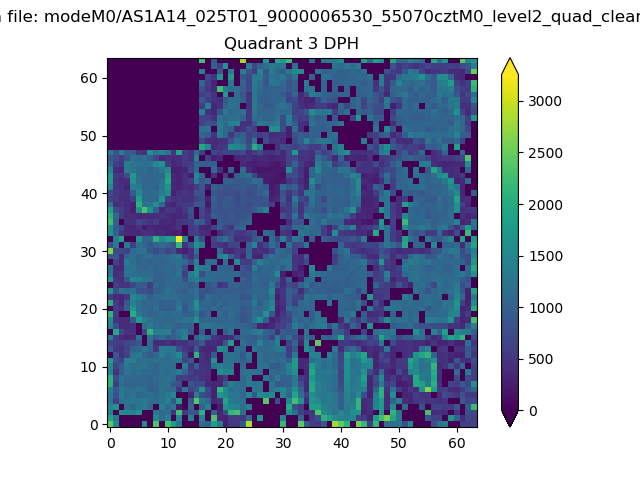 |
 |
Quadrant C |
| Plot type | Count rate plots | Images |
|---|---|---|
| Comparison with Poisson distribution Blue bars denote a histogram of data divided into 1 sec bins. Red curve is a Poisson curve with rate = median count rate of data. |
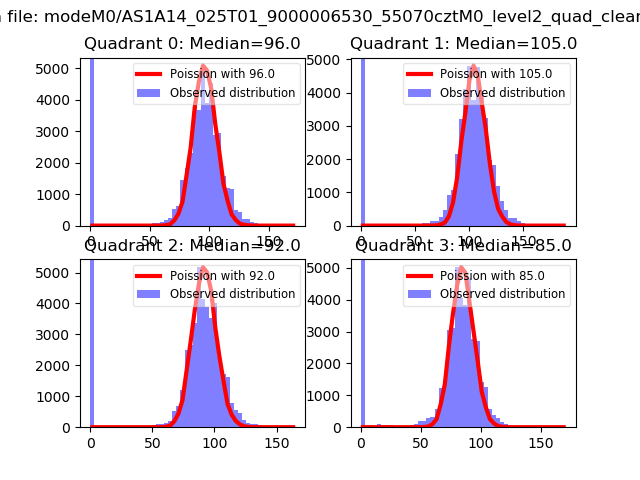 |
 |
| Quadrant-wise count rates Data is divided into 100 sec bins |
 |
|
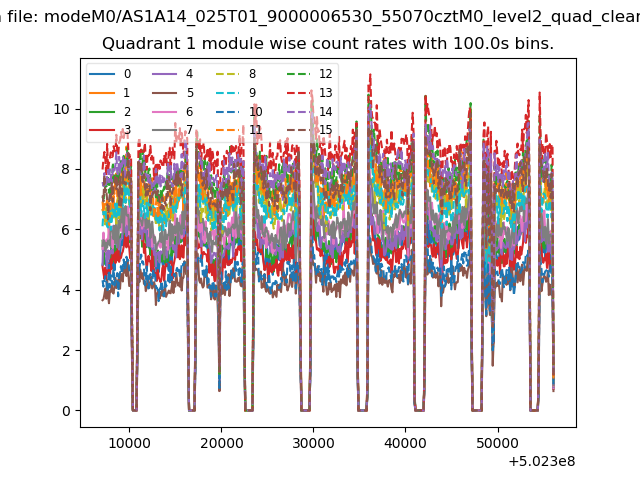
| Module-wise count rates for Quadrant A Data is divided into 100 sec bins |
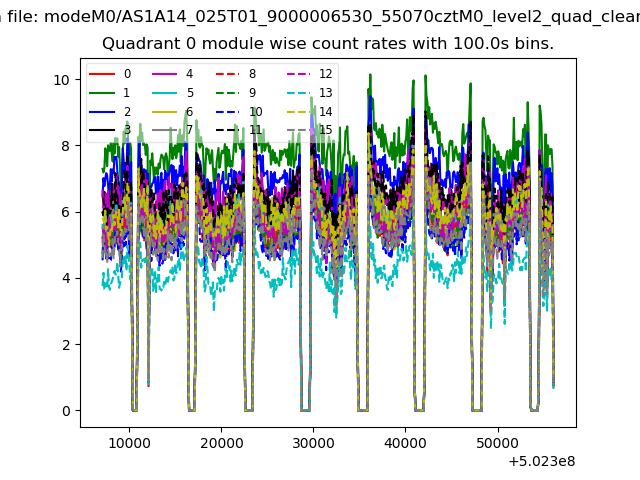 |
 |
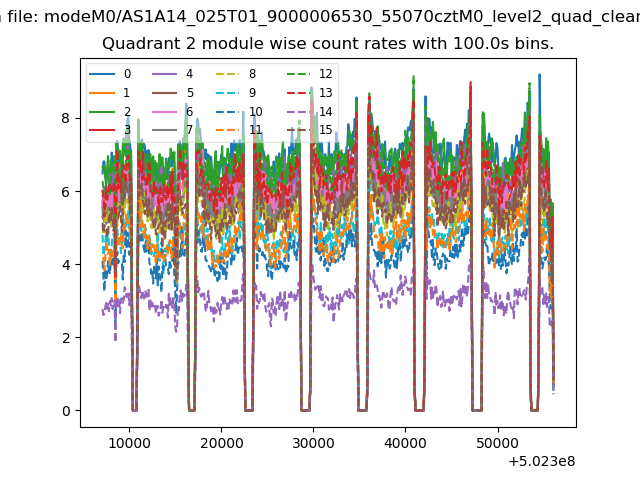
| Module-wise count rates for Quadrant B Data is divided into 100 sec bins |
 |
 |
| Module-wise count rates for Quadrant C Data is divided into 100 sec bins |
 |
 |
| Module-wise count rates for Quadrant D Data is divided into 100 sec bins |
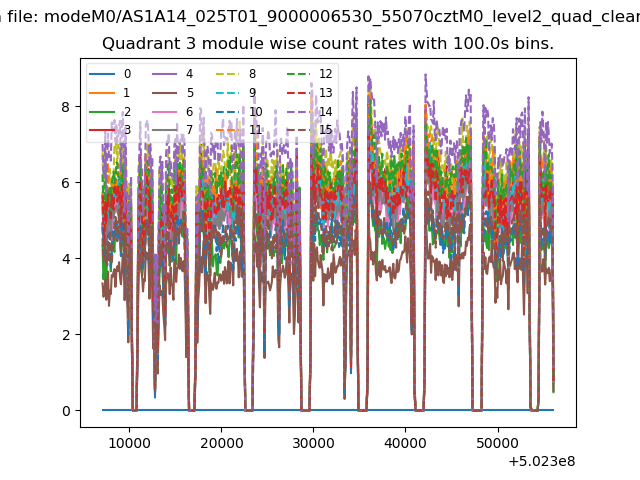 |
 |
| Parameter | Plot |
|---|---|
| CZT HV Monitor | 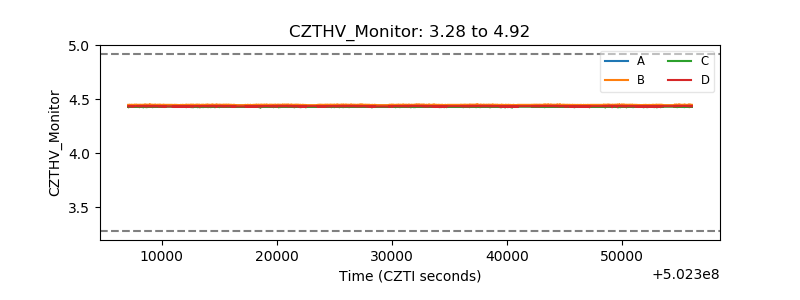 |
| D_VDD | 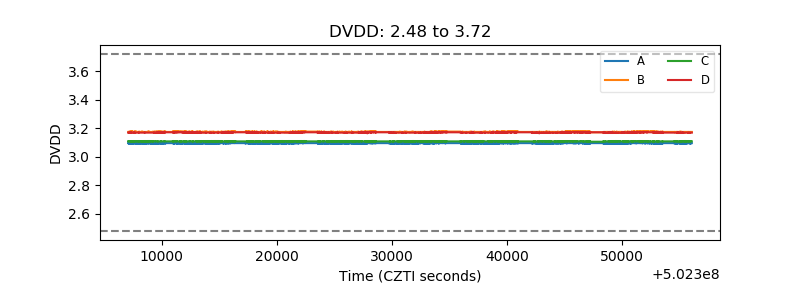 |
| Temperature 1 | 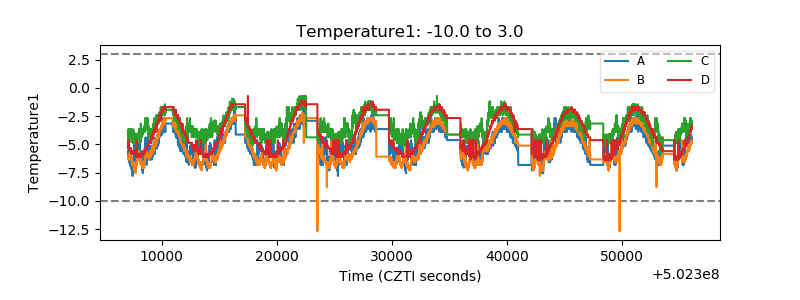 |
| Veto HV Monitor | 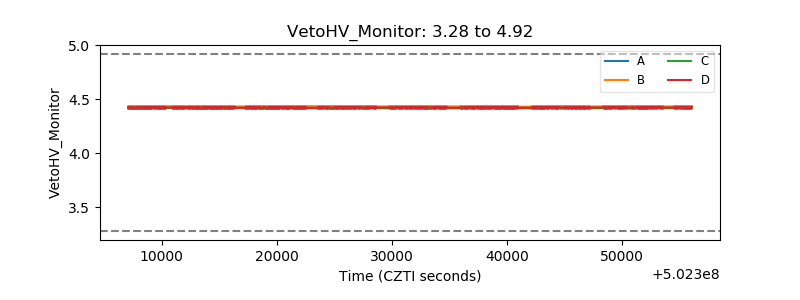 |
| Veto LLD | 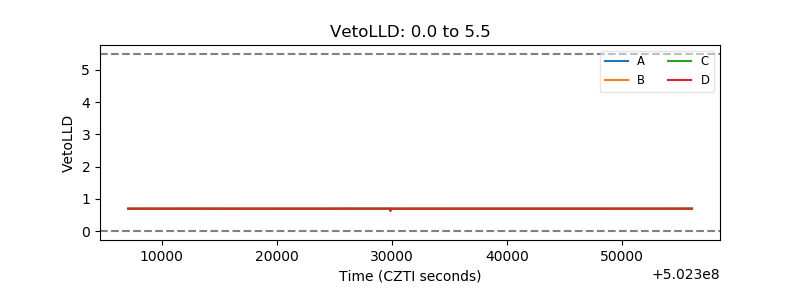 |
| Alpha Counter |  |
| _CPM_Rate | 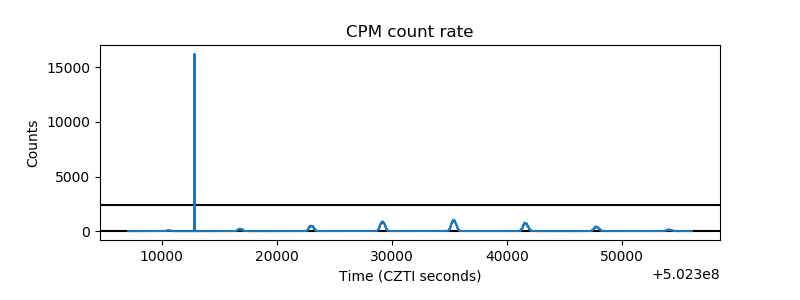 |
| CZT Counter | 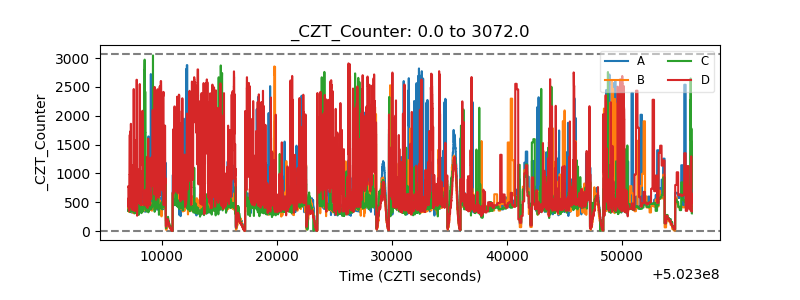 |
| +2.5 Volts monitor |  |
| +5 Volts monitor |  |
| _ROLL_ROT | 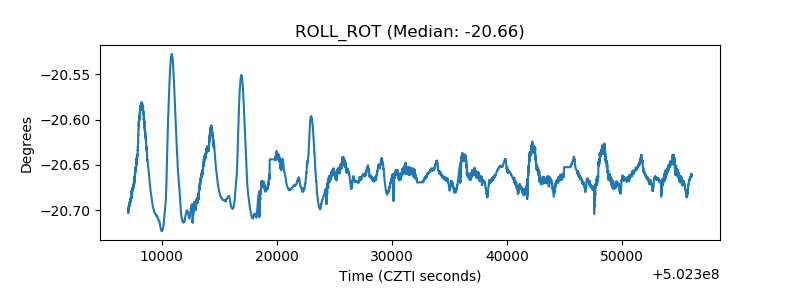 |
| _Roll_DEC | 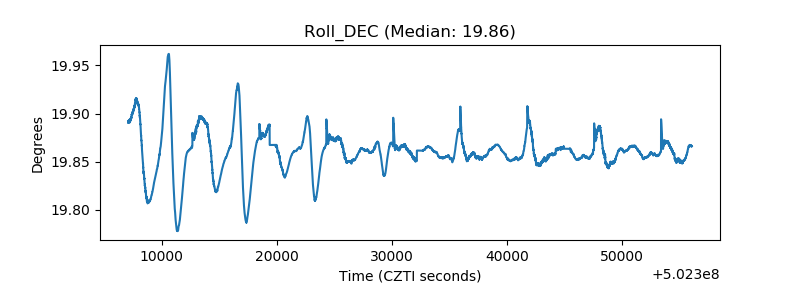 |
| _Roll_RA | 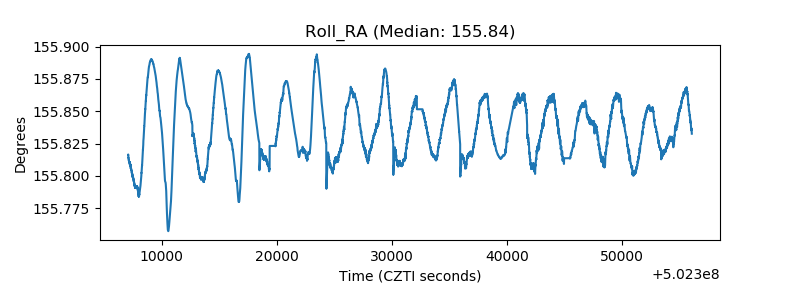 |
| Veto Counter | 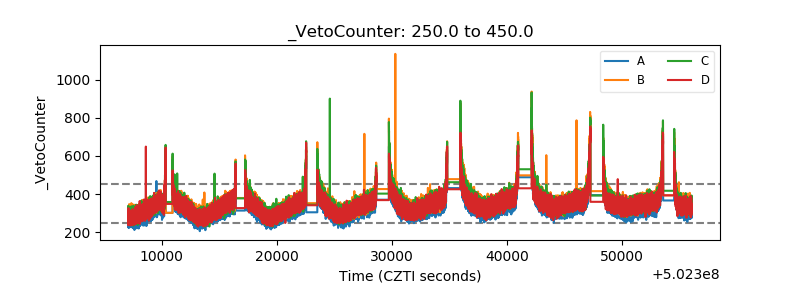 |