| Param | Original file | Final file |
|---|---|---|
| Filename | modeM0/AS1A14_025T01_9000006530_55073cztM0_level2.fits | modeM0/AS1A14_025T01_9000006530_55073cztM0_level2_quad_clean.evt |
| Size (bytes) | 608,832,000 | 105,998,400 |
| Size | 580.6 MB | 101.1 MB |
| Events in quadrant A | 4,203,290 | 721,925 |
| Events in quadrant B | 3,971,121 | 780,906 |
| Events in quadrant C | 3,690,667 | 693,405 |
| Events in quadrant D | 10,067,575 | 472,090 |
| Mode M0 | |||
|---|---|---|---|
| Quadrant | BADHDUFLAG | Total packets | Discarded packets |
| A | 0 | 17982 | 0 |
| B | 0 | 17500 | 0 |
| C | 0 | 16749 | 3 |
| D | 0 | 35238 | 12 |
| Mode SS | |||
|---|---|---|---|
| Quadrant | BADHDUFLAG | Total packets | Discarded packets |
| A | 0 | 156 | 0 |
| B | 0 | 156 | 0 |
| C | 0 | 156 | 0 |
| D | 0 | 156 | 0 |
| Quadrant | Total seconds | Saturated seconds | Saturation percentage |
|---|---|---|---|
| A | 7780 | 106 | 1.362468% |
| B | 7780 | 144 | 1.850900% |
| C | 7780 | 36 | 0.462725% |
| D | 7778 | 2249 | 28.914888% |
Noise dominated data is calculated using 1-second bins in cleaned event files. If a bin has >2000 counts, and if more than 50% of those come from <1% of pixels, then it is considered to be noise-dominated and hence unusable.
| Quadrant | # 1 sec bins | Bins with >0 counts | Bins with >2000 counts | High rate bins dominated by noise | Noise dominated (total time) | Noise dominated (detector-on time) | Marked lightcurve |
|---|---|---|---|---|---|---|---|
| A | 7780 | 7780 | 95 | 95 | 1.22% | 1.22% | 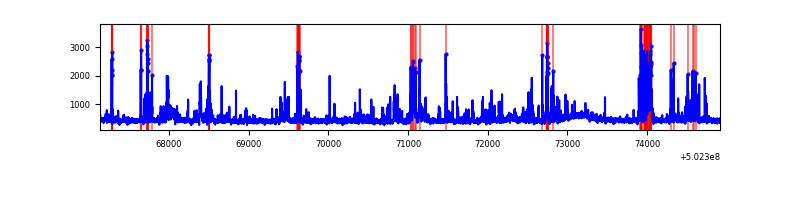 |
| B | 7780 | 7780 | 102 | 102 | 1.31% | 1.31% | 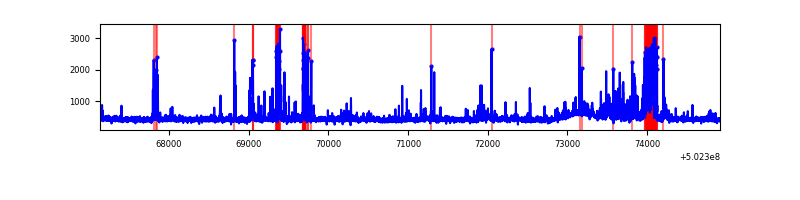 |
| C | 7781 | 7781 | 33 | 33 | 0.42% | 0.42% | 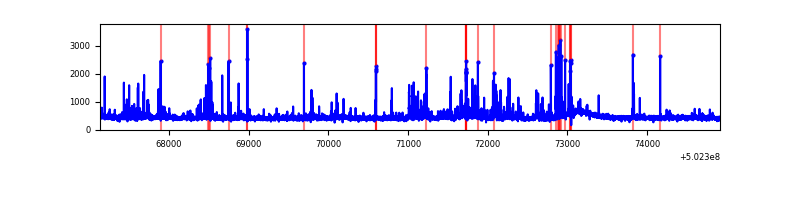 |
| D | 7781 | 7780 | 2231 | 2231 | 28.67% | 28.68% | 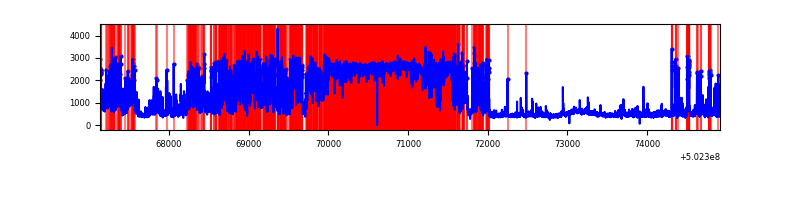 |
Top three noisy pixels from each quadrant. If the there are fewer than three noisy pixels in the level2.evt file, extra rows are filled as -1
| Pixel properties | Quadrant properties | ||||||
|---|---|---|---|---|---|---|---|
| Quadrant | DetID | PixID | Counts | Sigma | Mean | Median | Sigma |
| A | 15 | 32 | 594829 | 2870.97 | 834 | 815 | 206.9 |
| A | 0 | 8 | 265484 | 1279.19 | 834 | 815 | 206.9 |
| A | 8 | 62 | 29027 | 136.35 | 834 | 815 | 206.9 |
| B | 5 | 185 | 505619 | 2836.21 | 822 | 793 | 178.0 |
| B | 2 | 249 | 73370 | 407.75 | 822 | 793 | 178.0 |
| B | 4 | 81 | 47247 | 260.99 | 822 | 793 | 178.0 |
| C | 13 | 3 | 260640 | 1168.74 | 814 | 809 | 222.3 |
| C | 12 | 252 | 84893 | 378.22 | 814 | 809 | 222.3 |
| C | 14 | 254 | 57792 | 256.31 | 814 | 809 | 222.3 |
| D | 11 | 129 | 6107590 | 30868.63 | 700 | 670 | 197.8 |
| D | 9 | 1 | 399931 | 2018.14 | 700 | 670 | 197.8 |
| D | 6 | 239 | 213671 | 1076.66 | 700 | 670 | 197.8 |
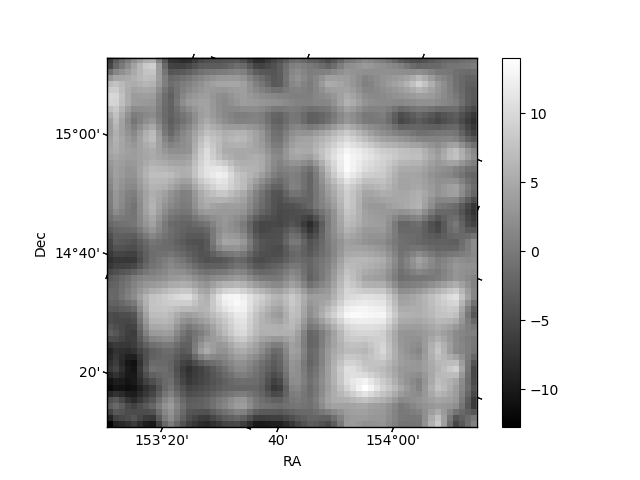
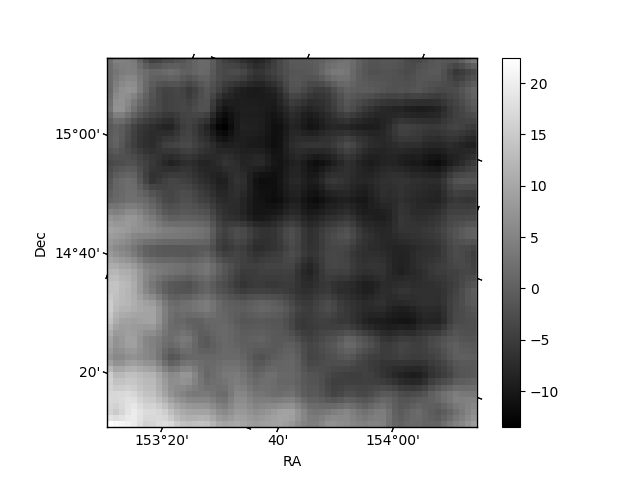
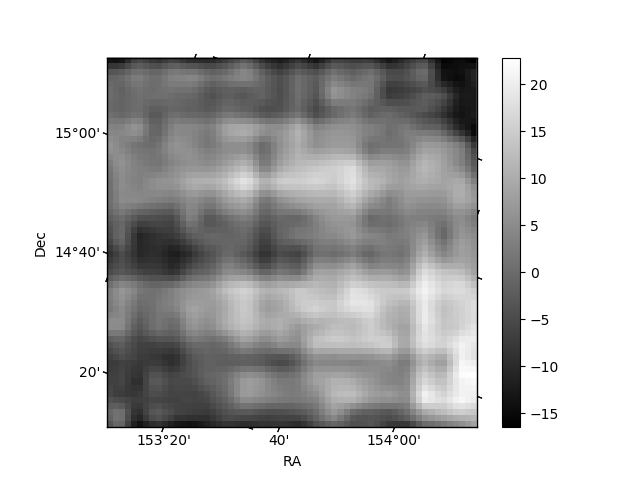
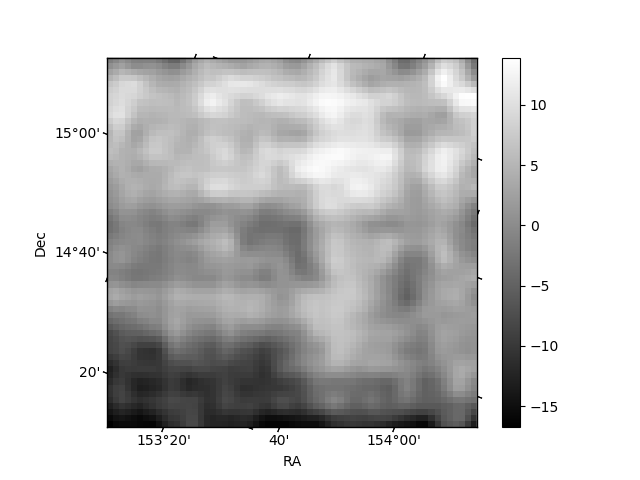
Histogram calculated using DETX and DETY for each event in the final _common_clean file
| Quadrant A | 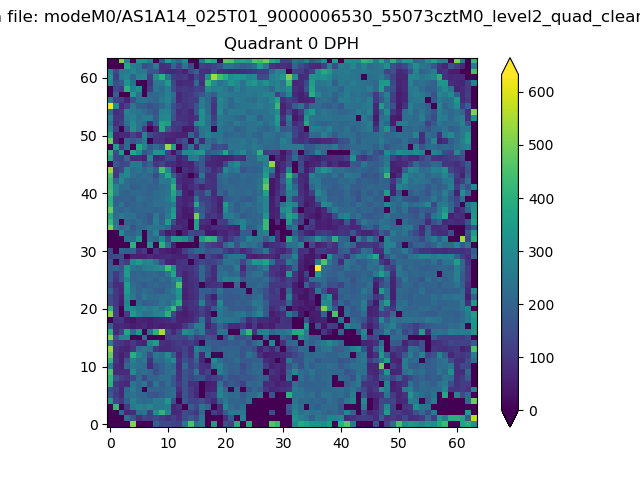 |
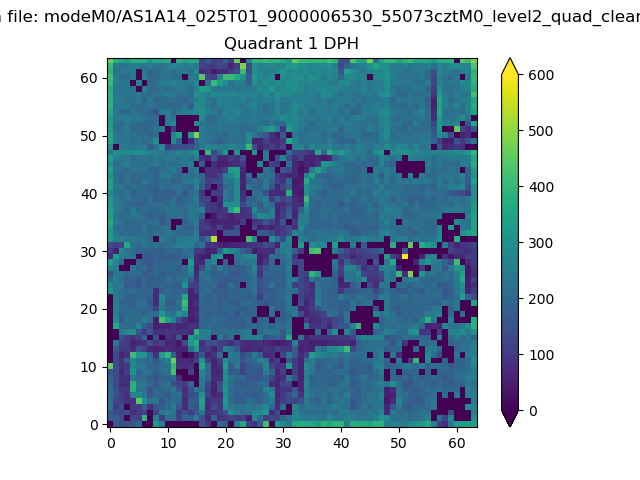 |
Quadrant B |
|---|---|---|---|
| Quadrant D | 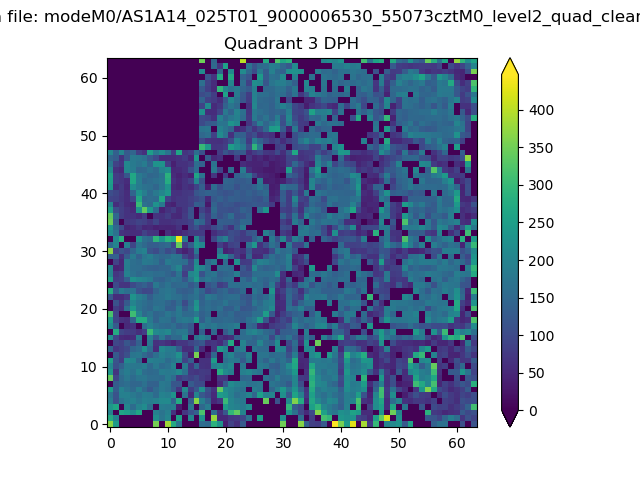 |
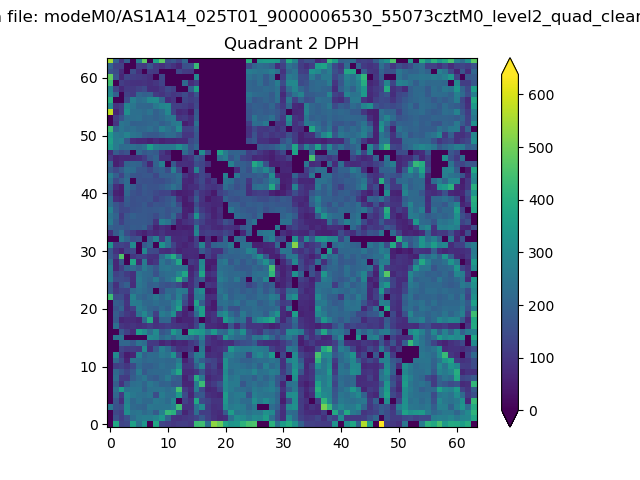 |
Quadrant C |
| Plot type | Count rate plots | Images |
|---|---|---|
| Comparison with Poisson distribution Blue bars denote a histogram of data divided into 1 sec bins. Red curve is a Poisson curve with rate = median count rate of data. |
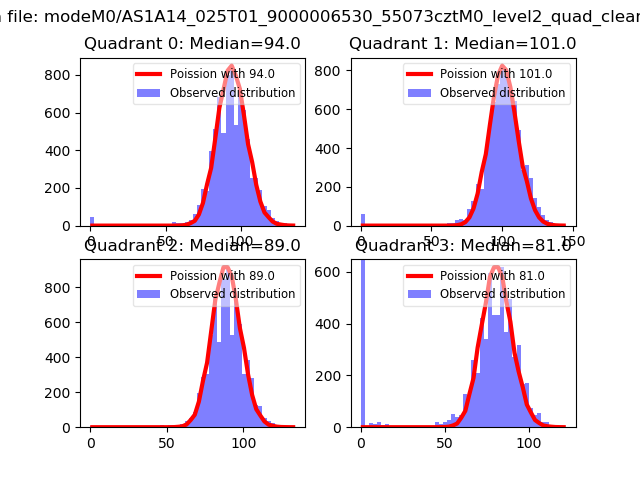 |
 |
| Quadrant-wise count rates Data is divided into 100 sec bins |
 |
|
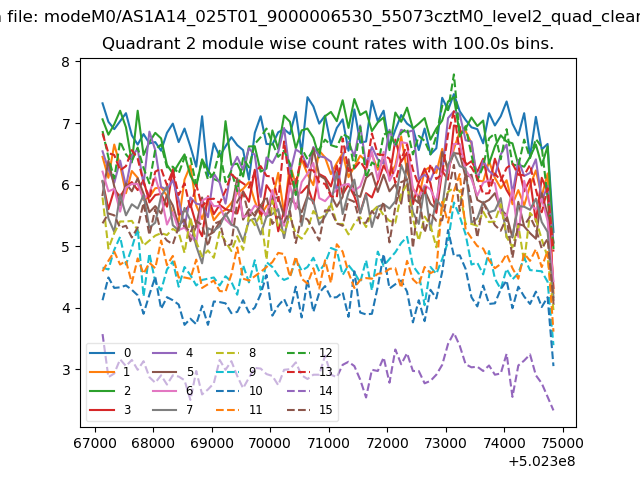
| Module-wise count rates for Quadrant A Data is divided into 100 sec bins |
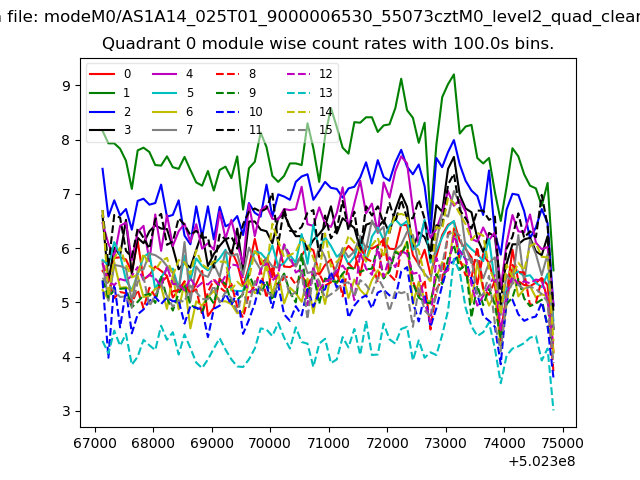 |
 |
| Module-wise count rates for Quadrant B Data is divided into 100 sec bins |
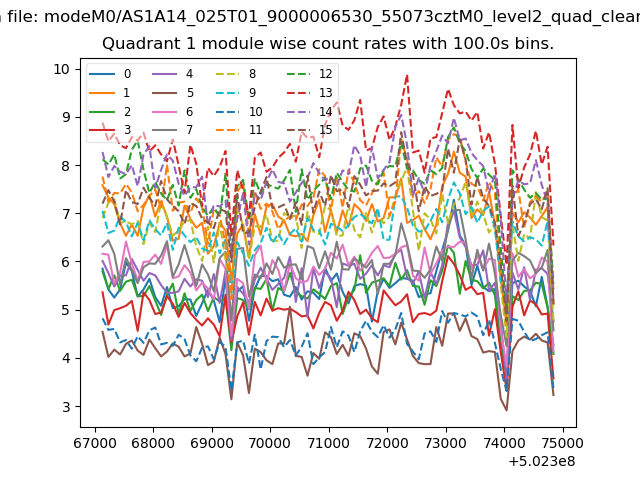 |
 |
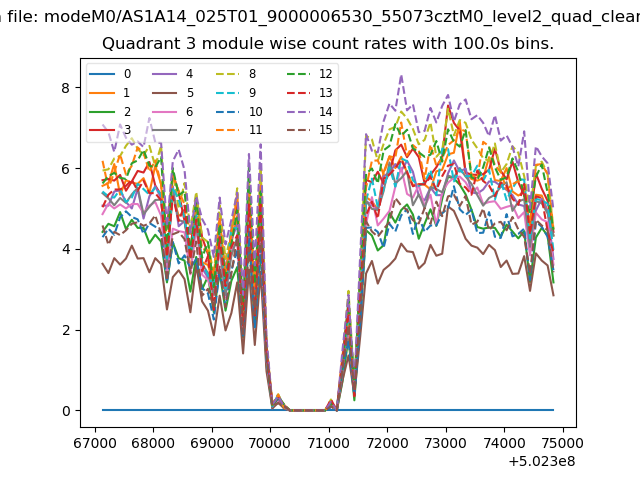
| Module-wise count rates for Quadrant C Data is divided into 100 sec bins |
 |
 |
| Module-wise count rates for Quadrant D Data is divided into 100 sec bins |
 |
 |
| Parameter | Plot |
|---|---|
| CZT HV Monitor | 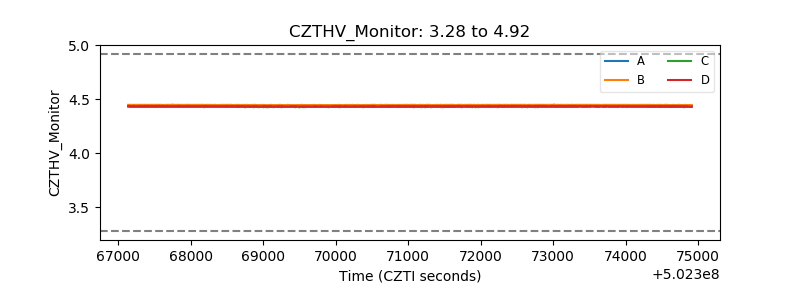 |
| D_VDD | 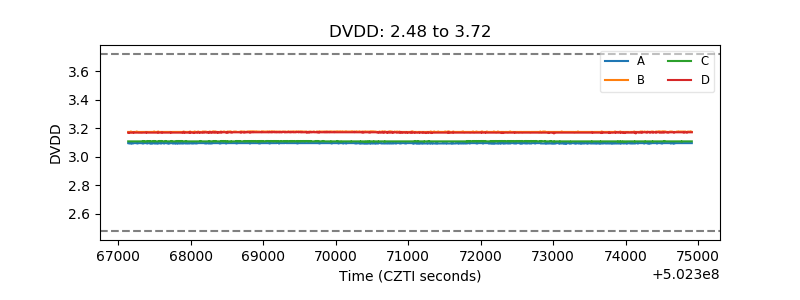 |
| Temperature 1 | 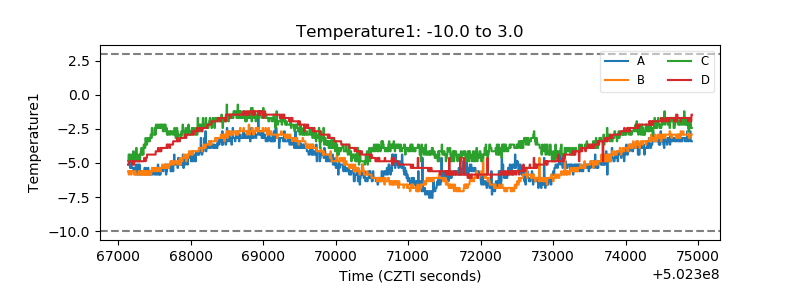 |
| Veto HV Monitor |  |
| Veto LLD | 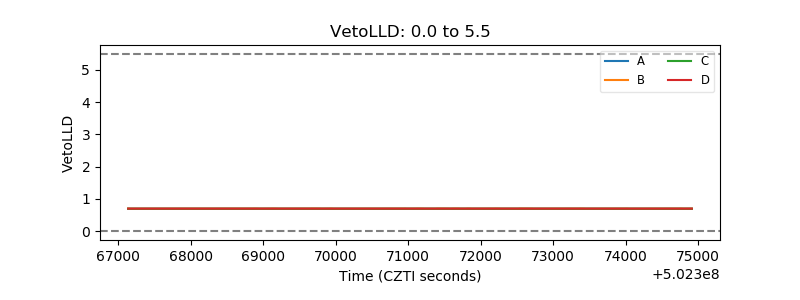 |
| Alpha Counter | 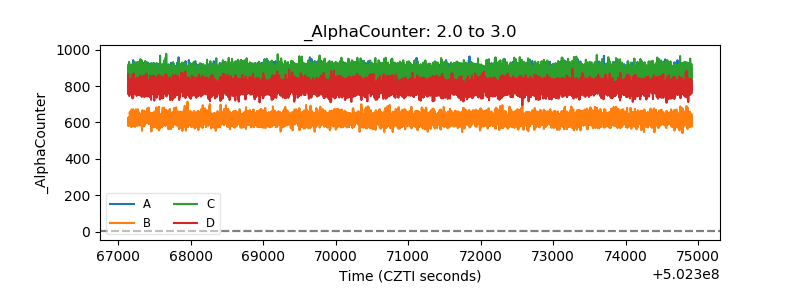 |
| _CPM_Rate |  |
| CZT Counter | 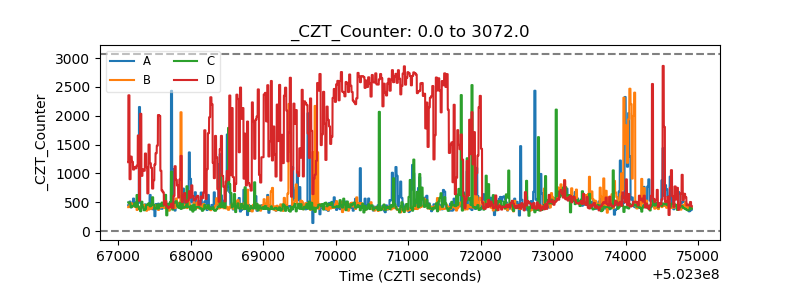 |
| +2.5 Volts monitor |  |
| +5 Volts monitor |  |
| _ROLL_ROT | 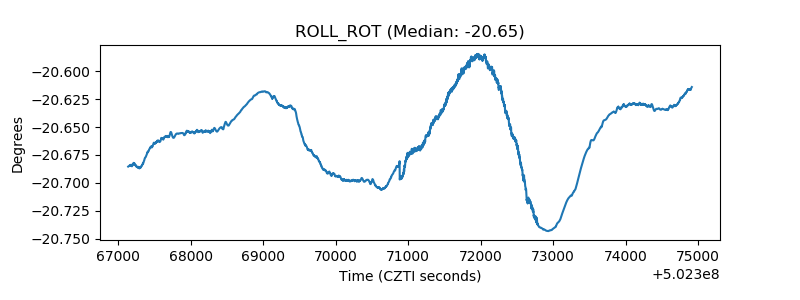 |
| _Roll_DEC | 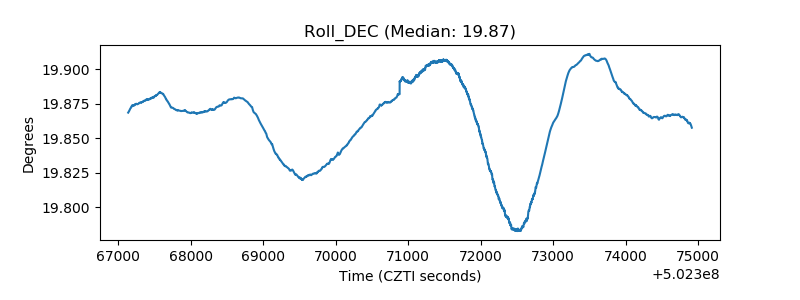 |
| _Roll_RA |  |
| Veto Counter | 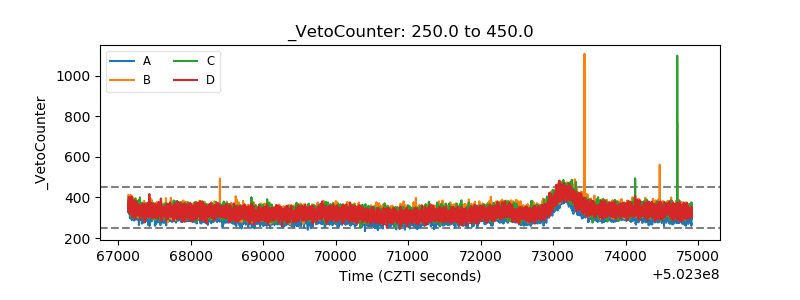 |