| Param | Original file | Final file |
|---|---|---|
| Filename | modeM0/AS1A14_025T01_9000006530_55074cztM0_level2.fits | modeM0/AS1A14_025T01_9000006530_55074cztM0_level2_quad_clean.evt |
| Size (bytes) | 209,761,920 | 35,429,760 |
| Size | 200.0 MB | 33.8 MB |
| Events in quadrant A | 2,209,105 | 211,613 |
| Events in quadrant B | 1,363,779 | 255,008 |
| Events in quadrant C | 1,150,450 | 230,827 |
| Events in quadrant D | 2,834,236 | 186,655 |
| Mode M0 | |||
|---|---|---|---|
| Quadrant | BADHDUFLAG | Total packets | Discarded packets |
| A | 0 | 8710 | 343 |
| B | 0 | 6385 | 382 |
| C | 0 | 5598 | 174 |
| D | 0 | 10571 | 375 |
| Mode SS | |||
|---|---|---|---|
| Quadrant | BADHDUFLAG | Total packets | Discarded packets |
| A | 0 | 54 | 2 |
| B | 0 | 54 | 0 |
| C | 0 | 54 | 0 |
| D | 0 | 54 | 2 |
| Quadrant | Total seconds | Saturated seconds | Saturation percentage |
|---|---|---|---|
| A | 2628 | 344 | 13.089802% |
| B | 2625 | 60 | 2.285714% |
| C | 2655 | 7 | 0.263653% |
| D | 2635 | 430 | 16.318786% |
Noise dominated data is calculated using 1-second bins in cleaned event files. If a bin has >2000 counts, and if more than 50% of those come from <1% of pixels, then it is considered to be noise-dominated and hence unusable.
| Quadrant | # 1 sec bins | Bins with >0 counts | Bins with >2000 counts | High rate bins dominated by noise | Noise dominated (total time) | Noise dominated (detector-on time) | Marked lightcurve |
|---|---|---|---|---|---|---|---|
| A | 2814 | 2696 | 320 | 320 | 11.37% | 11.87% | 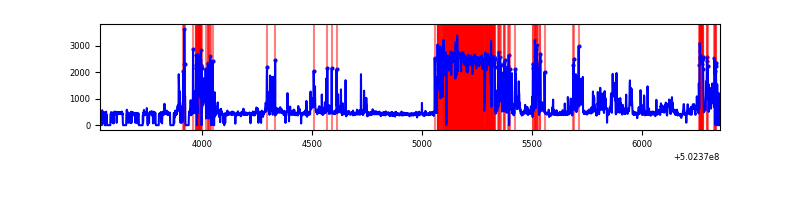 |
| B | 2814 | 2693 | 39 | 39 | 1.39% | 1.45% | 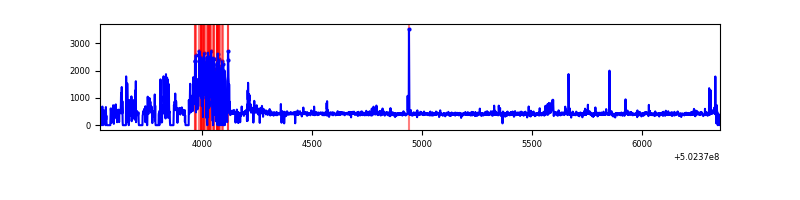 |
| C | 2817 | 2719 | 5 | 5 | 0.18% | 0.18% | 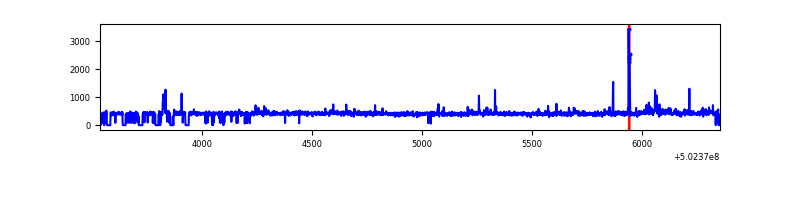 |
| D | 2807 | 2696 | 446 | 446 | 15.89% | 16.54% | 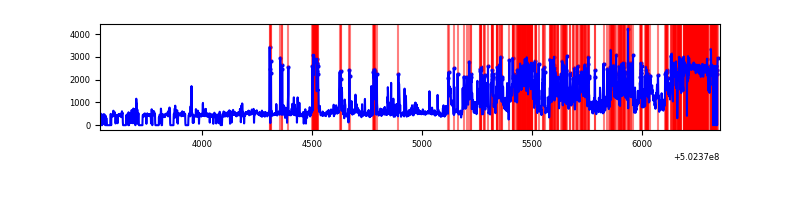 |
Top three noisy pixels from each quadrant. If the there are fewer than three noisy pixels in the level2.evt file, extra rows are filled as -1
| Pixel properties | Quadrant properties | ||||||
|---|---|---|---|---|---|---|---|
| Quadrant | DetID | PixID | Counts | Sigma | Mean | Median | Sigma |
| A | 15 | 32 | 923675 | 13994.81 | 260 | 253 | 66.0 |
| A | 0 | 8 | 216635 | 3279.35 | 260 | 253 | 66.0 |
| A | 3 | 62 | 25035 | 375.58 | 260 | 253 | 66.0 |
| B | 5 | 185 | 259333 | 4325.83 | 272 | 262 | 59.9 |
| B | 10 | 247 | 15124 | 248.16 | 272 | 262 | 59.9 |
| B | 12 | 111 | 7136 | 114.78 | 272 | 262 | 59.9 |
| C | 14 | 246 | 14922 | 193.22 | 275 | 272 | 75.8 |
| C | 14 | 254 | 12660 | 163.38 | 275 | 272 | 75.8 |
| C | 9 | 38 | 12352 | 159.32 | 275 | 272 | 75.8 |
| D | 11 | 129 | 1496557 | 20105.49 | 259 | 247 | 74.4 |
| D | 2 | 31 | 76313 | 1022.08 | 259 | 247 | 74.4 |
| D | 9 | 1 | 56733 | 758.99 | 259 | 247 | 74.4 |
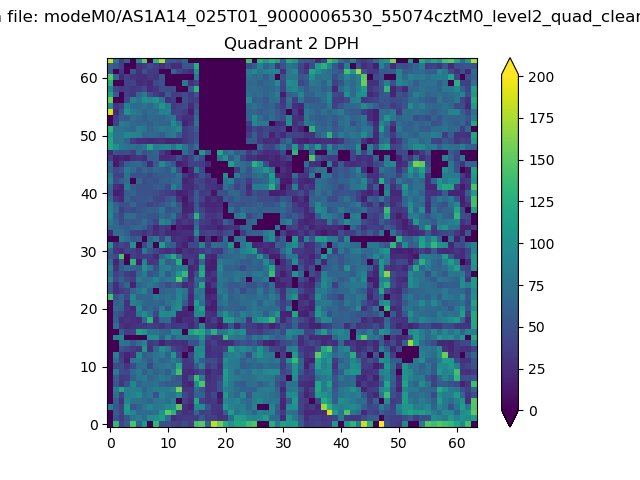
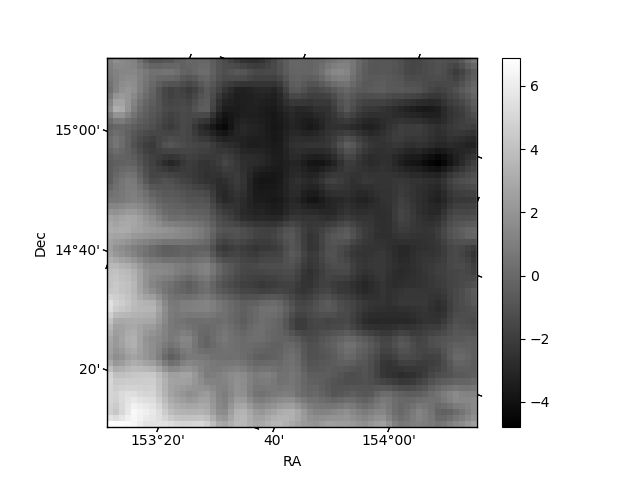
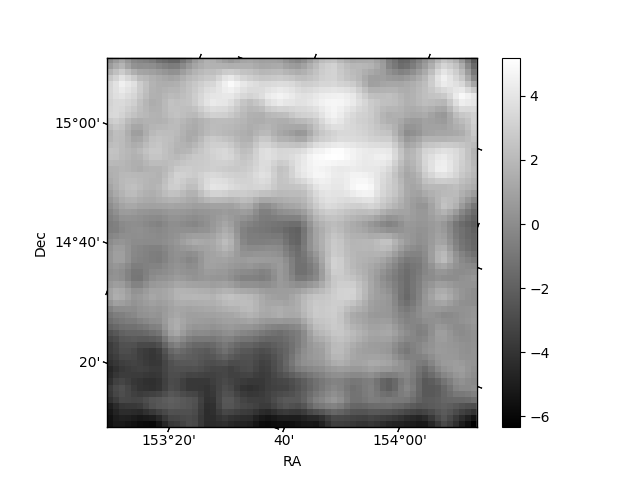
Histogram calculated using DETX and DETY for each event in the final _common_clean file
| Quadrant A | 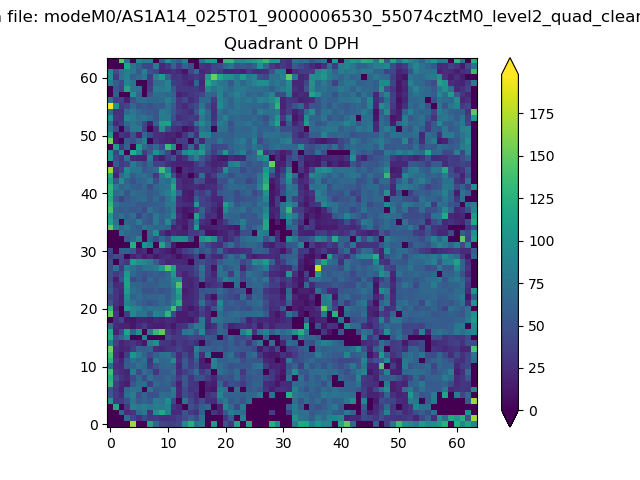 |
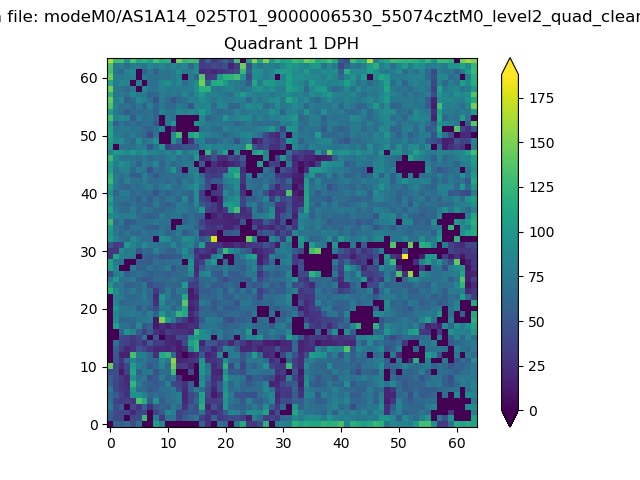 |
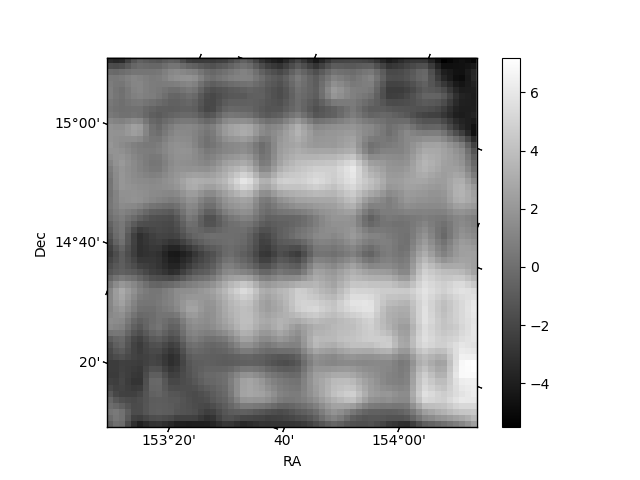
Quadrant B |
|---|---|---|---|
| Quadrant D | 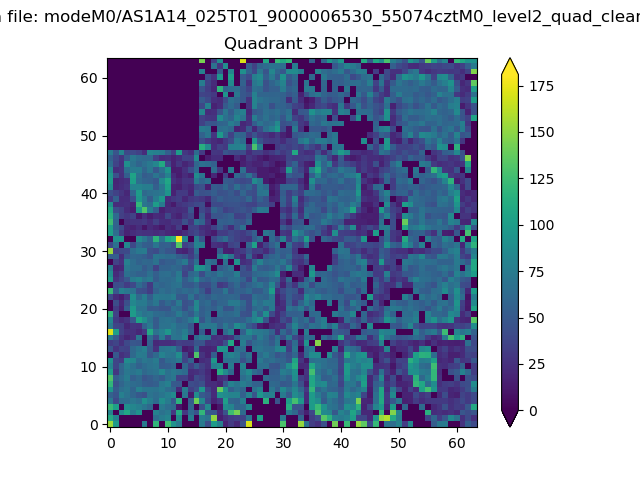 |
 |
Quadrant C |
| Plot type | Count rate plots | Images |
|---|---|---|
| Comparison with Poisson distribution Blue bars denote a histogram of data divided into 1 sec bins. Red curve is a Poisson curve with rate = median count rate of data. |
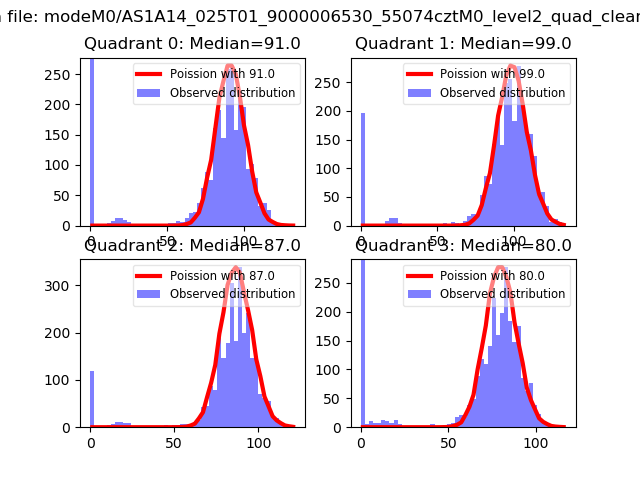 |
 |
| Quadrant-wise count rates Data is divided into 100 sec bins |
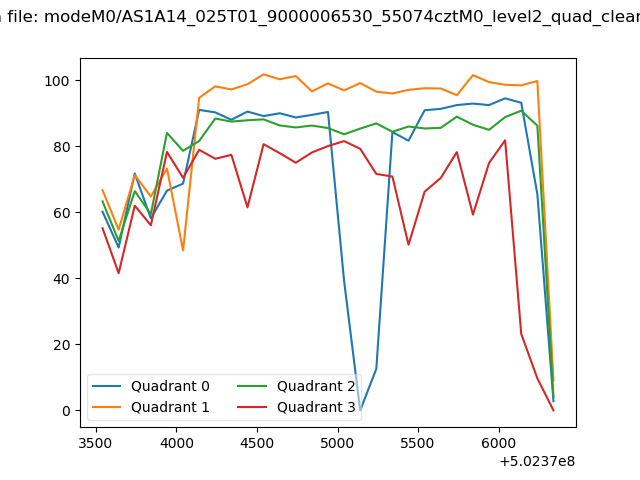 |
|
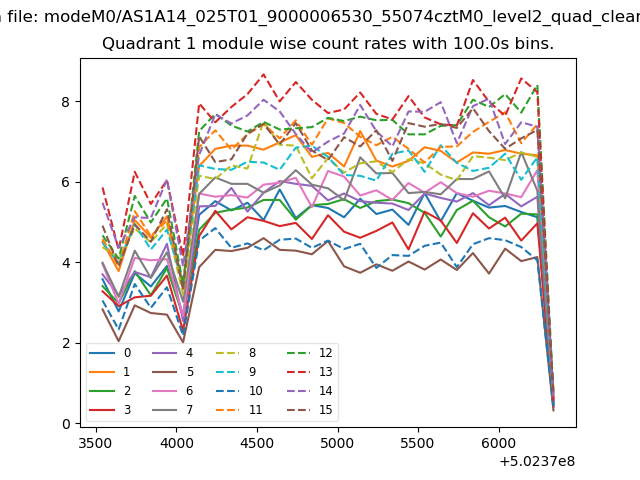
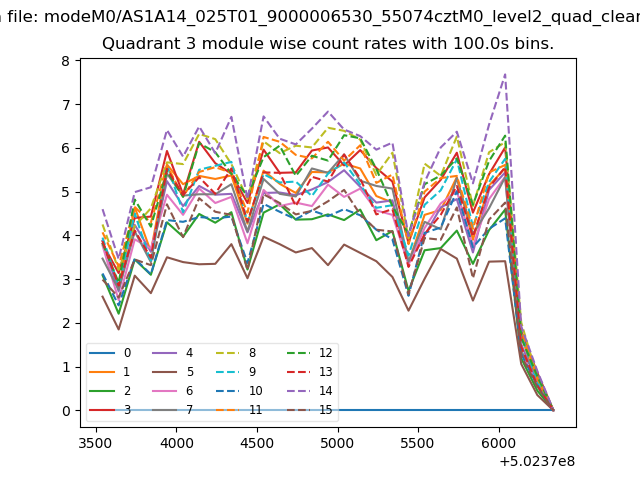
| Module-wise count rates for Quadrant A Data is divided into 100 sec bins |
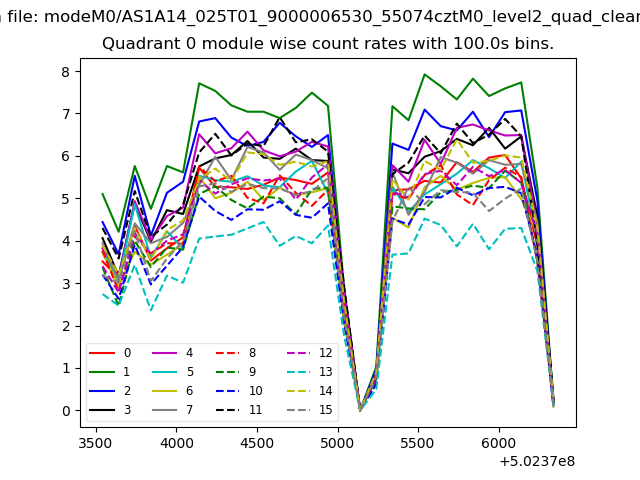 |
 |
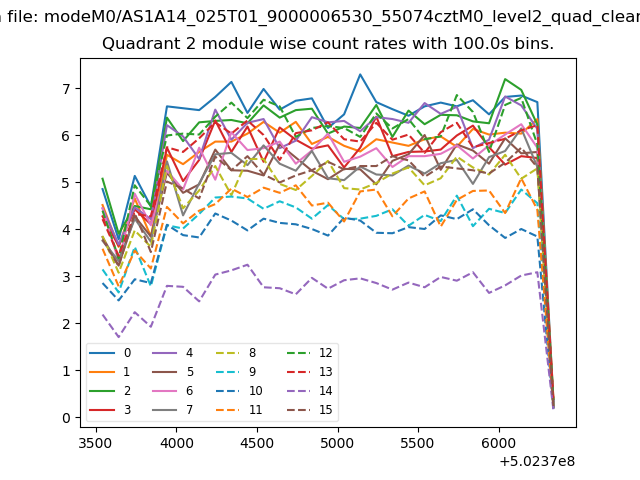
| Module-wise count rates for Quadrant B Data is divided into 100 sec bins |
 |
 |
| Module-wise count rates for Quadrant C Data is divided into 100 sec bins |
 |
 |
| Module-wise count rates for Quadrant D Data is divided into 100 sec bins |
 |
 |
| Parameter | Plot |
|---|---|
| CZT HV Monitor | 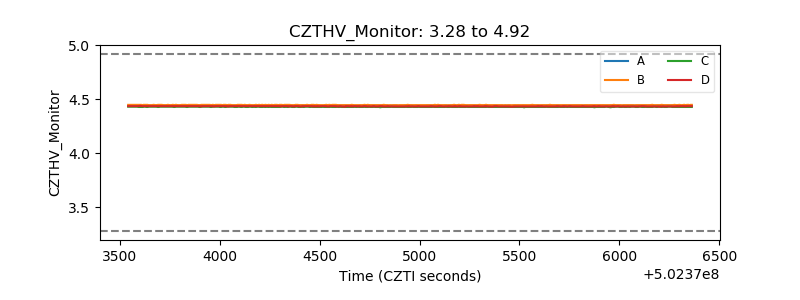 |
| D_VDD | 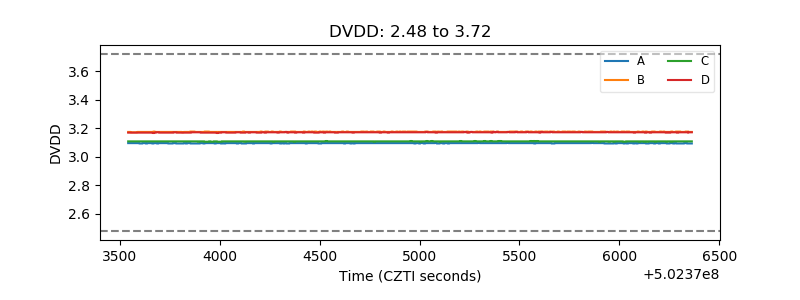 |
| Temperature 1 |  |
| Veto HV Monitor |  |
| Veto LLD | 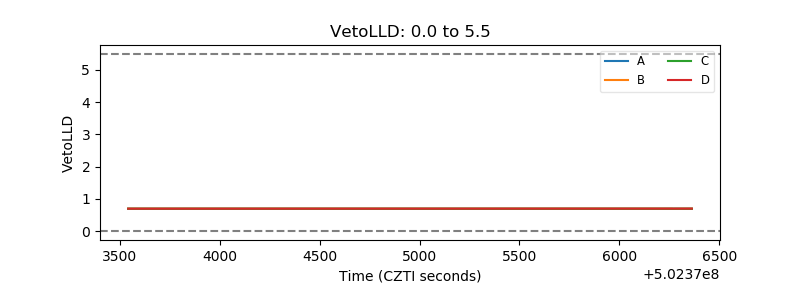 |
| Alpha Counter | 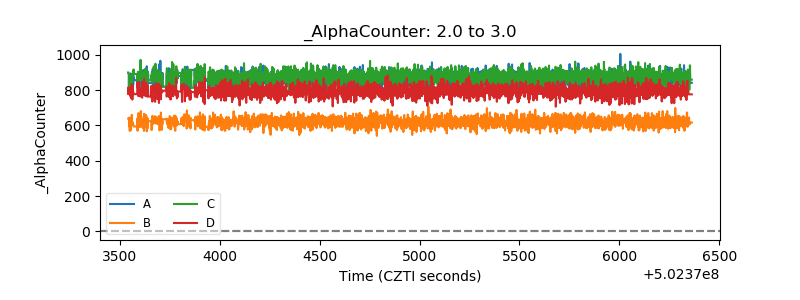 |
| _CPM_Rate | 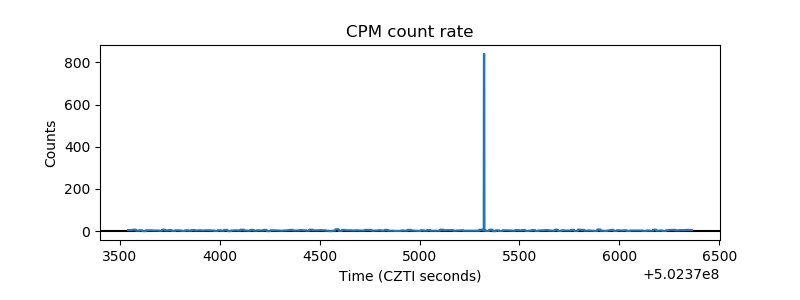 |
| CZT Counter | 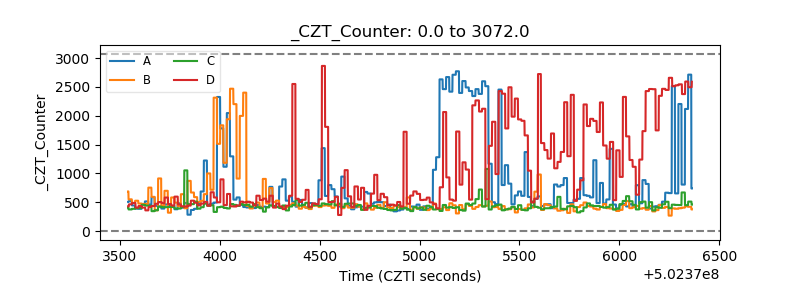 |
| +2.5 Volts monitor |  |
| +5 Volts monitor |  |
| _ROLL_ROT | 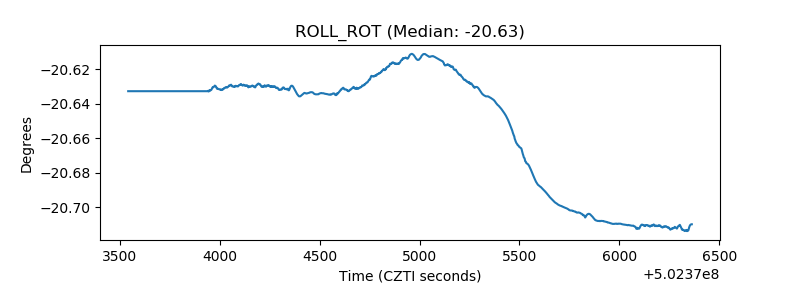 |
| _Roll_DEC | 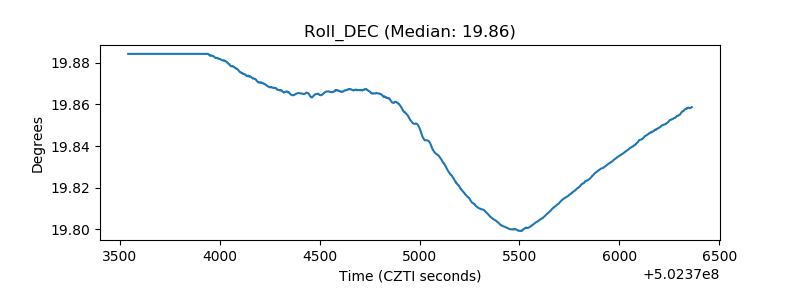 |
| _Roll_RA | 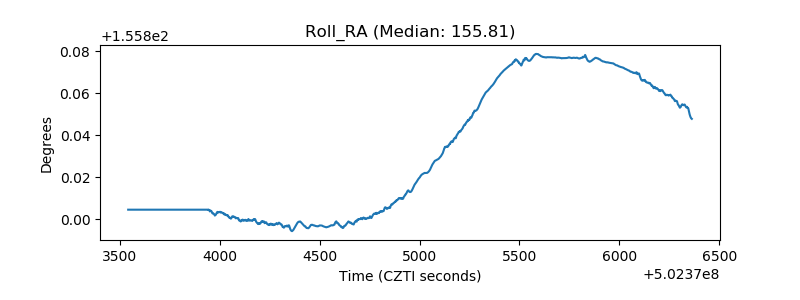 |
| Veto Counter | 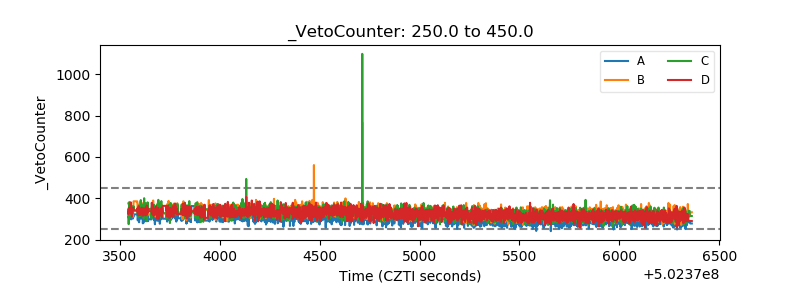 |